| Param | Original file | Final file |
|---|---|---|
| Filename | modeM0/AS1C09_011T05_9000006466_51833cztM0_level2.fits | modeM0/AS1C09_011T05_9000006466_51833cztM0_level2_quad_clean.evt |
| Size (bytes) | 761,065,920 | 97,637,760 |
| Size | 725.8 MB | 93.1 MB |
| Events in quadrant A | 7,502,286 | 568,891 |
| Events in quadrant B | 5,982,007 | 711,179 |
| Events in quadrant C | 6,957,381 | 614,004 |
| Events in quadrant D | 7,161,805 | 549,988 |
| Mode SS | |||
|---|---|---|---|
| Quadrant | BADHDUFLAG | Total packets | Discarded packets |
| A | 0 | 148 | 0 |
| B | 0 | 148 | 0 |
| C | 0 | 148 | 0 |
| D | 0 | 148 | 0 |
| Mode M0 | |||
|---|---|---|---|
| Quadrant | BADHDUFLAG | Total packets | Discarded packets |
| A | 0 | 27382 | 0 |
| B | 0 | 22946 | 0 |
| C | 0 | 25858 | 0 |
| D | 0 | 26374 | 0 |
| Quadrant | Total seconds | Saturated seconds | Saturation percentage |
|---|---|---|---|
| A | 7355 | 1328 | 18.055744% |
| B | 7355 | 511 | 6.947655% |
| C | 7355 | 696 | 9.462950% |
| D | 7355 | 989 | 13.446635% |
Noise dominated data is calculated using 1-second bins in cleaned event files. If a bin has >2000 counts, and if more than 50% of those come from <1% of pixels, then it is considered to be noise-dominated and hence unusable.
| Quadrant | # 1 sec bins | Bins with >0 counts | Bins with >2000 counts | High rate bins dominated by noise | Noise dominated (total time) | Noise dominated (detector-on time) | Marked lightcurve |
|---|---|---|---|---|---|---|---|
| A | 7355 | 7355 | 1042 | 1042 | 14.17% | 14.17% | 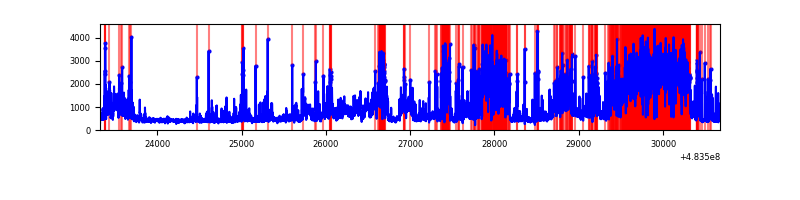 |
| B | 7355 | 7355 | 296 | 296 | 4.02% | 4.02% | 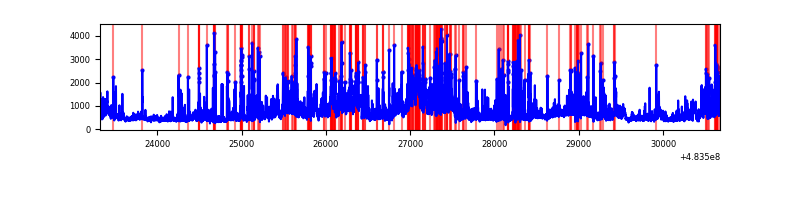 |
| C | 7355 | 7355 | 604 | 604 | 8.21% | 8.21% | 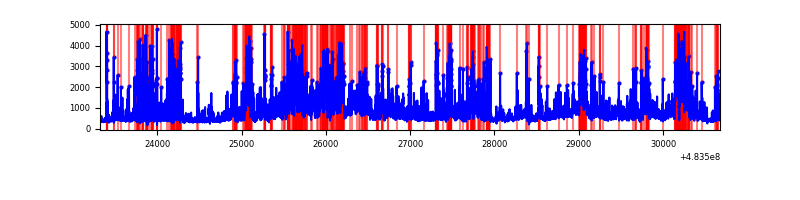 |
| D | 7355 | 7355 | 841 | 841 | 11.43% | 11.43% | 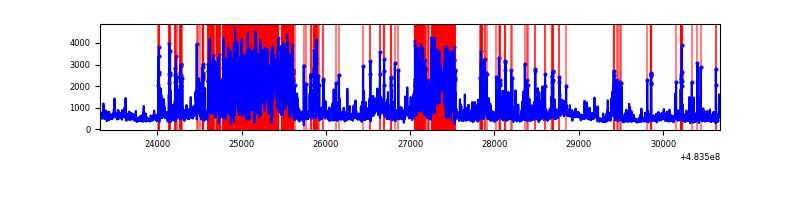 |
Top three noisy pixels from each quadrant. If the there are fewer than three noisy pixels in the level2.evt file, extra rows are filled as -1
| Pixel properties | Quadrant properties | ||||||
|---|---|---|---|---|---|---|---|
| Quadrant | DetID | PixID | Counts | Sigma | Mean | Median | Sigma |
| A | 13 | 248 | 2610106 | 15110.47 | 707 | 691 | 172.7 |
| A | 12 | 3 | 678722 | 3926.31 | 707 | 691 | 172.7 |
| A | 11 | 3 | 529658 | 3063.11 | 707 | 691 | 172.7 |
| B | 5 | 185 | 644791 | 4063.53 | 744 | 719 | 158.5 |
| B | 4 | 206 | 472957 | 2979.41 | 744 | 719 | 158.5 |
| B | 10 | 254 | 377616 | 2377.89 | 744 | 719 | 158.5 |
| C | 15 | 192 | 1059422 | 5340.93 | 715 | 710 | 198.2 |
| C | 0 | 192 | 837368 | 4220.73 | 715 | 710 | 198.2 |
| C | 12 | 254 | 620938 | 3128.89 | 715 | 710 | 198.2 |
| D | 11 | 129 | 2405907 | 12375.44 | 696 | 671 | 194.4 |
| D | 12 | 6 | 659161 | 3388.07 | 696 | 671 | 194.4 |
| D | 8 | 176 | 299003 | 1534.98 | 696 | 671 | 194.4 |
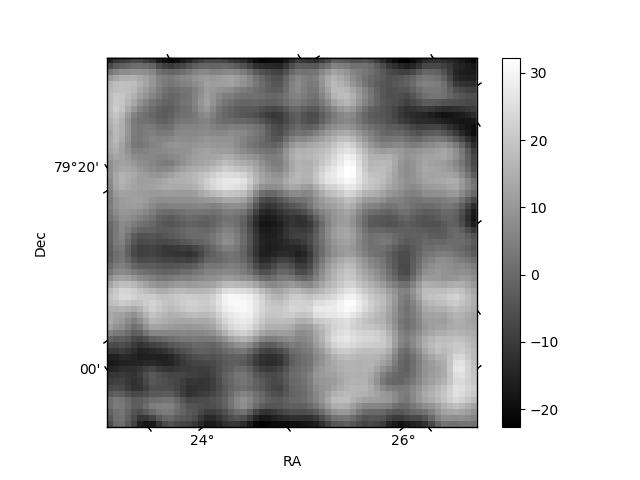
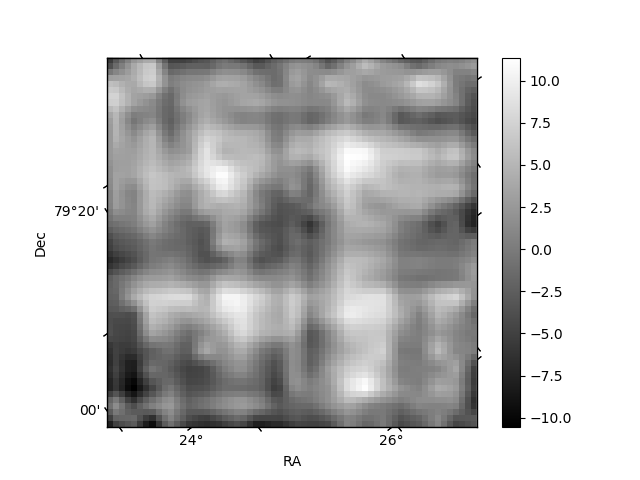
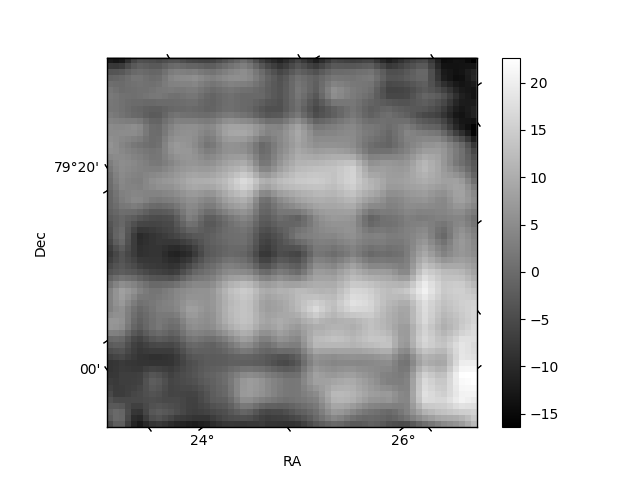
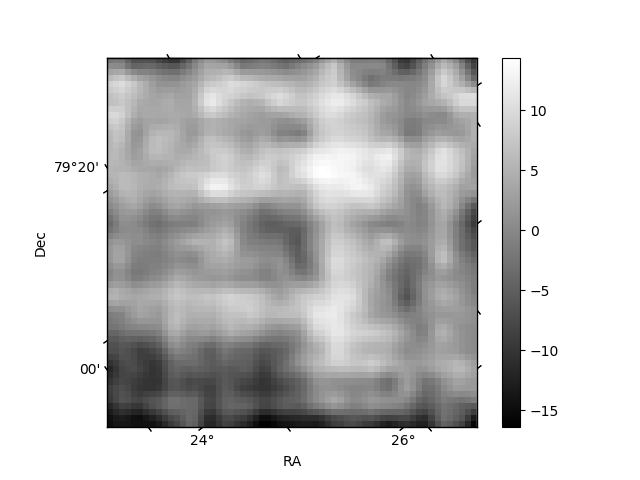
Histogram calculated using DETX and DETY for each event in the final _common_clean file
| Quadrant A | 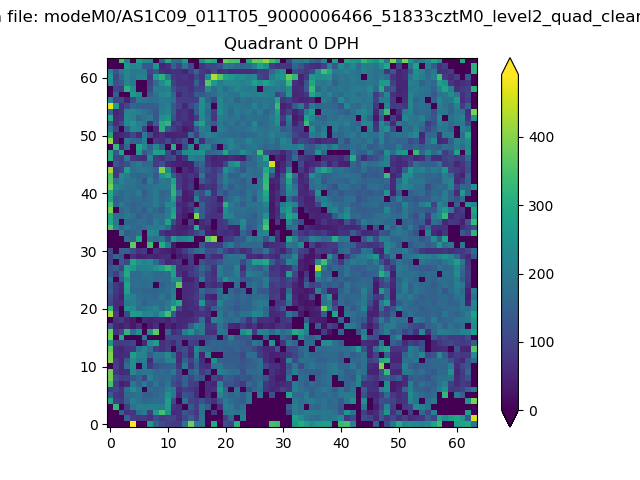 |
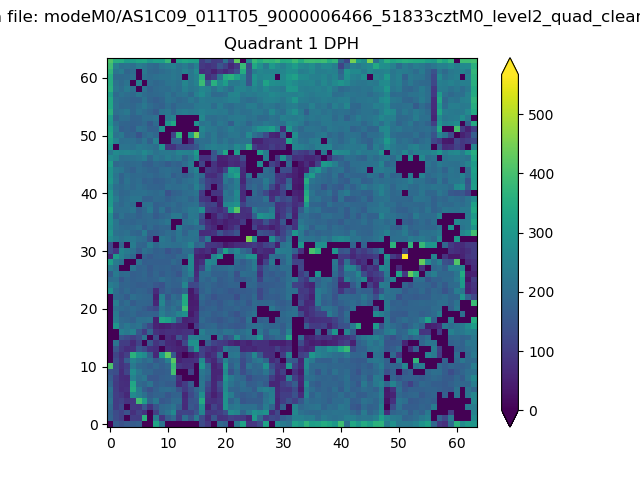 |
Quadrant B |
|---|---|---|---|
| Quadrant D | 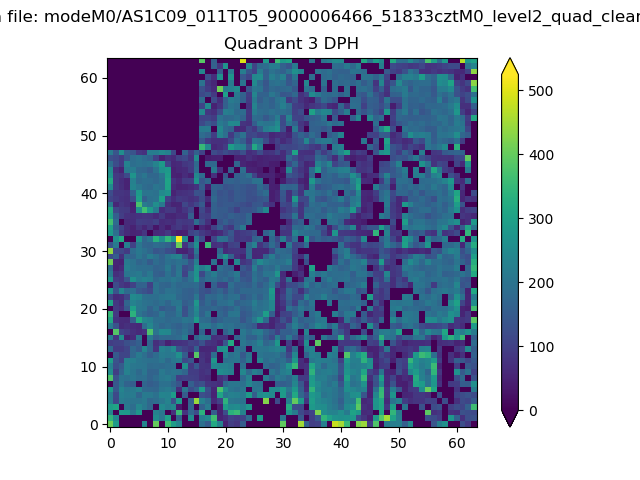 |
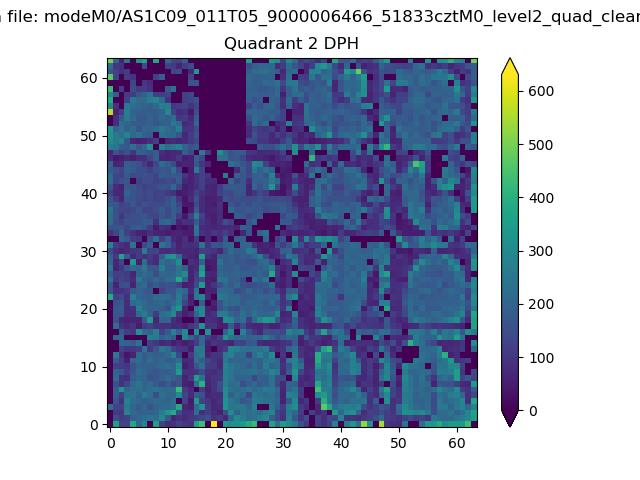 |
Quadrant C |
| Plot type | Count rate plots | Images |
|---|---|---|
| Comparison with Poisson distribution Blue bars denote a histogram of data divided into 1 sec bins. Red curve is a Poisson curve with rate = median count rate of data. |
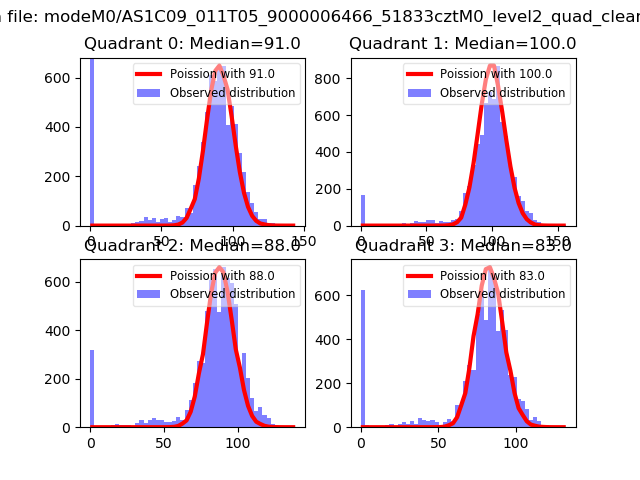 |
 |
| Quadrant-wise count rates Data is divided into 100 sec bins |
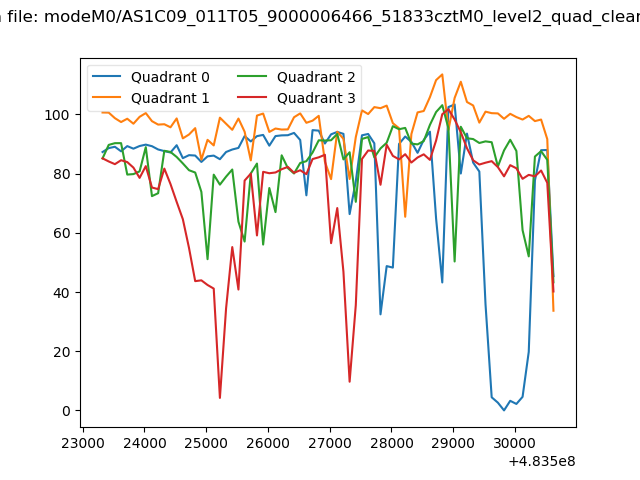 |
|
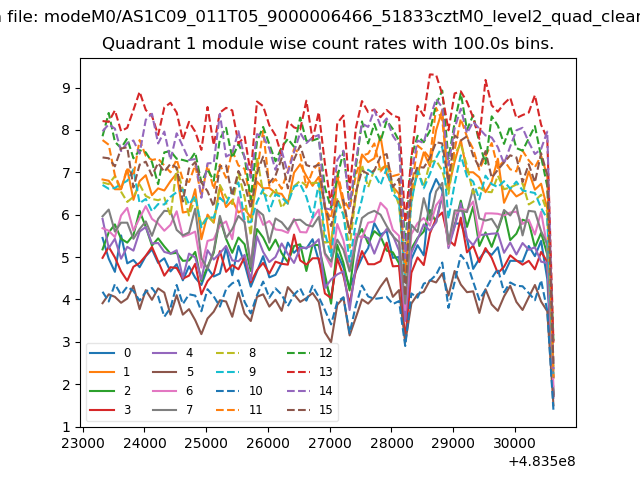
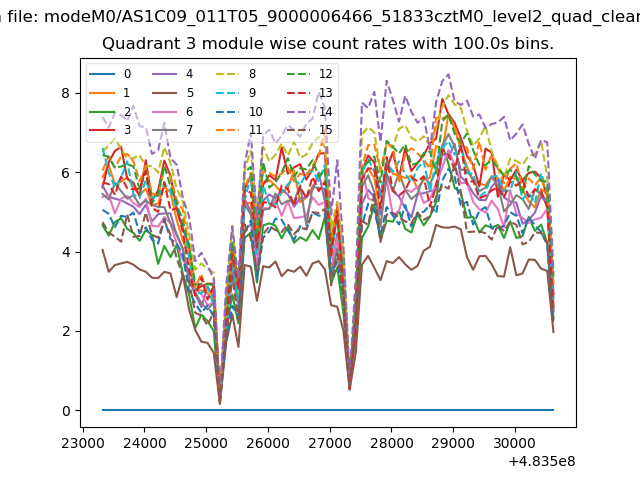
| Module-wise count rates for Quadrant A Data is divided into 100 sec bins |
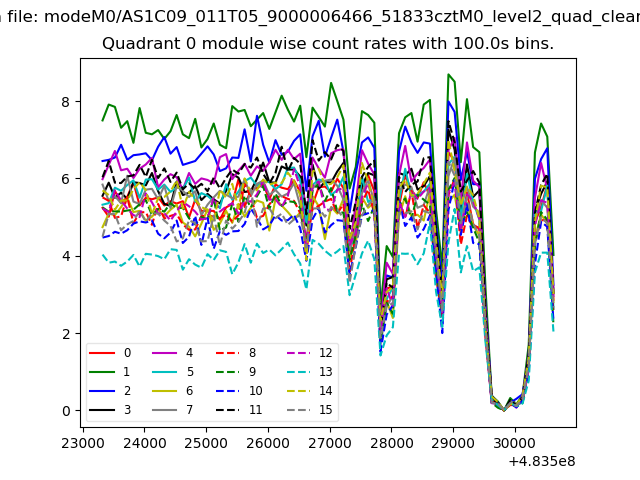 |
 |
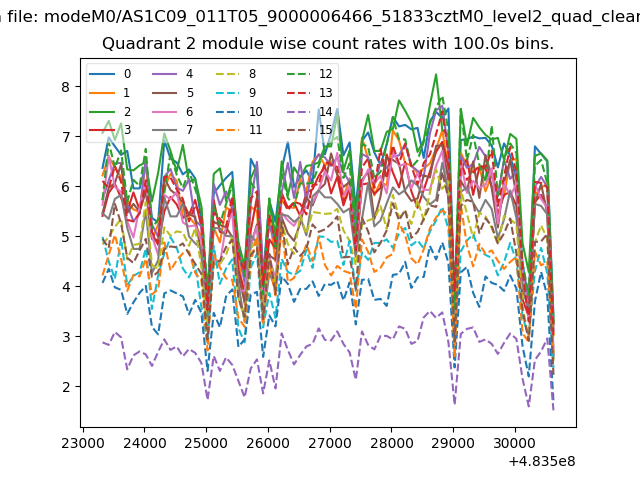
| Module-wise count rates for Quadrant B Data is divided into 100 sec bins |
 |
 |
| Module-wise count rates for Quadrant C Data is divided into 100 sec bins |
 |
 |
| Module-wise count rates for Quadrant D Data is divided into 100 sec bins |
 |
 |
| Parameter | Plot |
|---|---|
| CZT HV Monitor | 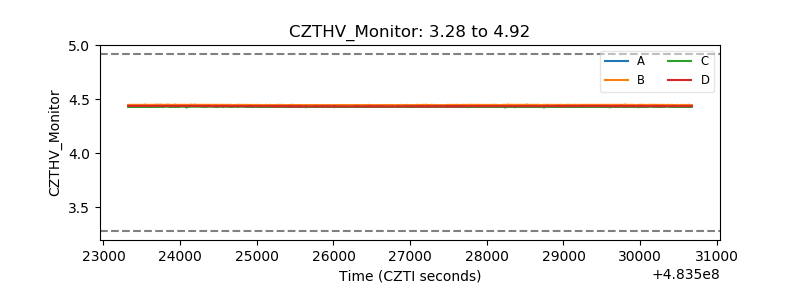 |
| D_VDD | 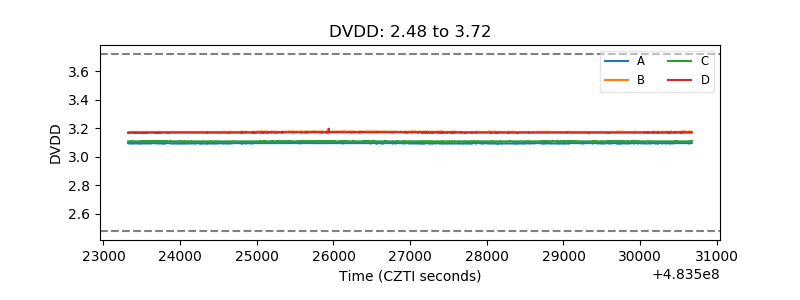 |
| Temperature 1 | 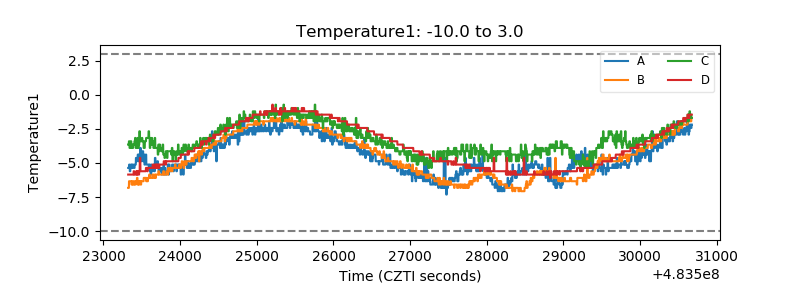 |
| Veto HV Monitor | 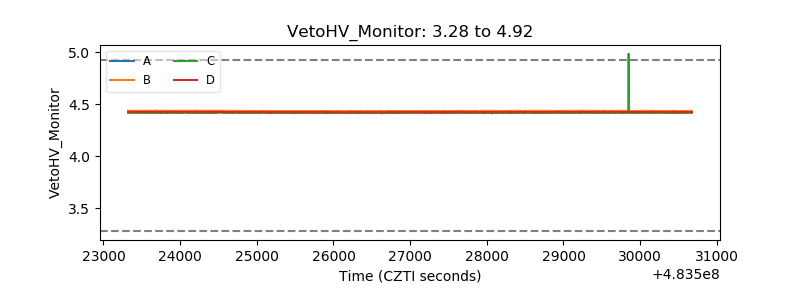 |
| Veto LLD | 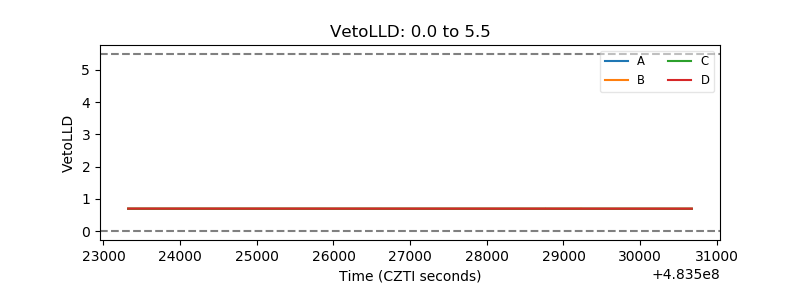 |
| Alpha Counter | 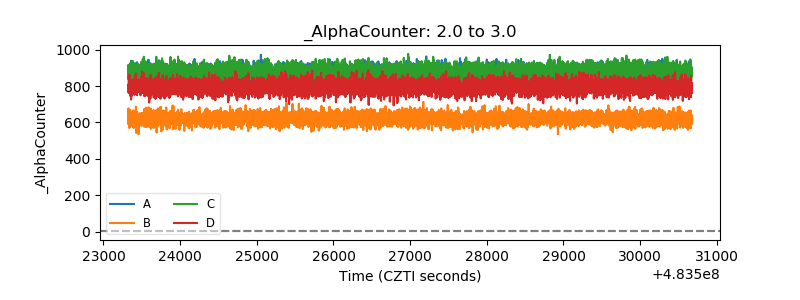 |
| _CPM_Rate | 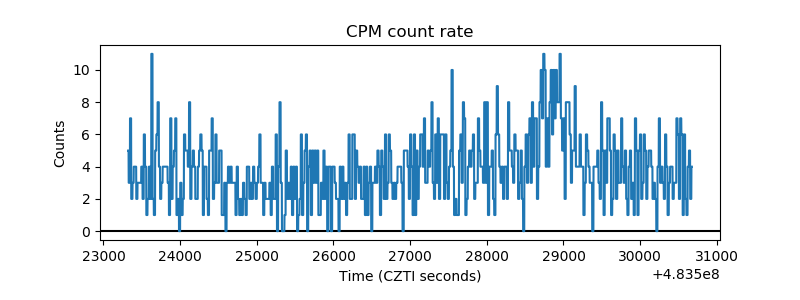 |
| CZT Counter | 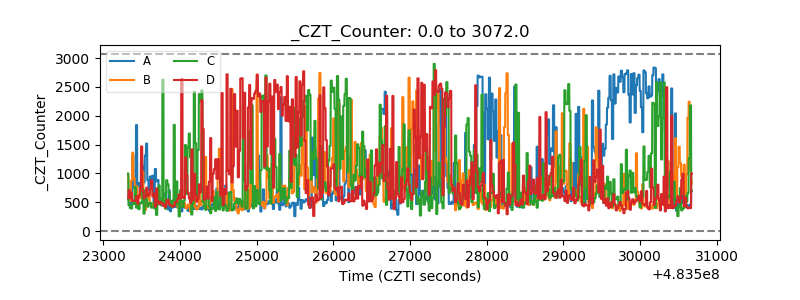 |
| +2.5 Volts monitor | 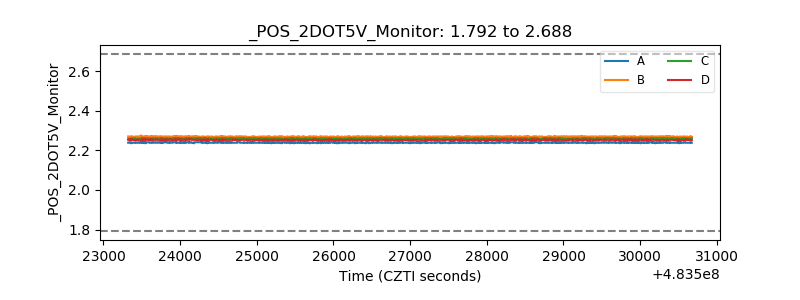 |
| +5 Volts monitor |  |
| _ROLL_ROT | 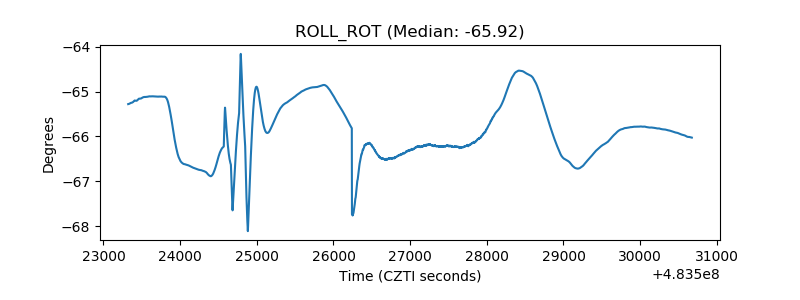 |
| _Roll_DEC | 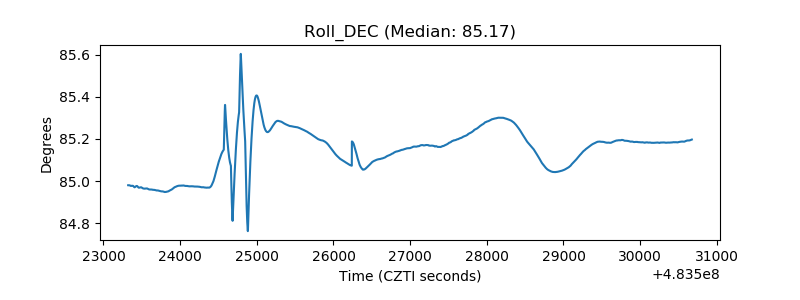 |
| _Roll_RA | 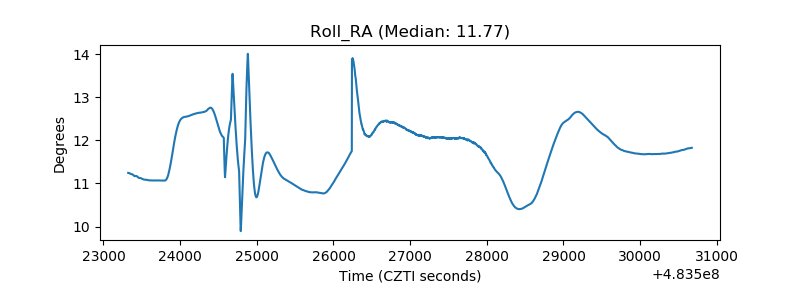 |
| Veto Counter | 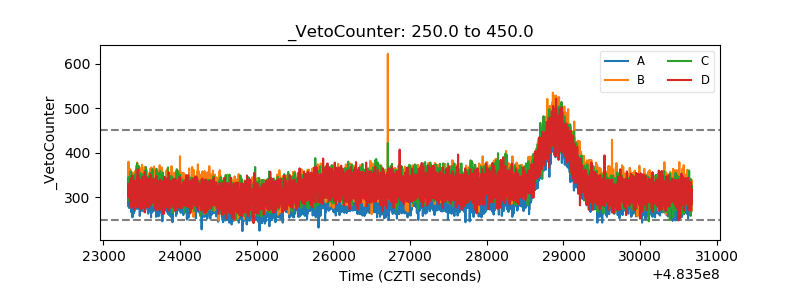 |