| Param | Original file | Final file |
|---|---|---|
| Filename | modeM0/AS1C09_011T05_9000006466_51835cztM0_level2.fits | modeM0/AS1C09_011T05_9000006466_51835cztM0_level2_quad_clean.evt |
| Size (bytes) | 851,178,240 | 95,981,760 |
| Size | 811.7 MB | 91.5 MB |
| Events in quadrant A | 6,650,468 | 649,888 |
| Events in quadrant B | 6,540,553 | 706,514 |
| Events in quadrant C | 7,142,953 | 594,296 |
| Events in quadrant D | 10,601,930 | 439,591 |
| Mode SS | |||
|---|---|---|---|
| Quadrant | BADHDUFLAG | Total packets | Discarded packets |
| A | 0 | 148 | 0 |
| B | 0 | 148 | 0 |
| C | 0 | 148 | 0 |
| D | 0 | 148 | 0 |
| Mode M0 | |||
|---|---|---|---|
| Quadrant | BADHDUFLAG | Total packets | Discarded packets |
| A | 0 | 24821 | 0 |
| B | 0 | 24565 | 2 |
| C | 0 | 26319 | 0 |
| D | 0 | 36634 | 0 |
| Quadrant | Total seconds | Saturated seconds | Saturation percentage |
|---|---|---|---|
| A | 7406 | 551 | 7.439914% |
| B | 7406 | 555 | 7.493924% |
| C | 7406 | 885 | 11.949770% |
| D | 7406 | 2441 | 32.959762% |
Noise dominated data is calculated using 1-second bins in cleaned event files. If a bin has >2000 counts, and if more than 50% of those come from <1% of pixels, then it is considered to be noise-dominated and hence unusable.
| Quadrant | # 1 sec bins | Bins with >0 counts | Bins with >2000 counts | High rate bins dominated by noise | Noise dominated (total time) | Noise dominated (detector-on time) | Marked lightcurve |
|---|---|---|---|---|---|---|---|
| A | 7406 | 7406 | 489 | 489 | 6.60% | 6.60% | 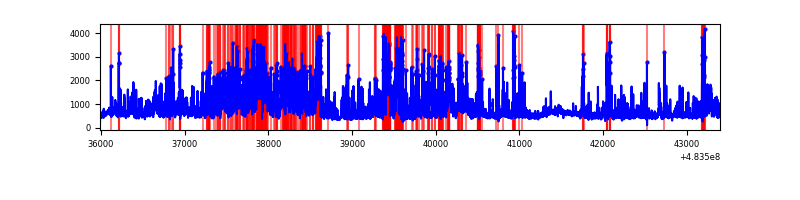 |
| B | 7406 | 7406 | 390 | 390 | 5.27% | 5.27% | 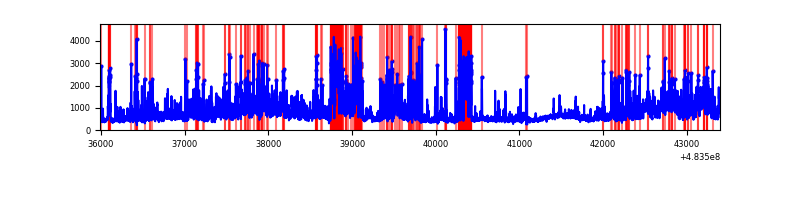 |
| C | 7406 | 7406 | 770 | 770 | 10.40% | 10.40% | 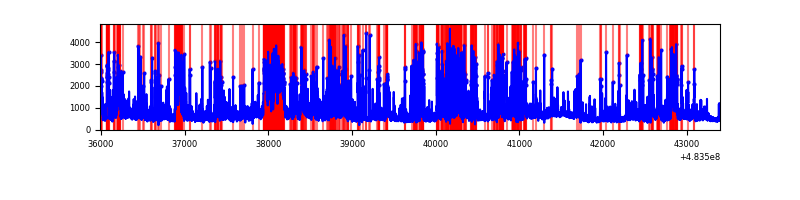 |
| D | 7406 | 7406 | 2118 | 2118 | 28.60% | 28.60% | 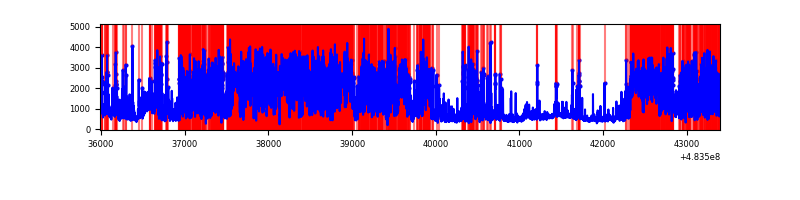 |
Top three noisy pixels from each quadrant. If the there are fewer than three noisy pixels in the level2.evt file, extra rows are filled as -1
| Pixel properties | Quadrant properties | ||||||
|---|---|---|---|---|---|---|---|
| Quadrant | DetID | PixID | Counts | Sigma | Mean | Median | Sigma |
| A | 11 | 3 | 878410 | 4577.45 | 764 | 744 | 191.7 |
| A | 12 | 3 | 755578 | 3936.82 | 764 | 744 | 191.7 |
| A | 13 | 248 | 594020 | 3094.22 | 764 | 744 | 191.7 |
| B | 10 | 128 | 845180 | 5253.13 | 753 | 726 | 160.8 |
| B | 5 | 32 | 654908 | 4069.49 | 753 | 726 | 160.8 |
| B | 5 | 185 | 612100 | 3803.2 | 753 | 726 | 160.8 |
| C | 0 | 193 | 1118759 | 5585.37 | 724 | 715 | 200.2 |
| C | 0 | 176 | 987574 | 4930.02 | 724 | 715 | 200.2 |
| C | 15 | 157 | 276639 | 1378.42 | 724 | 715 | 200.2 |
| D | 11 | 129 | 3331791 | 18610.62 | 638 | 615 | 179.0 |
| D | 8 | 176 | 1426519 | 7966.24 | 638 | 615 | 179.0 |
| D | 7 | 60 | 1021355 | 5702.67 | 638 | 615 | 179.0 |
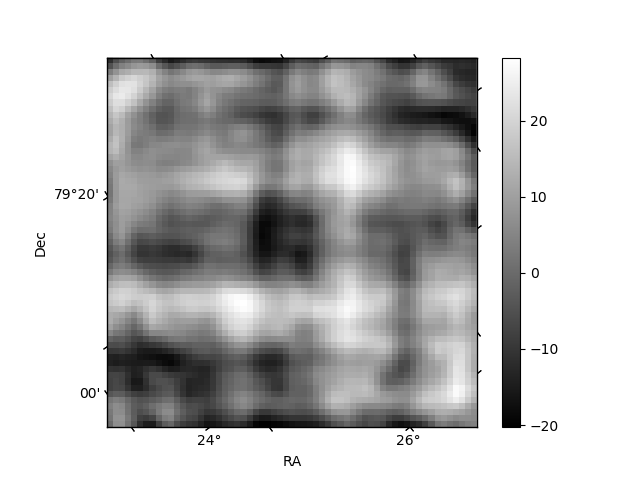
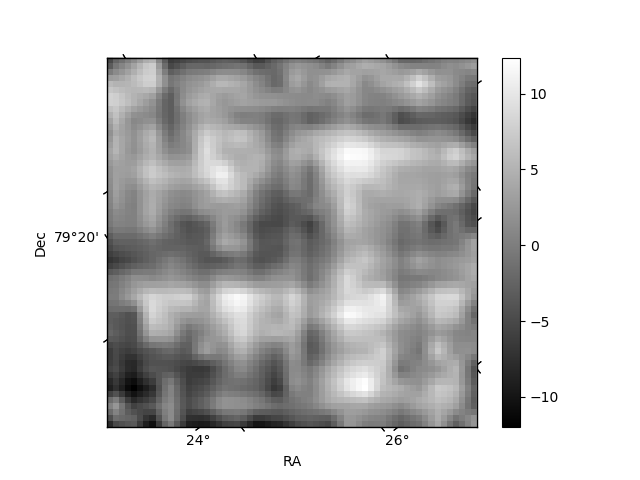
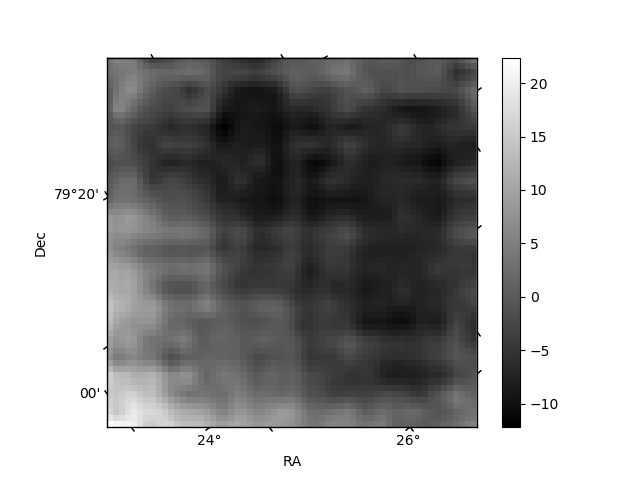
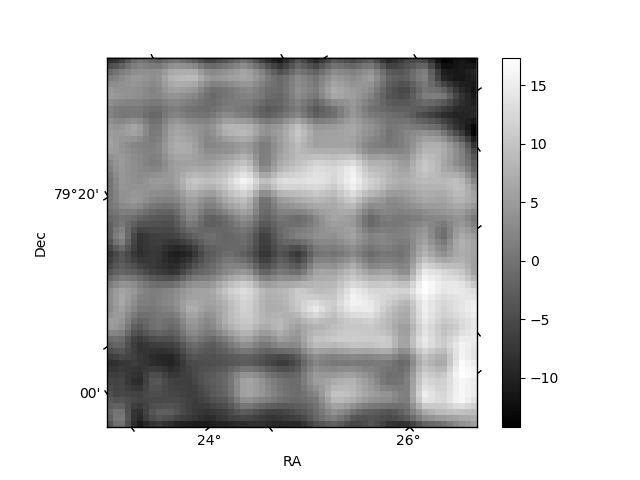
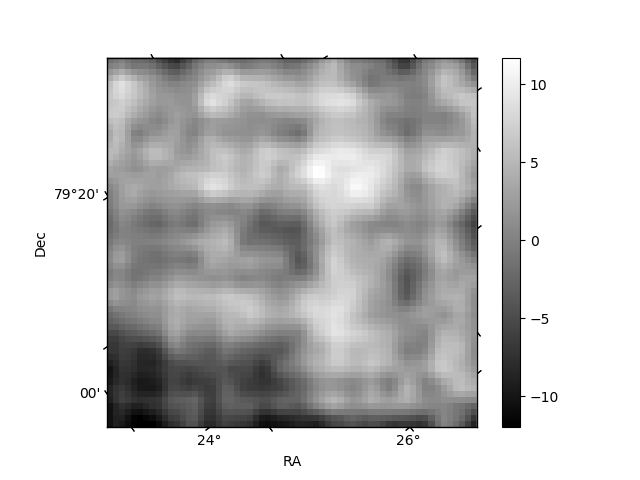
Histogram calculated using DETX and DETY for each event in the final _common_clean file
| Quadrant A | 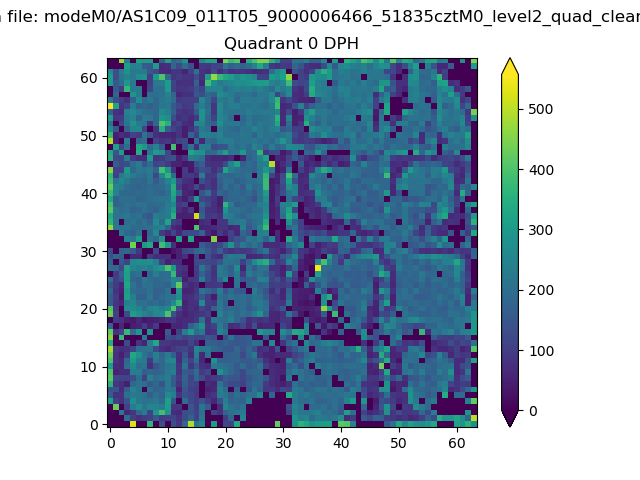 |
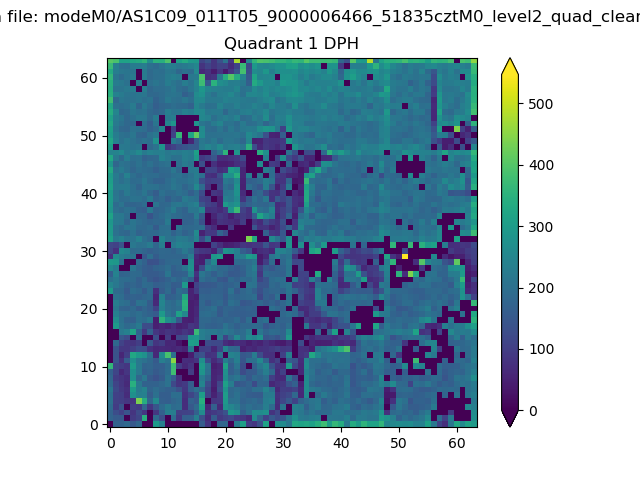 |
Quadrant B |
|---|---|---|---|
| Quadrant D | 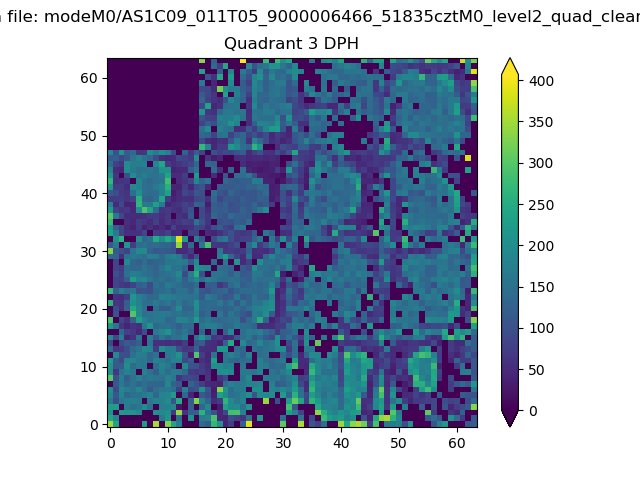 |
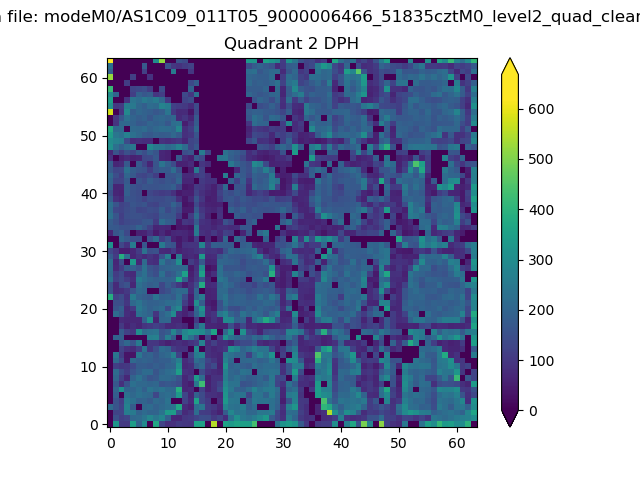 |
Quadrant C |
| Plot type | Count rate plots | Images |
|---|---|---|
| Comparison with Poisson distribution Blue bars denote a histogram of data divided into 1 sec bins. Red curve is a Poisson curve with rate = median count rate of data. |
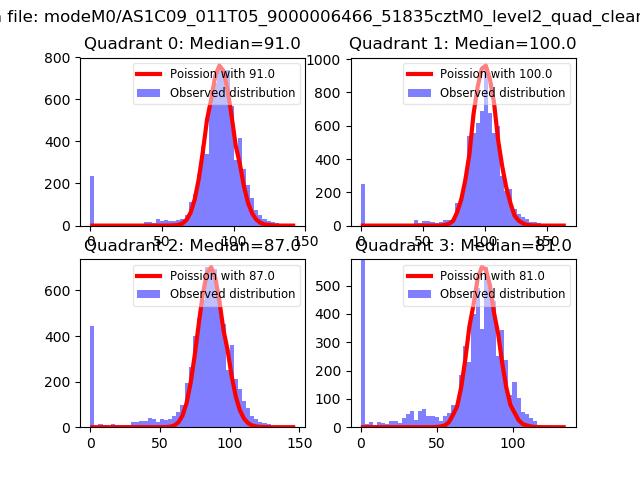 |
 |
| Quadrant-wise count rates Data is divided into 100 sec bins |
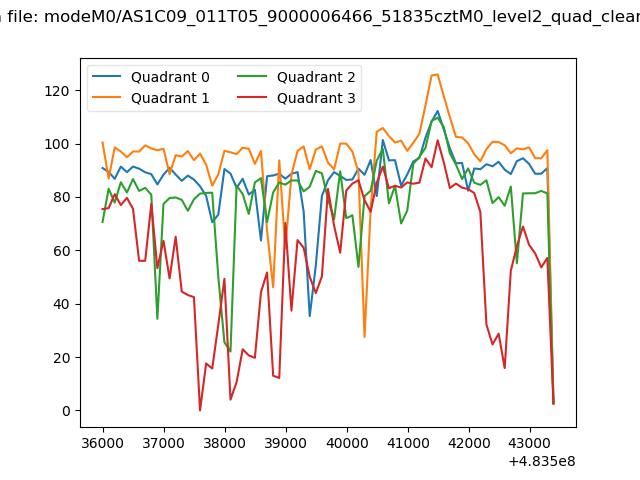 |
|
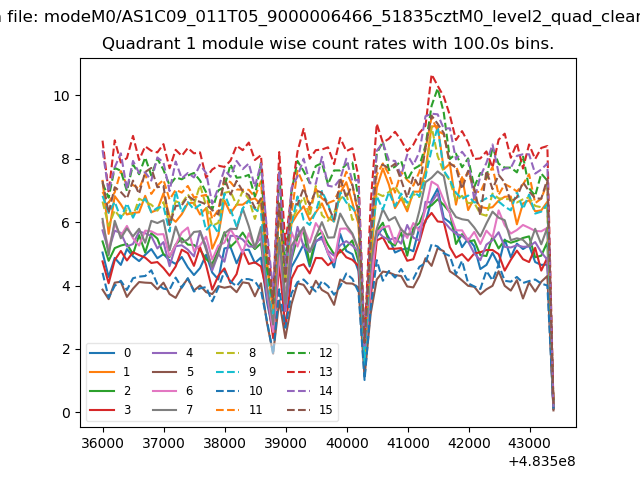
| Module-wise count rates for Quadrant A Data is divided into 100 sec bins |
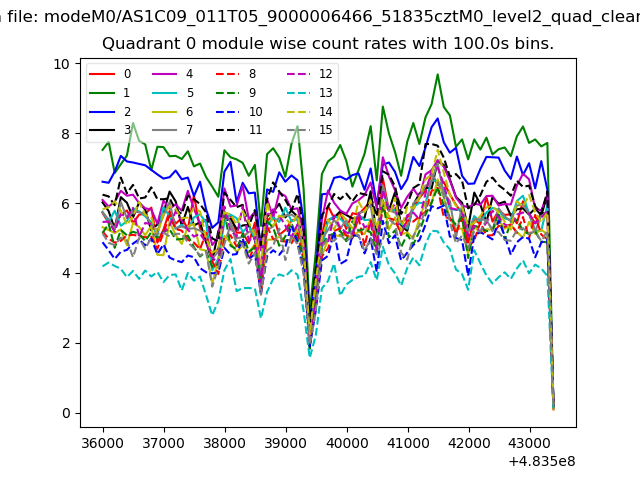 |
 |
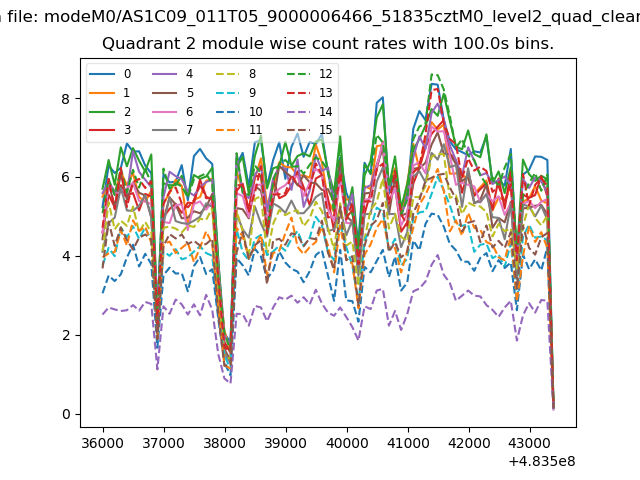
| Module-wise count rates for Quadrant B Data is divided into 100 sec bins |
 |
 |
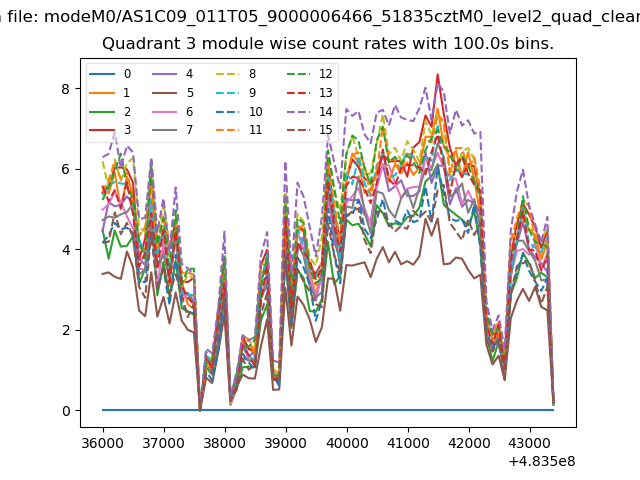
| Module-wise count rates for Quadrant C Data is divided into 100 sec bins |
 |
 |
| Module-wise count rates for Quadrant D Data is divided into 100 sec bins |
 |
 |
| Parameter | Plot |
|---|---|
| CZT HV Monitor | 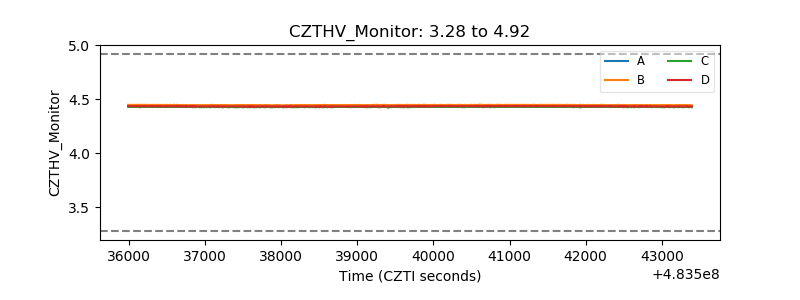 |
| D_VDD | 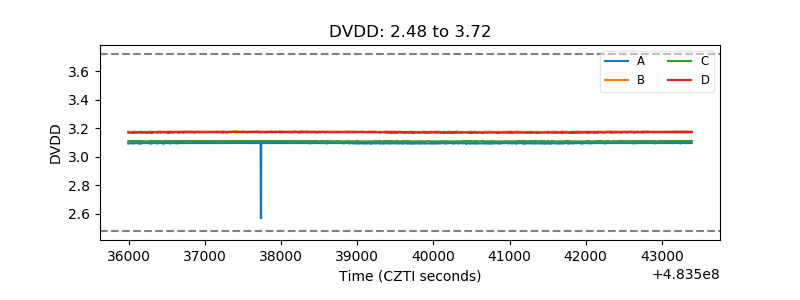 |
| Temperature 1 | 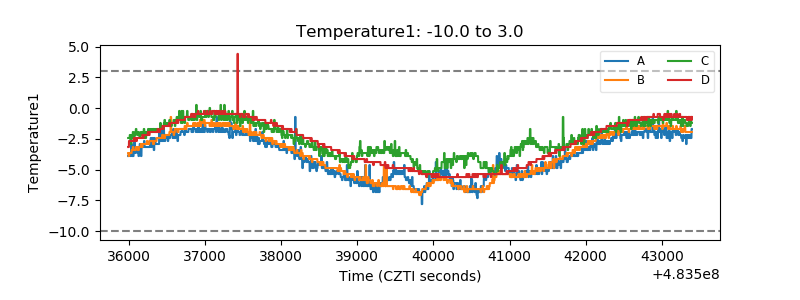 |
| Veto HV Monitor |  |
| Veto LLD | 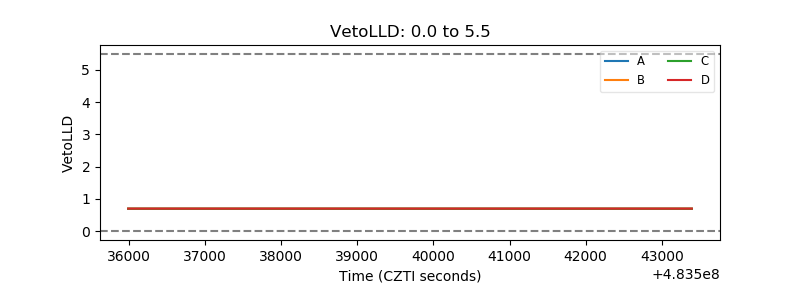 |
| Alpha Counter | 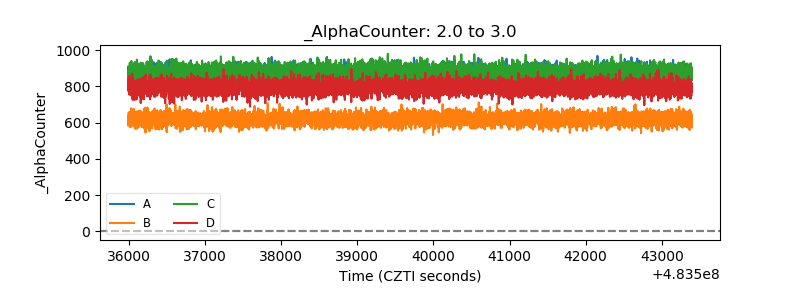 |
| _CPM_Rate | 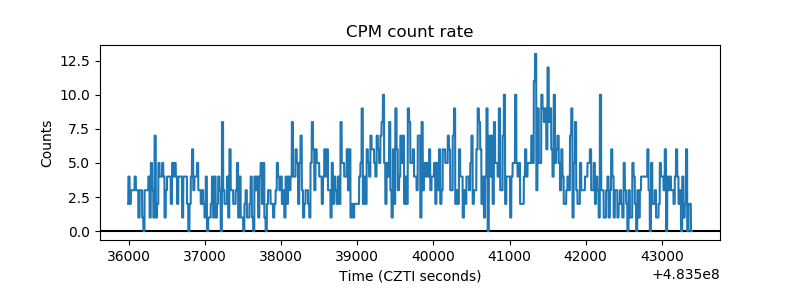 |
| CZT Counter | 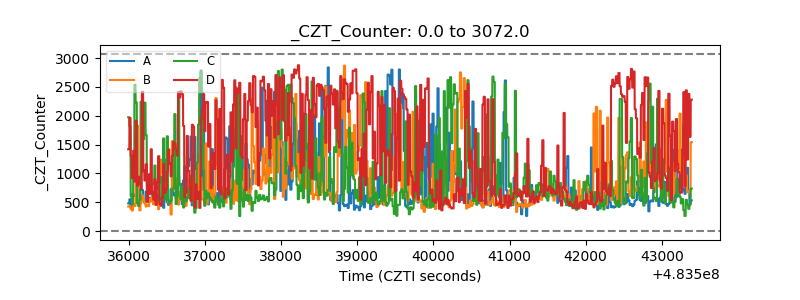 |
| +2.5 Volts monitor | 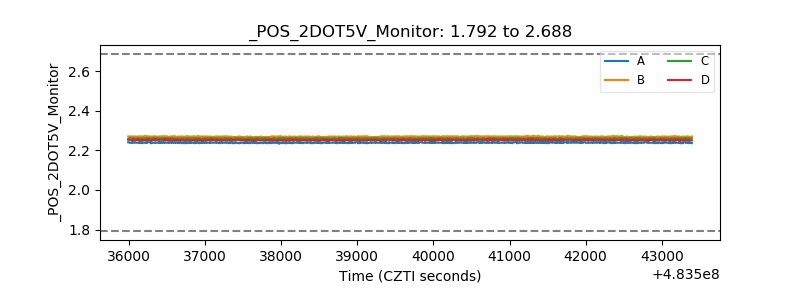 |
| +5 Volts monitor |  |
| _ROLL_ROT | 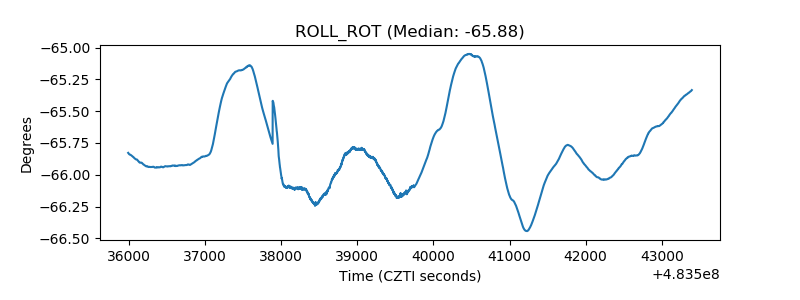 |
| _Roll_DEC | 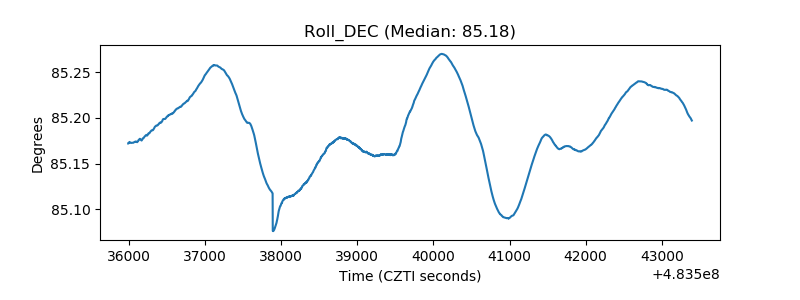 |
| _Roll_RA | 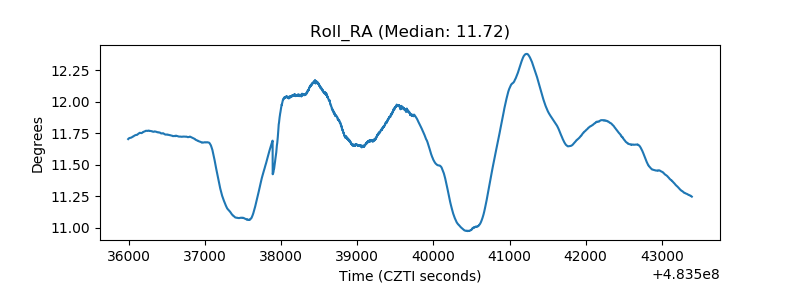 |
| Veto Counter | 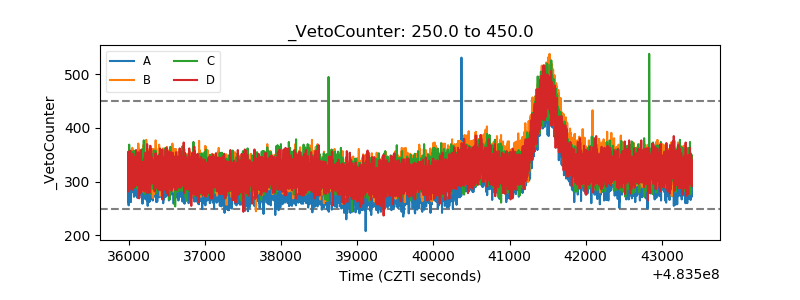 |