| Param | Original file | Final file |
|---|---|---|
| Filename | modeM0/AS1C09_011T05_9000006466_51838cztM0_level2.fits | modeM0/AS1C09_011T05_9000006466_51838cztM0_level2_quad_clean.evt |
| Size (bytes) | 1,840,806,720 | 228,864,960 |
| Size | 1.7 GB | 218.3 MB |
| Events in quadrant A | 12,601,699 | 1,566,239 |
| Events in quadrant B | 14,051,861 | 1,675,753 |
| Events in quadrant C | 16,059,125 | 1,380,163 |
| Events in quadrant D | 24,054,240 | 1,076,829 |
| Mode SS | |||
|---|---|---|---|
| Quadrant | BADHDUFLAG | Total packets | Discarded packets |
| A | 0 | 364 | 0 |
| B | 0 | 364 | 0 |
| C | 0 | 364 | 0 |
| D | 0 | 364 | 0 |
| Mode M0 | |||
|---|---|---|---|
| Quadrant | BADHDUFLAG | Total packets | Discarded packets |
| A | 0 | 49765 | 3 |
| B | 0 | 54017 | 3 |
| C | 0 | 60114 | 3 |
| D | 0 | 83795 | 4 |
| Mode M9 | |||
|---|---|---|---|
| Quadrant | BADHDUFLAG | Total packets | Discarded packets |
| A | 0 | 15 | 0 |
| B | 0 | 15 | 0 |
| C | 0 | 15 | 0 |
| D | 0 | 15 | 0 |
| Quadrant | Total seconds | Saturated seconds | Saturation percentage |
|---|---|---|---|
| A | 17826 | 839 | 4.706608% |
| B | 17827 | 1112 | 6.237729% |
| C | 17827 | 2001 | 11.224547% |
| D | 17826 | 5207 | 29.210142% |
Noise dominated data is calculated using 1-second bins in cleaned event files. If a bin has >2000 counts, and if more than 50% of those come from <1% of pixels, then it is considered to be noise-dominated and hence unusable.
| Quadrant | # 1 sec bins | Bins with >0 counts | Bins with >2000 counts | High rate bins dominated by noise | Noise dominated (total time) | Noise dominated (detector-on time) | Marked lightcurve |
|---|---|---|---|---|---|---|---|
| A | 19356 | 17829 | 554 | 554 | 2.86% | 3.11% | 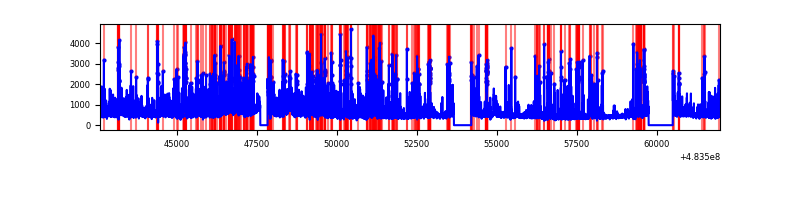 |
| B | 19357 | 17830 | 780 | 780 | 4.03% | 4.37% | 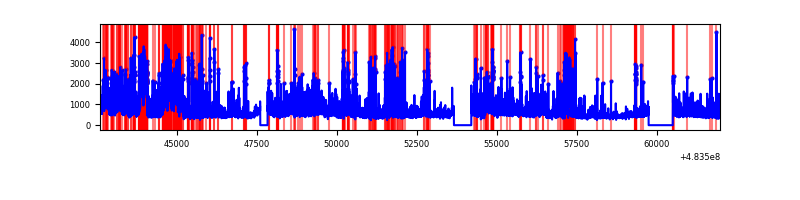 |
| C | 19357 | 17829 | 1528 | 1528 | 7.89% | 8.57% |  |
| D | 19356 | 17828 | 4432 | 4432 | 22.90% | 24.86% | 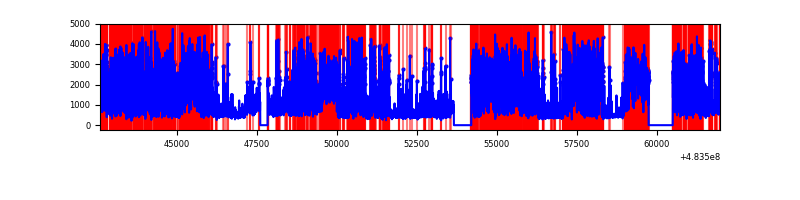 |
Top three noisy pixels from each quadrant. If the there are fewer than three noisy pixels in the level2.evt file, extra rows are filled as -1
| Pixel properties | Quadrant properties | ||||||
|---|---|---|---|---|---|---|---|
| Quadrant | DetID | PixID | Counts | Sigma | Mean | Median | Sigma |
| A | 11 | 3 | 1279124 | 2815.87 | 1840 | 1800 | 453.6 |
| A | 12 | 3 | 712990 | 1567.82 | 1840 | 1800 | 453.6 |
| A | 13 | 248 | 575462 | 1264.64 | 1840 | 1800 | 453.6 |
| B | 10 | 128 | 1543105 | 4001.44 | 1826 | 1759 | 385.2 |
| B | 5 | 32 | 1352894 | 3507.64 | 1826 | 1759 | 385.2 |
| B | 1 | 255 | 701494 | 1816.56 | 1826 | 1759 | 385.2 |
| C | 14 | 245 | 1211344 | 2496.49 | 1749 | 1738 | 484.5 |
| C | 15 | 192 | 1174801 | 2421.07 | 1749 | 1738 | 484.5 |
| C | 15 | 147 | 1141599 | 2352.55 | 1749 | 1738 | 484.5 |
| D | 11 | 129 | 6354538 | 14378.95 | 1564 | 1504 | 441.8 |
| D | 12 | 6 | 4682830 | 10595.34 | 1564 | 1504 | 441.8 |
| D | 8 | 176 | 2418834 | 5471.19 | 1564 | 1504 | 441.8 |
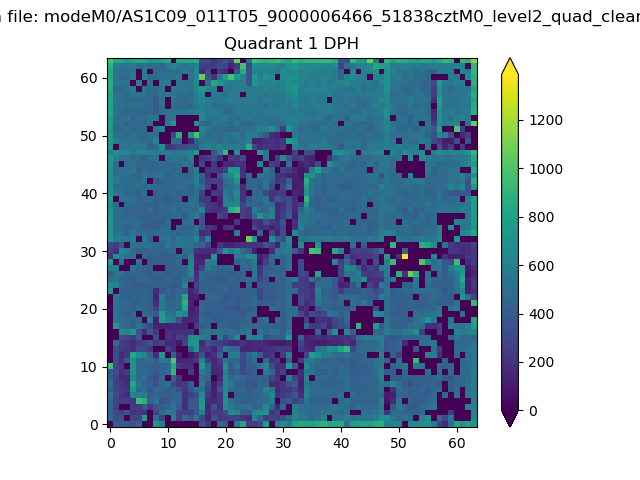
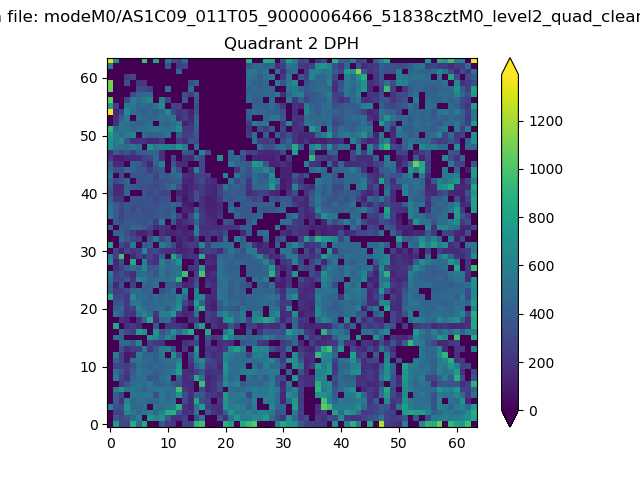
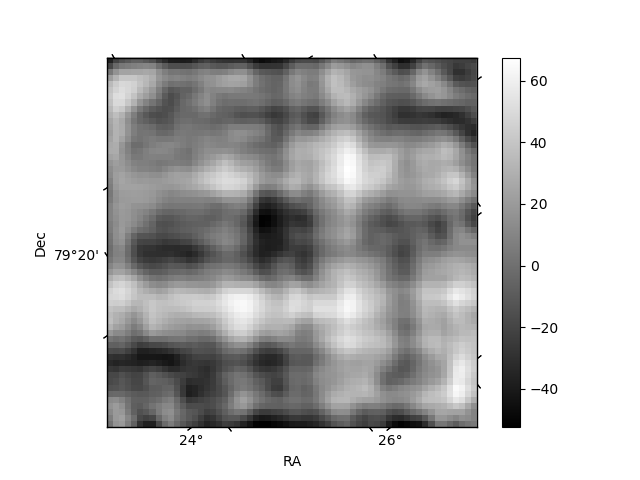
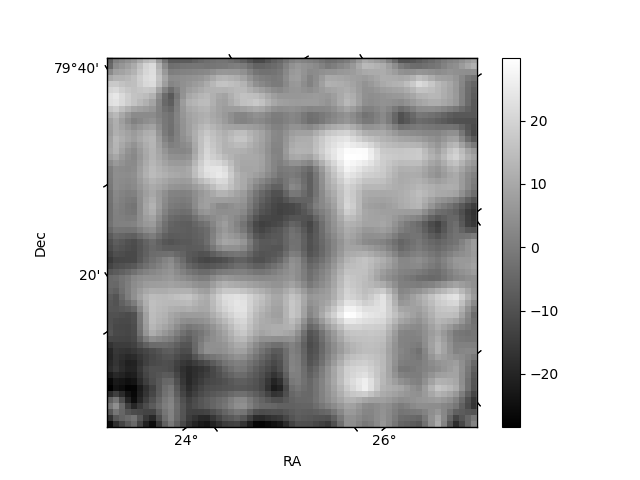
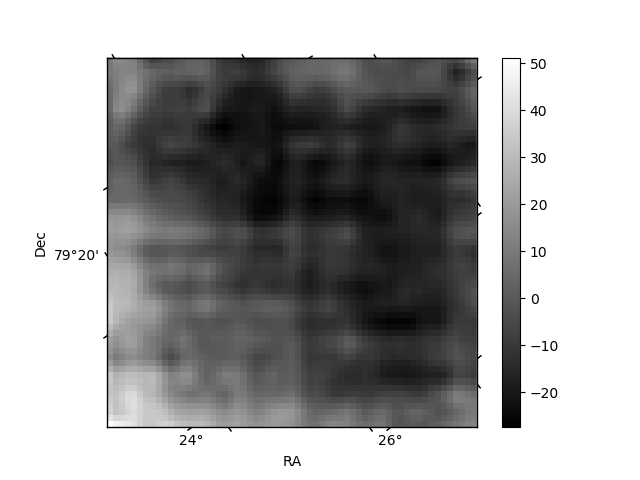
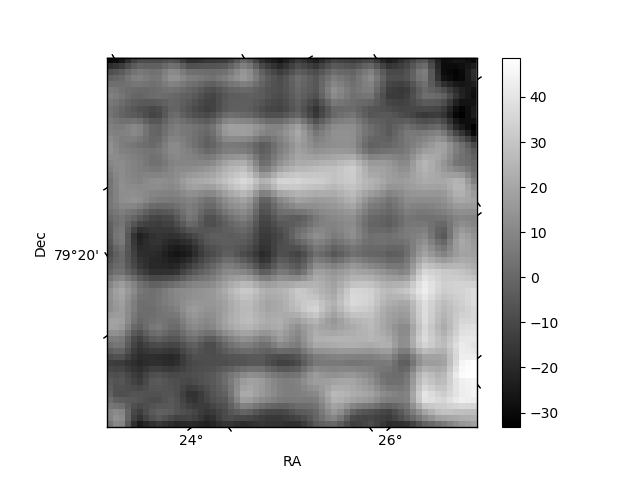
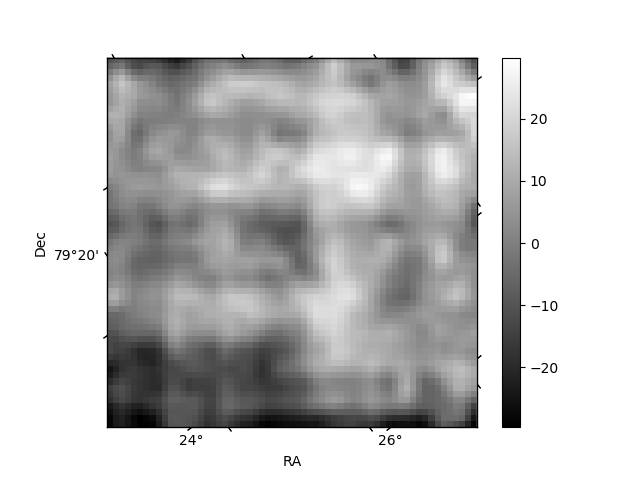
Histogram calculated using DETX and DETY for each event in the final _common_clean file
| Quadrant A | 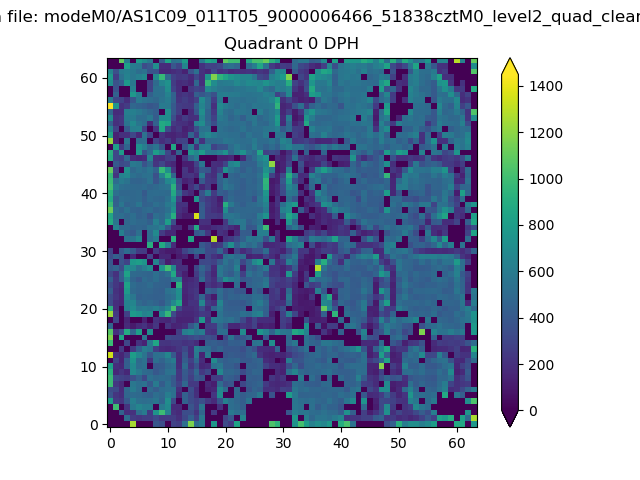 |
 |
Quadrant B |
|---|---|---|---|
| Quadrant D | 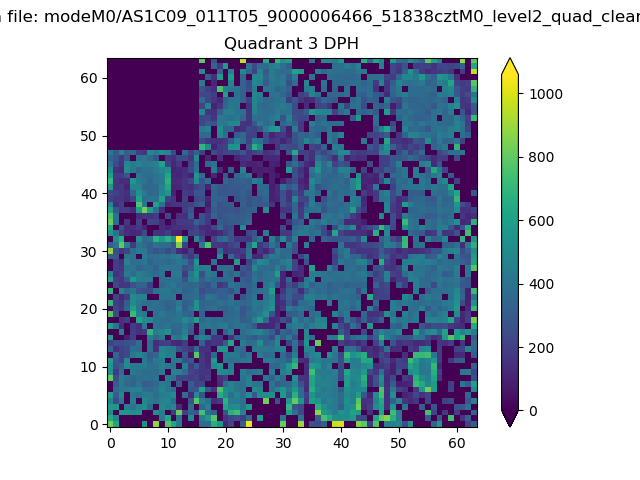 |
 |
Quadrant C |
| Plot type | Count rate plots | Images |
|---|---|---|
| Comparison with Poisson distribution Blue bars denote a histogram of data divided into 1 sec bins. Red curve is a Poisson curve with rate = median count rate of data. |
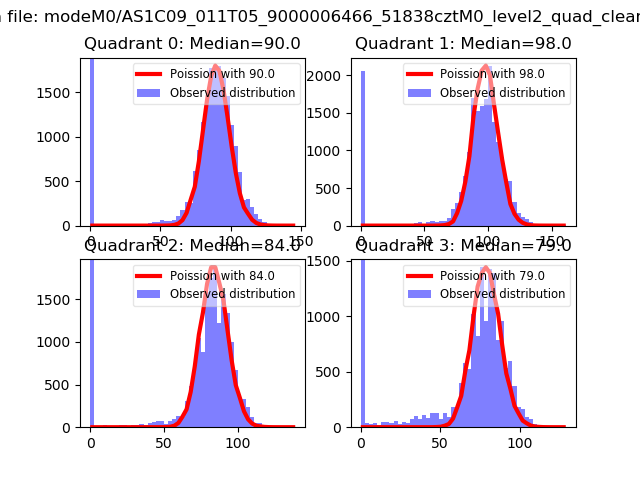 |
 |
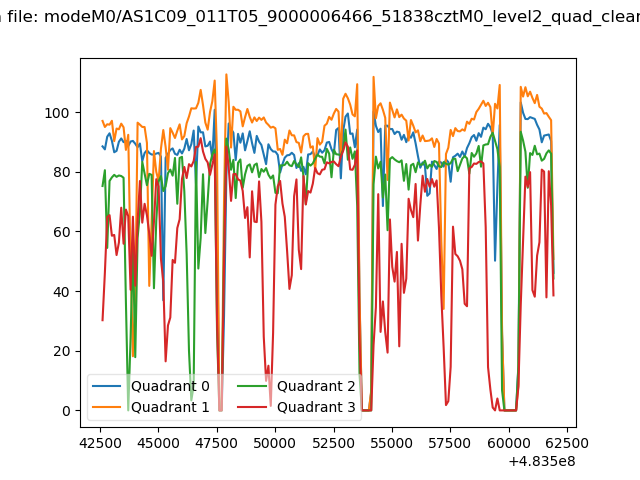
| Quadrant-wise count rates Data is divided into 100 sec bins |
 |
|
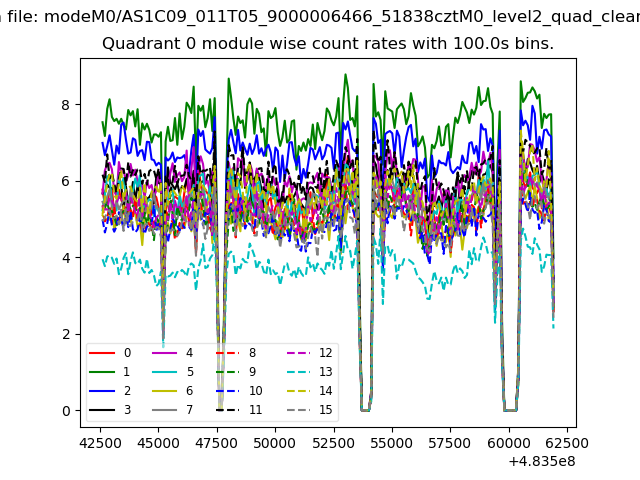
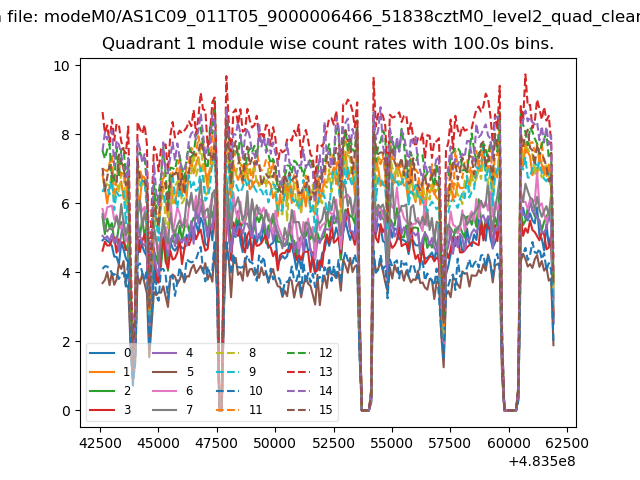
| Module-wise count rates for Quadrant A Data is divided into 100 sec bins |
 |
 |
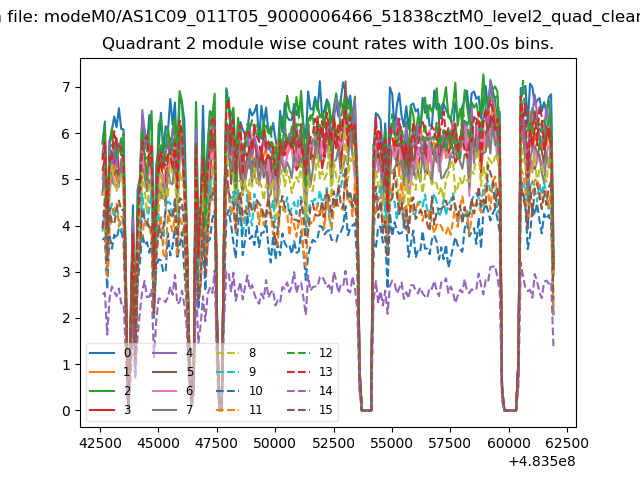
| Module-wise count rates for Quadrant B Data is divided into 100 sec bins |
 |
 |
| Module-wise count rates for Quadrant C Data is divided into 100 sec bins |
 |
 |
| Module-wise count rates for Quadrant D Data is divided into 100 sec bins |
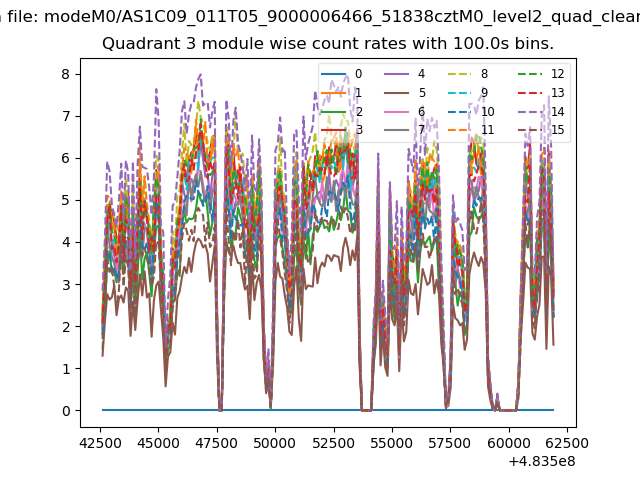 |
 |
| Parameter | Plot |
|---|---|
| CZT HV Monitor | 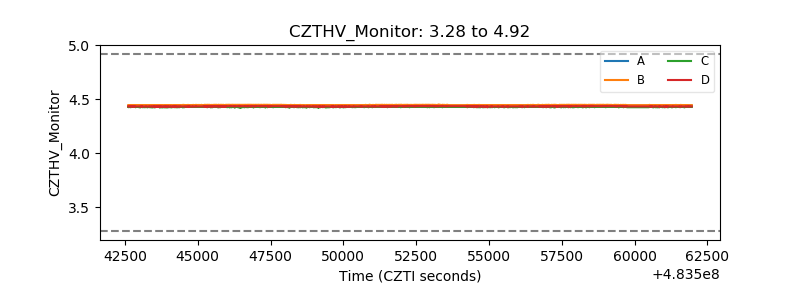 |
| D_VDD | 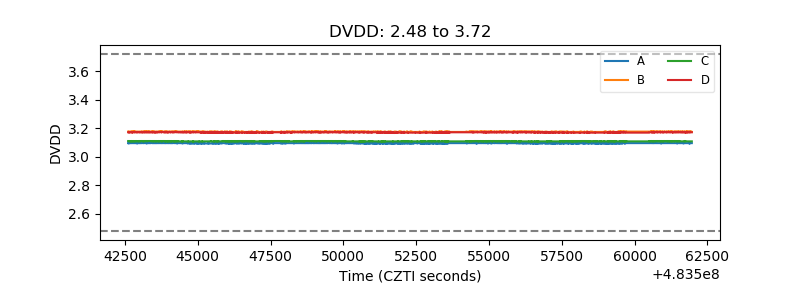 |
| Temperature 1 | 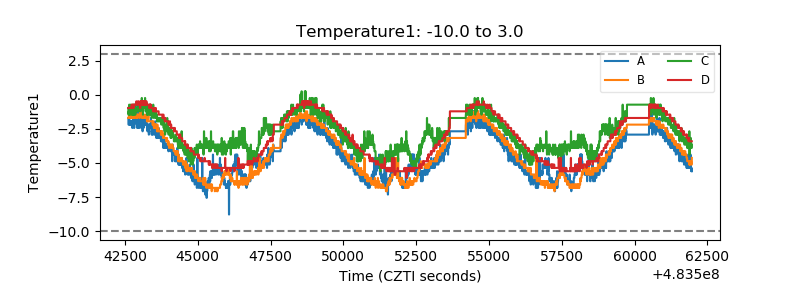 |
| Veto HV Monitor | 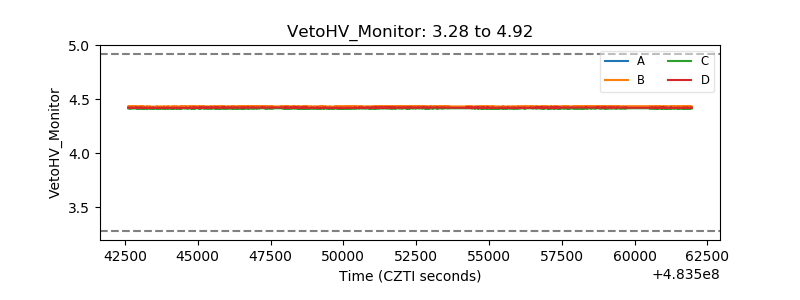 |
| Veto LLD | 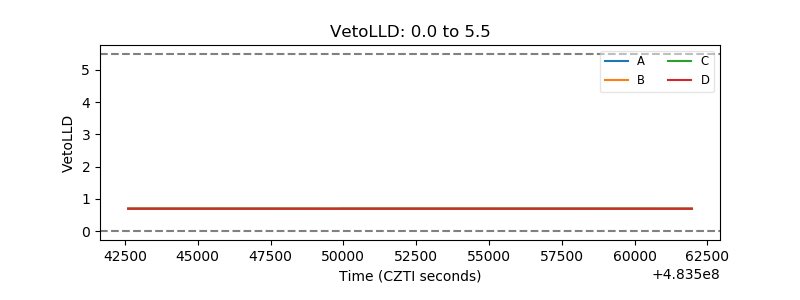 |
| Alpha Counter | 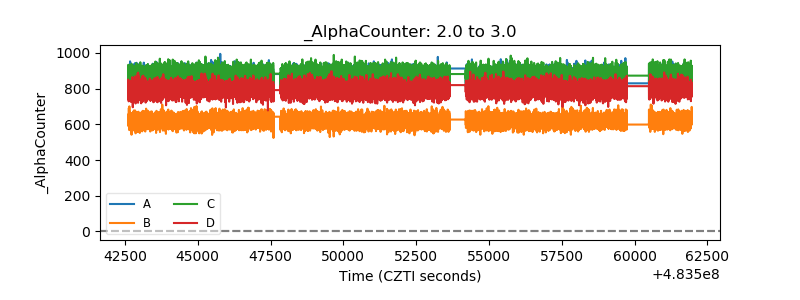 |
| _CPM_Rate | 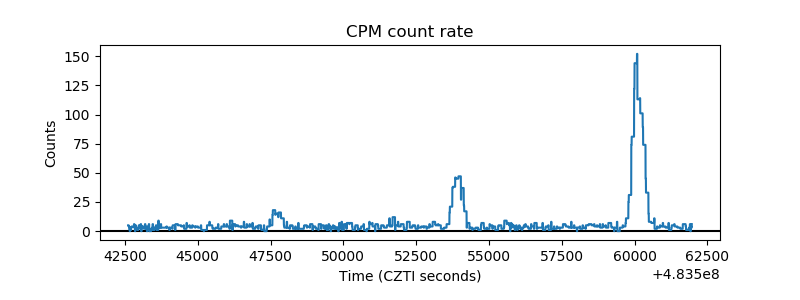 |
| CZT Counter | 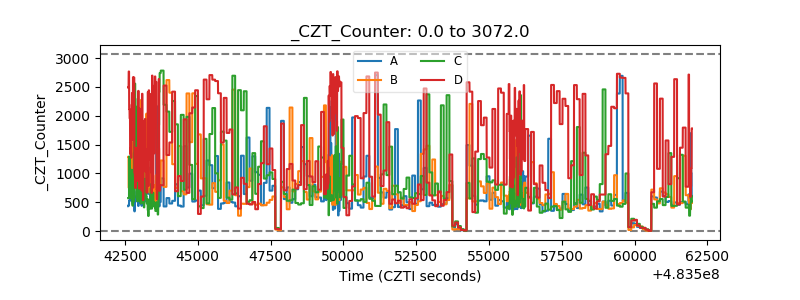 |
| +2.5 Volts monitor | 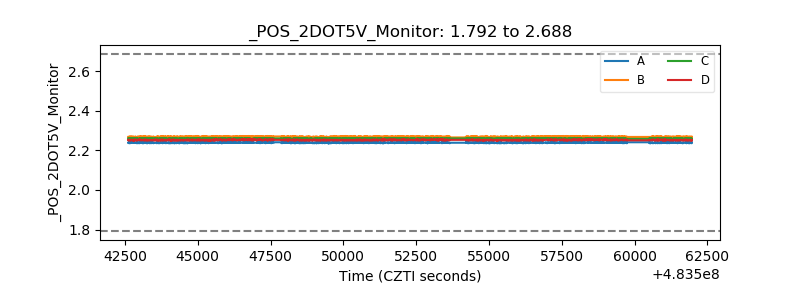 |
| +5 Volts monitor | 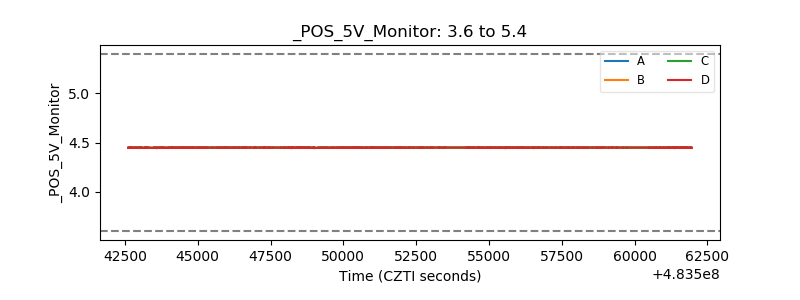 |
| _ROLL_ROT | 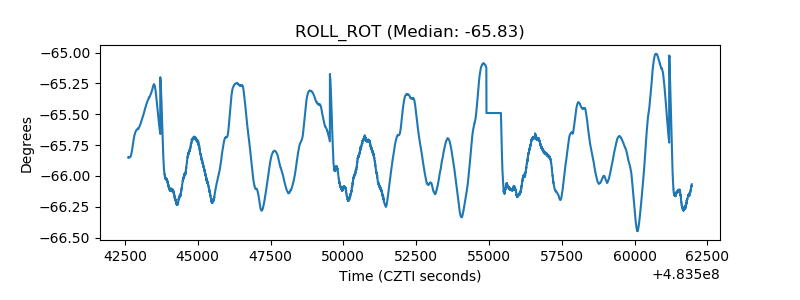 |
| _Roll_DEC | 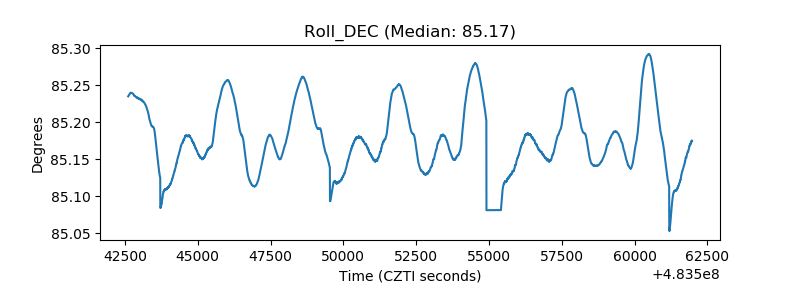 |
| _Roll_RA | 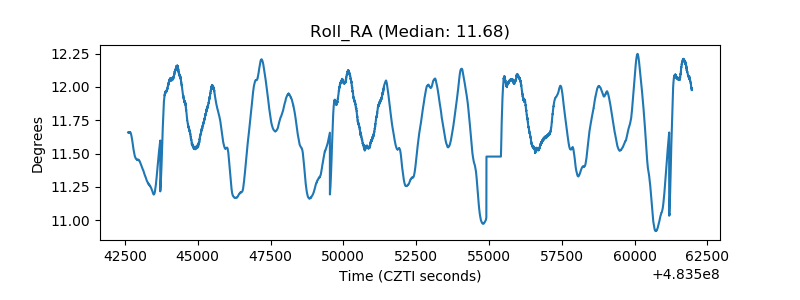 |
| Veto Counter | 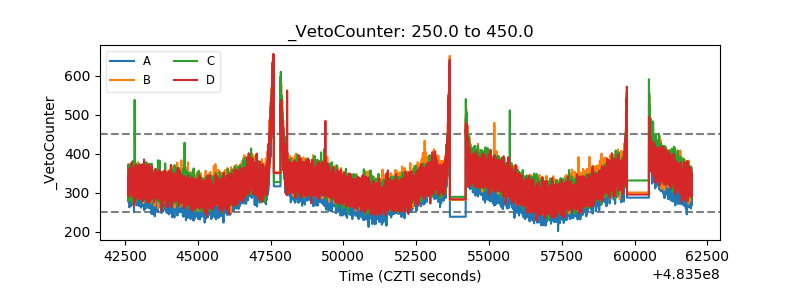 |