| Param | Original file | Final file |
|---|---|---|
| Filename | modeM0/AS1C09_011T05_9000006466_51839cztM0_level2.fits | modeM0/AS1C09_011T05_9000006466_51839cztM0_level2_quad_clean.evt |
| Size (bytes) | 602,334,720 | 89,902,080 |
| Size | 574.4 MB | 85.7 MB |
| Events in quadrant A | 3,782,719 | 619,297 |
| Events in quadrant B | 4,179,393 | 662,673 |
| Events in quadrant C | 4,345,684 | 584,666 |
| Events in quadrant D | 9,470,919 | 389,969 |
| Mode SS | |||
|---|---|---|---|
| Quadrant | BADHDUFLAG | Total packets | Discarded packets |
| A | 0 | 136 | 0 |
| B | 0 | 136 | 0 |
| C | 0 | 136 | 0 |
| D | 0 | 136 | 0 |
| Mode M0 | |||
|---|---|---|---|
| Quadrant | BADHDUFLAG | Total packets | Discarded packets |
| A | 0 | 15742 | 1 |
| B | 0 | 17196 | 1 |
| C | 0 | 17604 | 1 |
| D | 0 | 32724 | 3 |
| Mode M9 | |||
|---|---|---|---|
| Quadrant | BADHDUFLAG | Total packets | Discarded packets |
| A | 0 | 9 | 0 |
| B | 0 | 9 | 0 |
| C | 0 | 9 | 0 |
| D | 0 | 9 | 0 |
| Quadrant | Total seconds | Saturated seconds | Saturation percentage |
|---|---|---|---|
| A | 6671 | 93 | 1.394094% |
| B | 6672 | 207 | 3.102518% |
| C | 6672 | 342 | 5.125899% |
| D | 6671 | 2380 | 35.676810% |
Noise dominated data is calculated using 1-second bins in cleaned event files. If a bin has >2000 counts, and if more than 50% of those come from <1% of pixels, then it is considered to be noise-dominated and hence unusable.
| Quadrant | # 1 sec bins | Bins with >0 counts | Bins with >2000 counts | High rate bins dominated by noise | Noise dominated (total time) | Noise dominated (detector-on time) | Marked lightcurve |
|---|---|---|---|---|---|---|---|
| A | 7551 | 6672 | 44 | 44 | 0.58% | 0.66% | 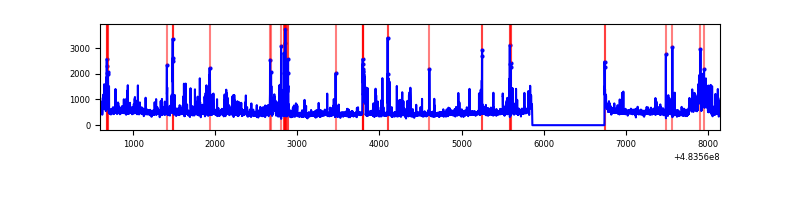 |
| B | 7552 | 6673 | 87 | 87 | 1.15% | 1.30% | 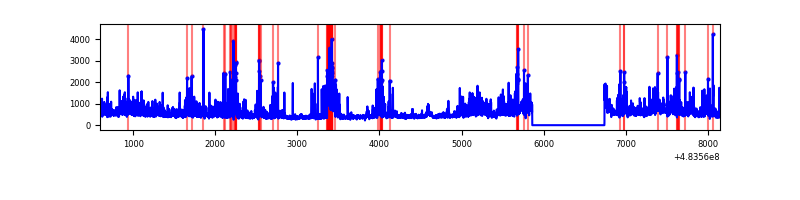 |
| C | 7552 | 6673 | 261 | 261 | 3.46% | 3.91% | 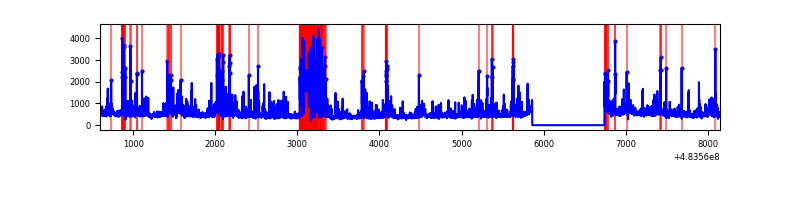 |
| D | 7551 | 6672 | 1975 | 1975 | 26.16% | 29.60% | 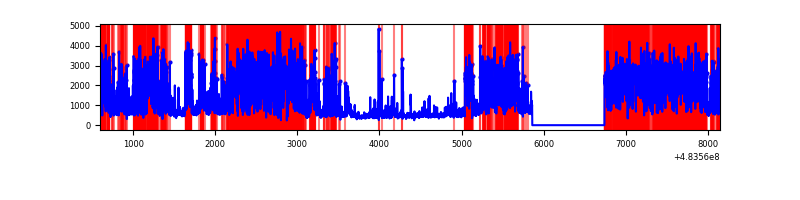 |
Top three noisy pixels from each quadrant. If the there are fewer than three noisy pixels in the level2.evt file, extra rows are filled as -1
| Pixel properties | Quadrant properties | ||||||
|---|---|---|---|---|---|---|---|
| Quadrant | DetID | PixID | Counts | Sigma | Mean | Median | Sigma |
| A | 12 | 3 | 170257 | 977.24 | 697 | 679 | 173.5 |
| A | 5 | 240 | 147353 | 845.25 | 697 | 679 | 173.5 |
| A | 11 | 3 | 131527 | 754.05 | 697 | 679 | 173.5 |
| B | 5 | 172 | 423182 | 2890.26 | 690 | 667 | 146.2 |
| B | 5 | 32 | 256288 | 1748.6 | 690 | 667 | 146.2 |
| B | 1 | 207 | 171170 | 1166.34 | 690 | 667 | 146.2 |
| C | 13 | 3 | 787071 | 4223.4 | 678 | 670 | 186.2 |
| C | 15 | 219 | 121835 | 650.72 | 678 | 670 | 186.2 |
| C | 15 | 224 | 102743 | 548.19 | 678 | 670 | 186.2 |
| D | 11 | 129 | 3436980 | 21922.28 | 558 | 539 | 156.8 |
| D | 12 | 6 | 1518970 | 9686.61 | 558 | 539 | 156.8 |
| D | 3 | 12 | 890710 | 5678.72 | 558 | 539 | 156.8 |
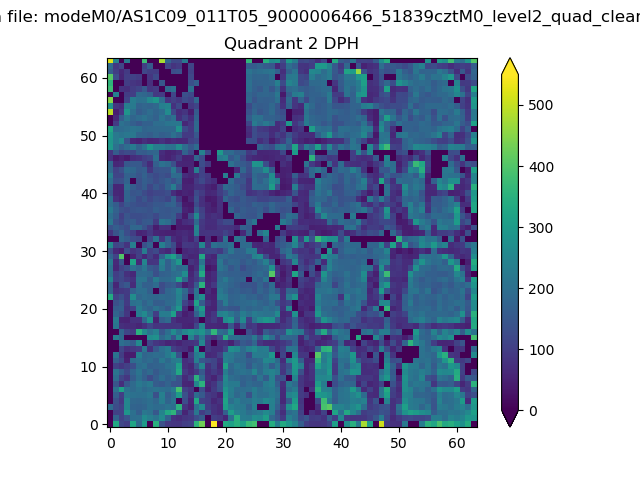
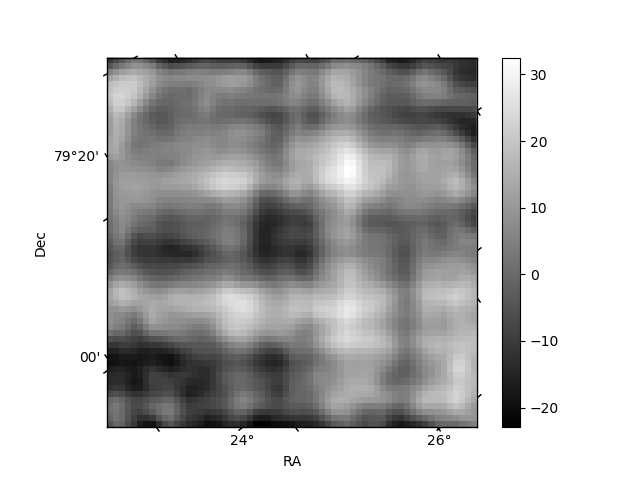
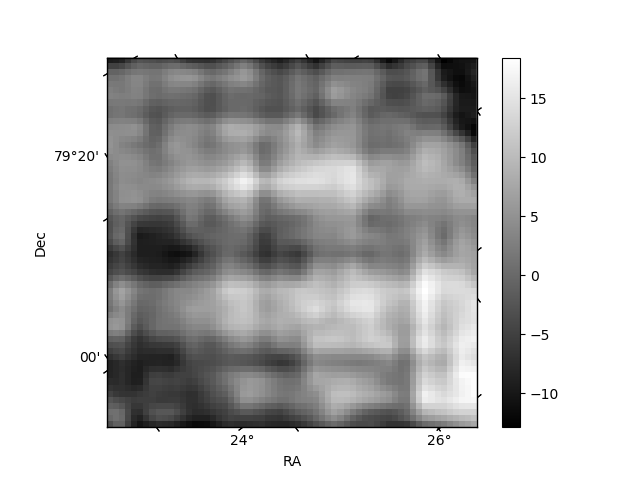
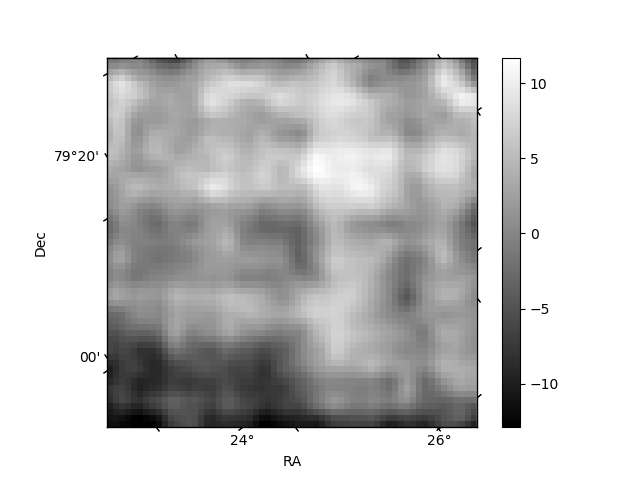
Histogram calculated using DETX and DETY for each event in the final _common_clean file
| Quadrant A | 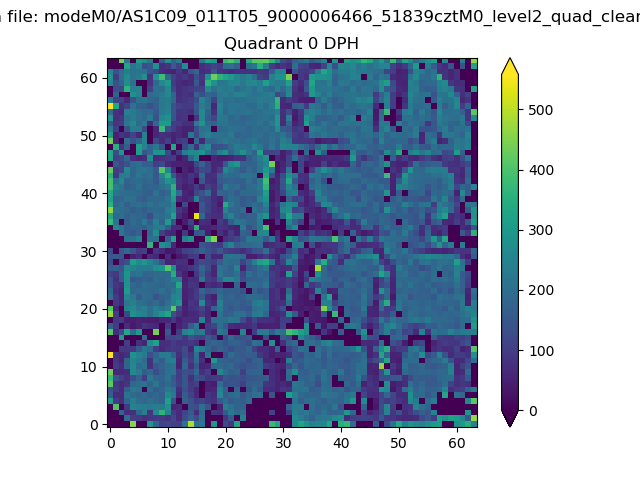 |
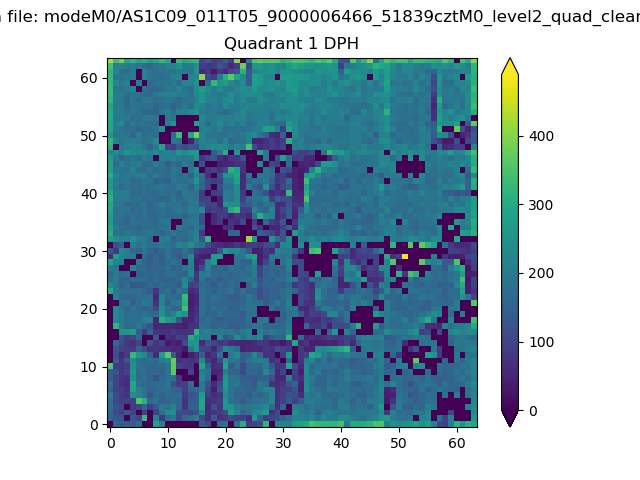 |
Quadrant B |
|---|---|---|---|
| Quadrant D | 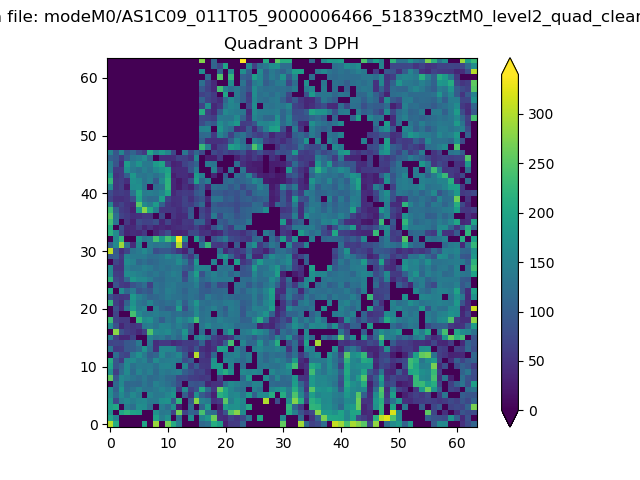 |
 |
Quadrant C |
| Plot type | Count rate plots | Images |
|---|---|---|
| Comparison with Poisson distribution Blue bars denote a histogram of data divided into 1 sec bins. Red curve is a Poisson curve with rate = median count rate of data. |
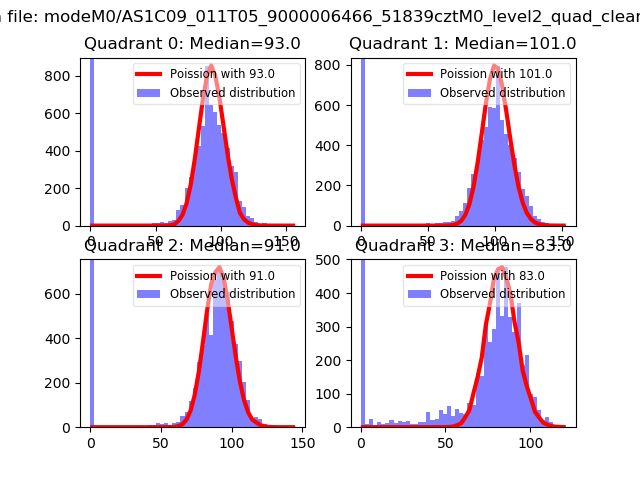 |
 |
| Quadrant-wise count rates Data is divided into 100 sec bins |
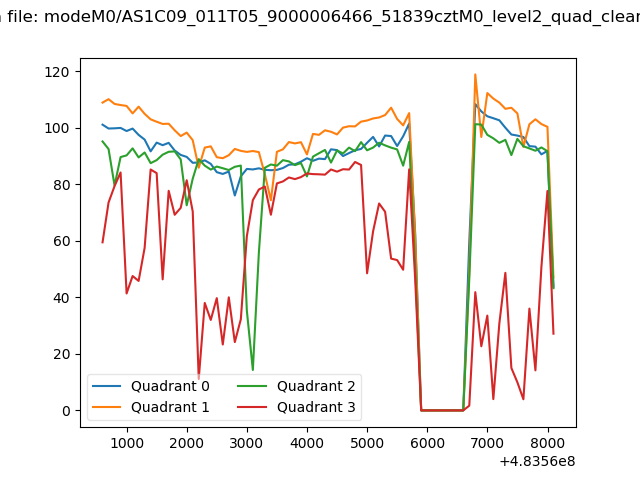 |
|
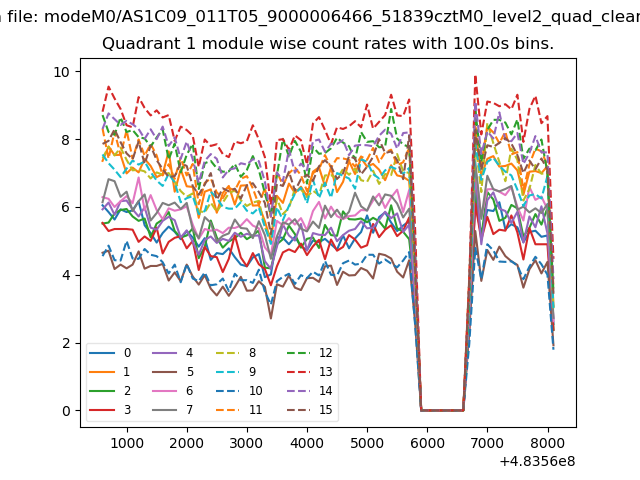
| Module-wise count rates for Quadrant A Data is divided into 100 sec bins |
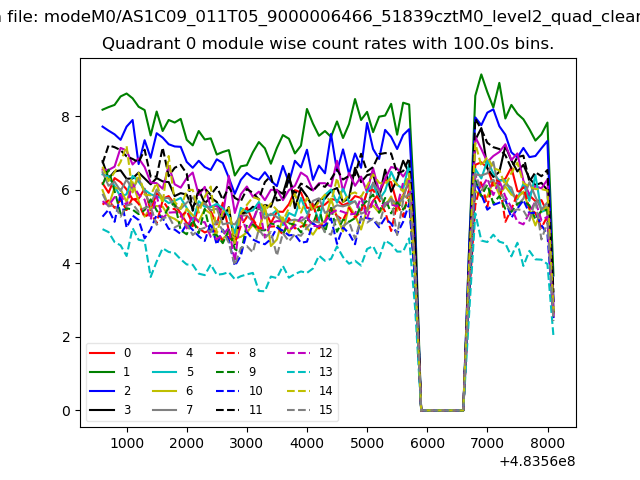 |
 |
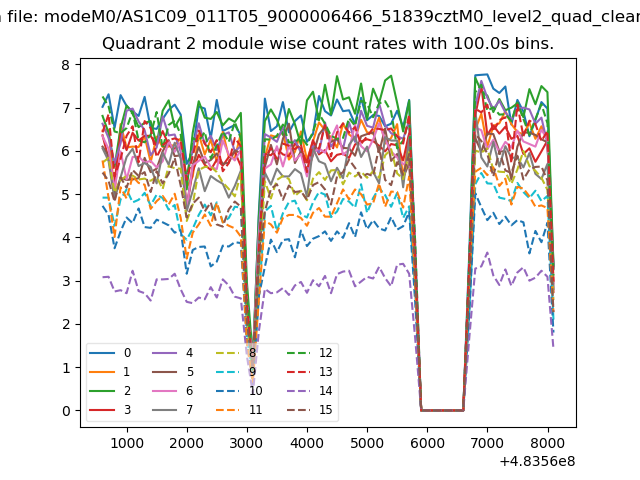
| Module-wise count rates for Quadrant B Data is divided into 100 sec bins |
 |
 |
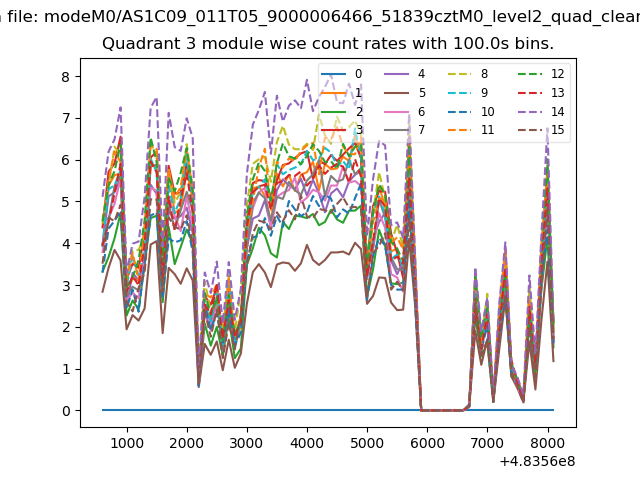
| Module-wise count rates for Quadrant C Data is divided into 100 sec bins |
 |
 |
| Module-wise count rates for Quadrant D Data is divided into 100 sec bins |
 |
 |
| Parameter | Plot |
|---|---|
| CZT HV Monitor | 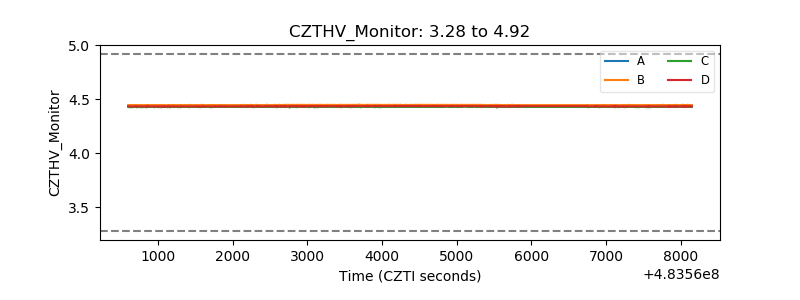 |
| D_VDD | 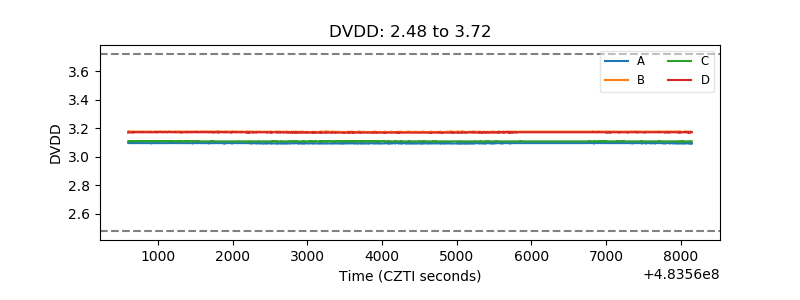 |
| Temperature 1 | 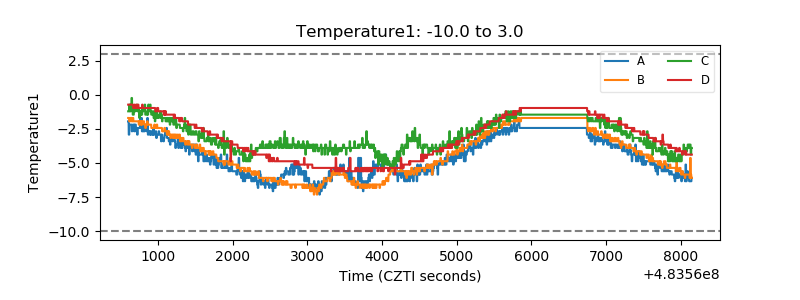 |
| Veto HV Monitor | 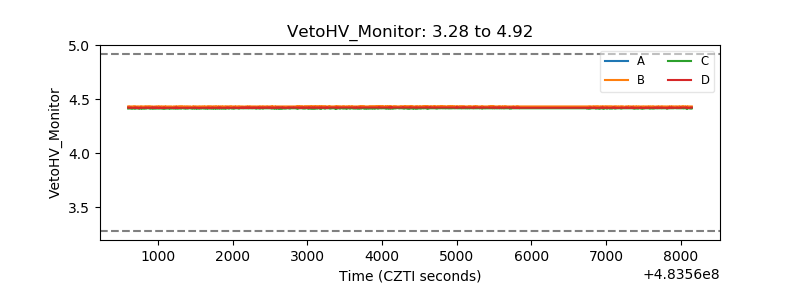 |
| Veto LLD | 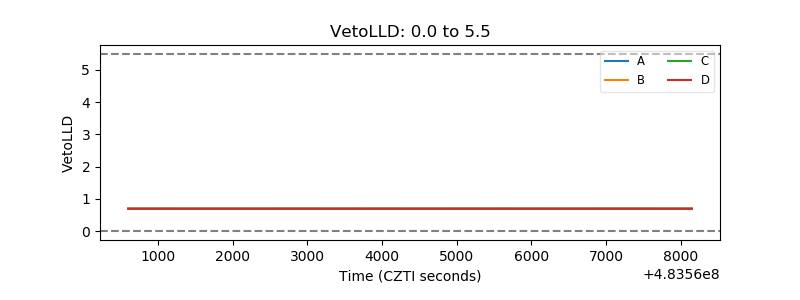 |
| Alpha Counter | 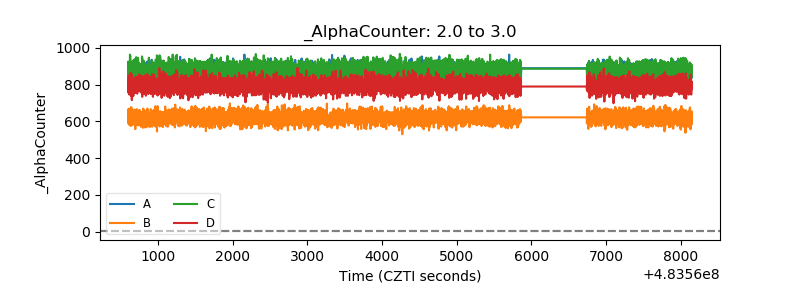 |
| _CPM_Rate | 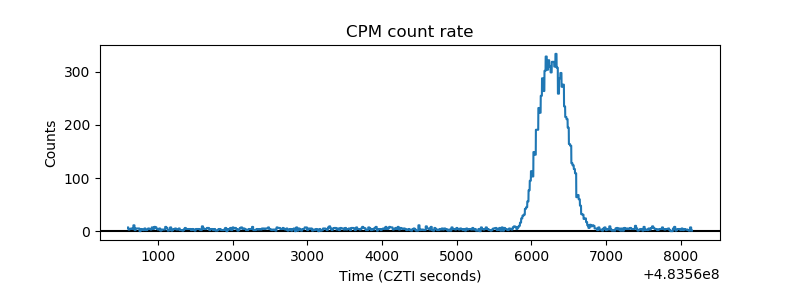 |
| CZT Counter | 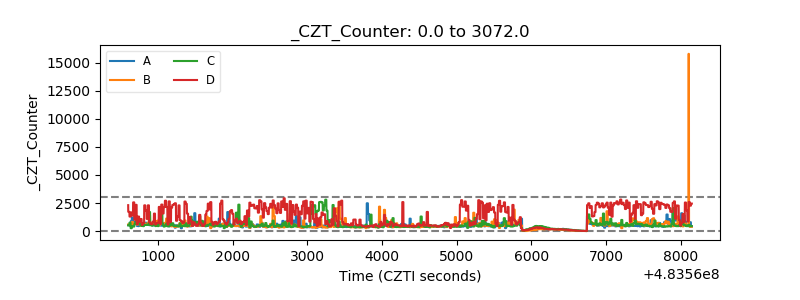 |
| +2.5 Volts monitor | 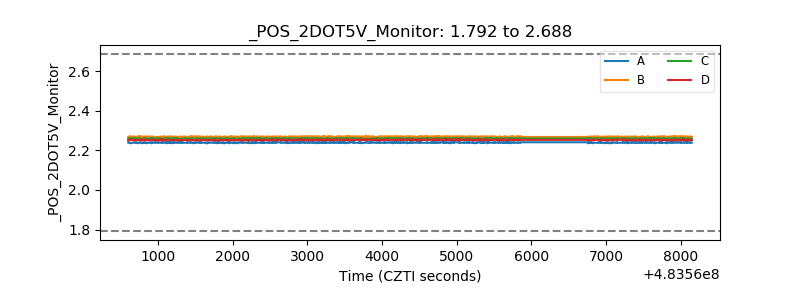 |
| +5 Volts monitor | 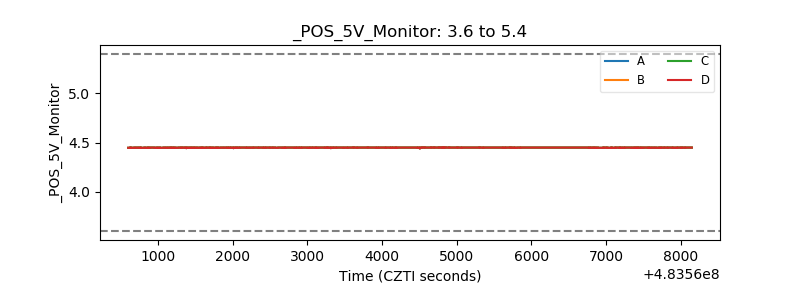 |
| _ROLL_ROT | 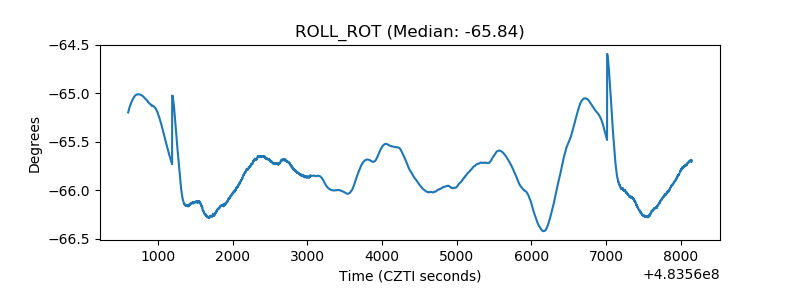 |
| _Roll_DEC | 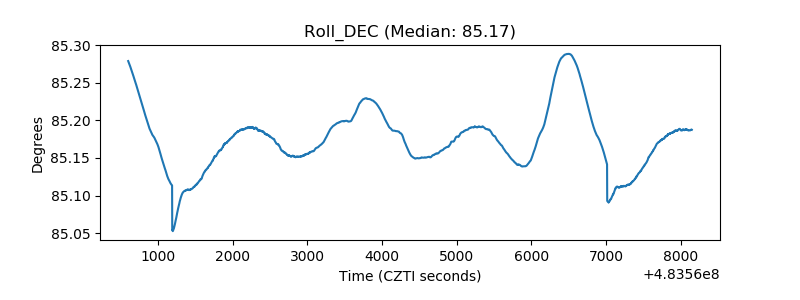 |
| _Roll_RA | 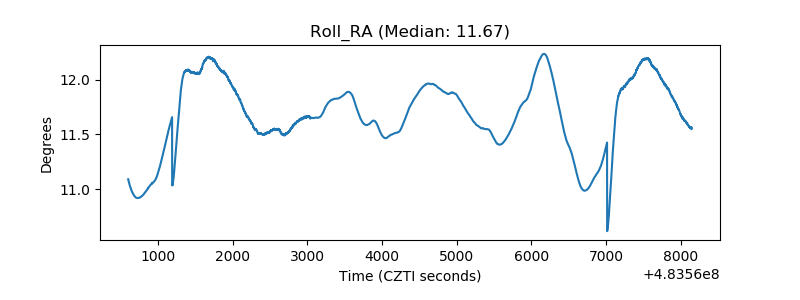 |
| Veto Counter | 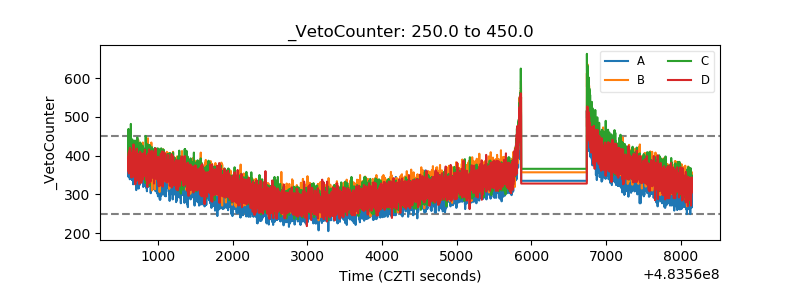 |