| Param | Original file | Final file |
|---|---|---|
| Filename | modeM0/AS1C09_011T05_9000006466_51841cztM0_level2.fits | modeM0/AS1C09_011T05_9000006466_51841cztM0_level2_quad_clean.evt |
| Size (bytes) | 659,200,320 | 88,004,160 |
| Size | 628.7 MB | 83.9 MB |
| Events in quadrant A | 5,121,409 | 582,397 |
| Events in quadrant B | 4,057,118 | 671,765 |
| Events in quadrant C | 4,491,976 | 585,528 |
| Events in quadrant D | 10,216,731 | 362,693 |
| Mode SS | |||
|---|---|---|---|
| Quadrant | BADHDUFLAG | Total packets | Discarded packets |
| A | 0 | 134 | 0 |
| B | 0 | 134 | 0 |
| C | 0 | 134 | 0 |
| D | 0 | 134 | 0 |
| Mode M0 | |||
|---|---|---|---|
| Quadrant | BADHDUFLAG | Total packets | Discarded packets |
| A | 0 | 19770 | 2 |
| B | 0 | 16867 | 3 |
| C | 0 | 18057 | 2 |
| D | 0 | 35002 | 2 |
| Mode M9 | |||
|---|---|---|---|
| Quadrant | BADHDUFLAG | Total packets | Discarded packets |
| A | 0 | 13 | 0 |
| B | 0 | 14 | 0 |
| C | 0 | 14 | 0 |
| D | 0 | 14 | 0 |
| Quadrant | Total seconds | Saturated seconds | Saturation percentage |
|---|---|---|---|
| A | 6628 | 513 | 7.739891% |
| B | 6627 | 177 | 2.670892% |
| C | 6627 | 382 | 5.764298% |
| D | 6627 | 2700 | 40.742417% |
Noise dominated data is calculated using 1-second bins in cleaned event files. If a bin has >2000 counts, and if more than 50% of those come from <1% of pixels, then it is considered to be noise-dominated and hence unusable.
| Quadrant | # 1 sec bins | Bins with >0 counts | Bins with >2000 counts | High rate bins dominated by noise | Noise dominated (total time) | Noise dominated (detector-on time) | Marked lightcurve |
|---|---|---|---|---|---|---|---|
| A | 7683 | 6629 | 419 | 419 | 5.45% | 6.32% | 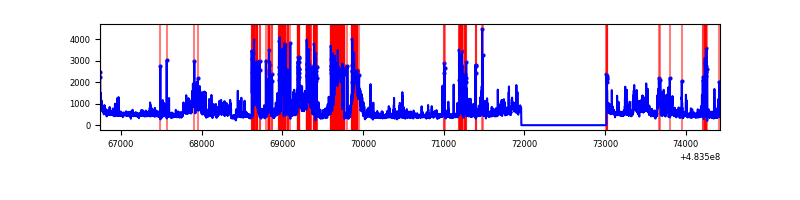 |
| B | 7682 | 6628 | 73 | 73 | 0.95% | 1.10% | 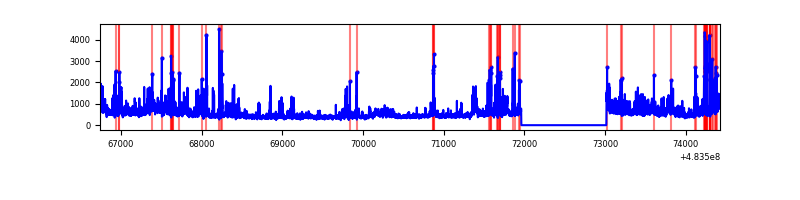 |
| C | 7682 | 6628 | 316 | 316 | 4.11% | 4.77% | 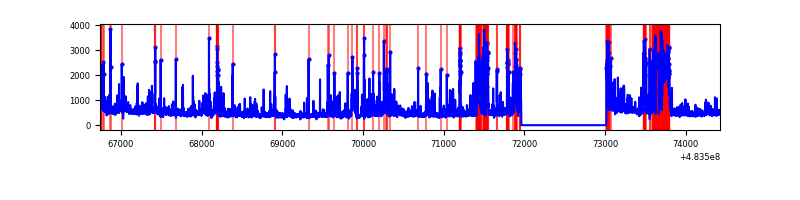 |
| D | 7682 | 6627 | 2333 | 2333 | 30.37% | 35.20% | 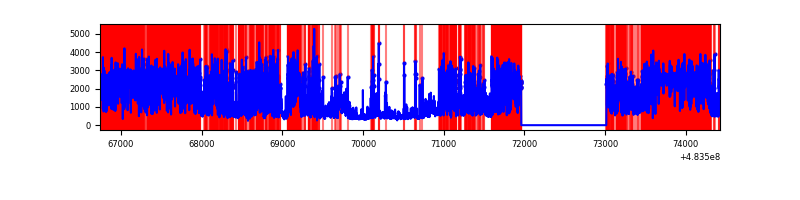 |
Top three noisy pixels from each quadrant. If the there are fewer than three noisy pixels in the level2.evt file, extra rows are filled as -1
| Pixel properties | Quadrant properties | ||||||
|---|---|---|---|---|---|---|---|
| Quadrant | DetID | PixID | Counts | Sigma | Mean | Median | Sigma |
| A | 15 | 174 | 1103449 | 6740.62 | 665 | 648 | 163.6 |
| A | 12 | 3 | 522708 | 3190.97 | 665 | 648 | 163.6 |
| A | 11 | 3 | 210765 | 1284.29 | 665 | 648 | 163.6 |
| B | 5 | 32 | 296142 | 2045.72 | 685 | 663 | 144.4 |
| B | 5 | 185 | 176337 | 1216.26 | 685 | 663 | 144.4 |
| B | 5 | 172 | 165782 | 1143.19 | 685 | 663 | 144.4 |
| C | 15 | 218 | 790441 | 4258.94 | 669 | 663 | 185.4 |
| C | 13 | 3 | 150452 | 807.75 | 669 | 663 | 185.4 |
| C | 15 | 224 | 108905 | 583.7 | 669 | 663 | 185.4 |
| D | 11 | 129 | 4472172 | 29712.49 | 526 | 506 | 150.5 |
| D | 3 | 12 | 1209502 | 8033.31 | 526 | 506 | 150.5 |
| D | 12 | 6 | 995330 | 6610.22 | 526 | 506 | 150.5 |
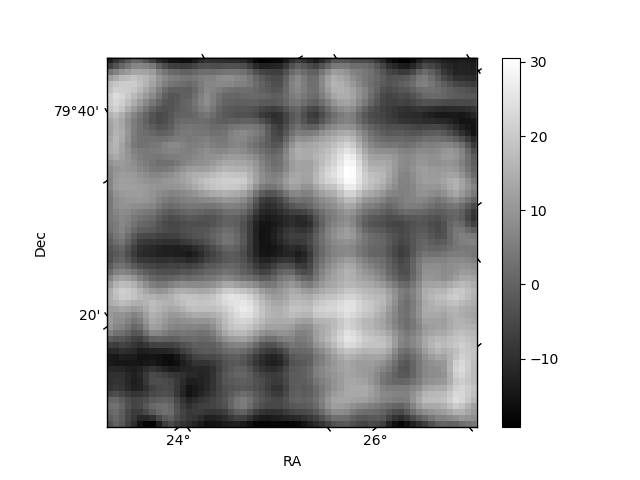
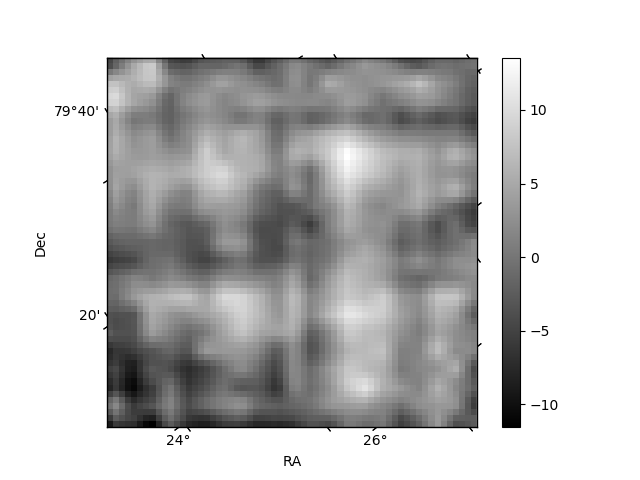
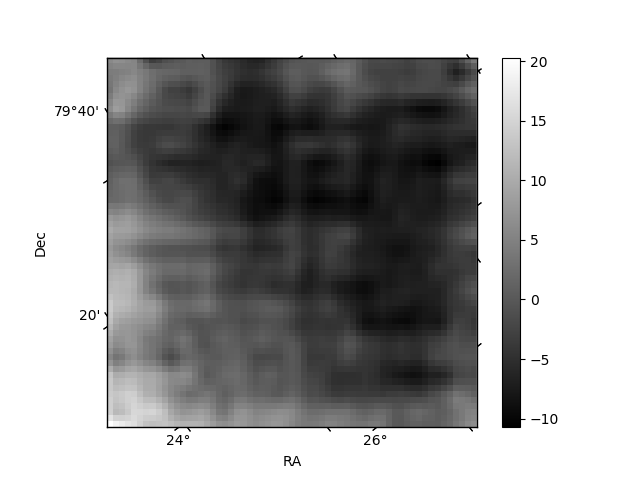
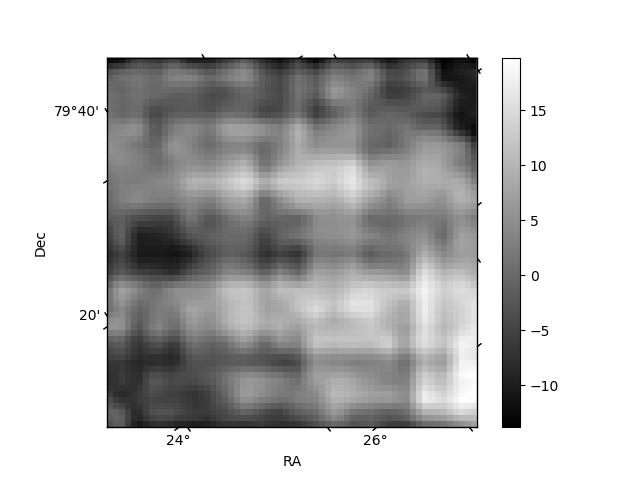
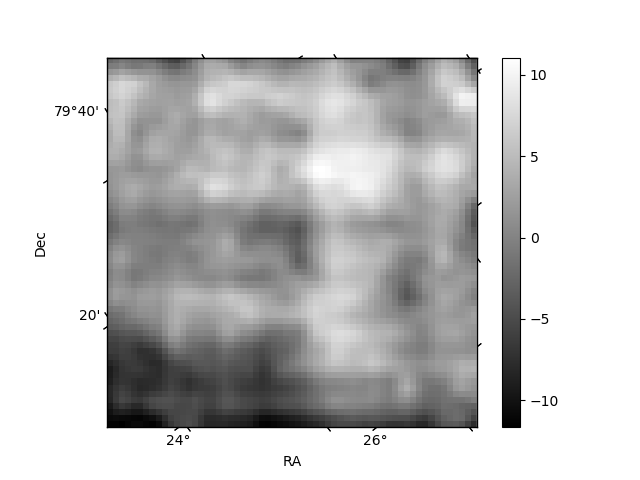
Histogram calculated using DETX and DETY for each event in the final _common_clean file
| Quadrant A | 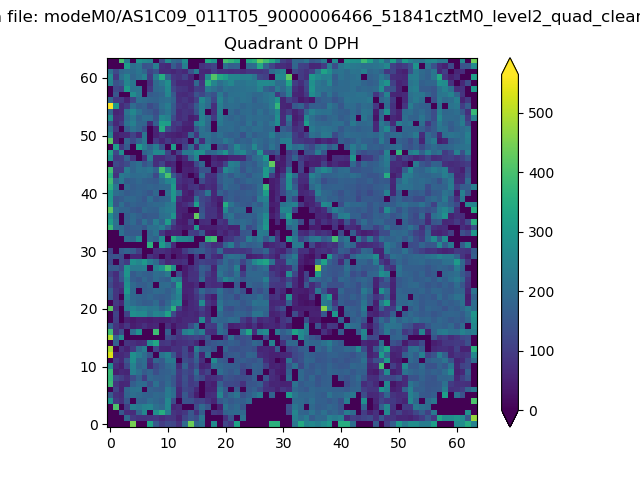 |
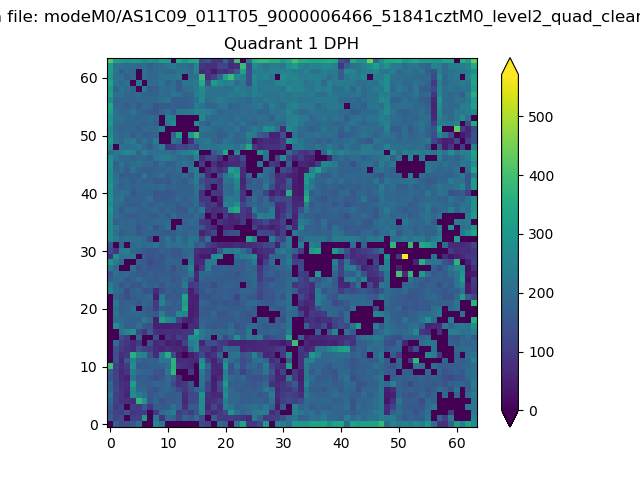 |
Quadrant B |
|---|---|---|---|
| Quadrant D | 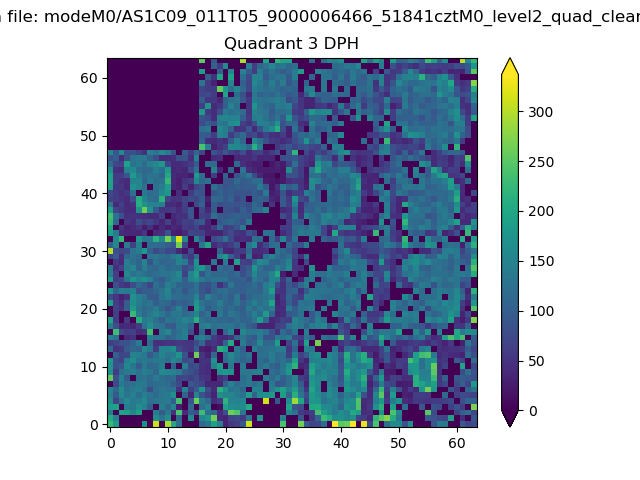 |
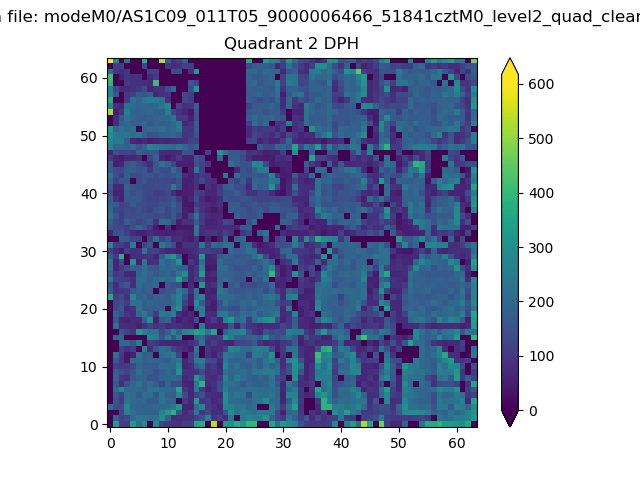 |
Quadrant C |
| Plot type | Count rate plots | Images |
|---|---|---|
| Comparison with Poisson distribution Blue bars denote a histogram of data divided into 1 sec bins. Red curve is a Poisson curve with rate = median count rate of data. |
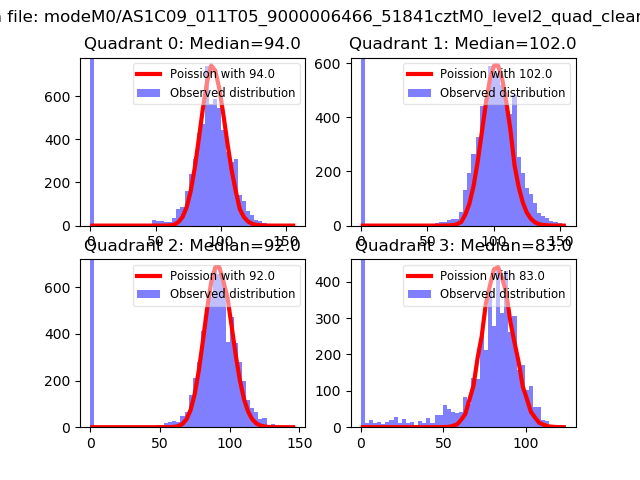 |
 |
| Quadrant-wise count rates Data is divided into 100 sec bins |
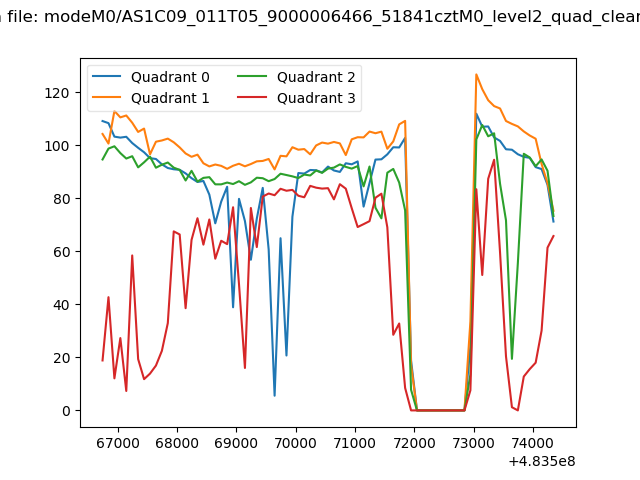 |
|
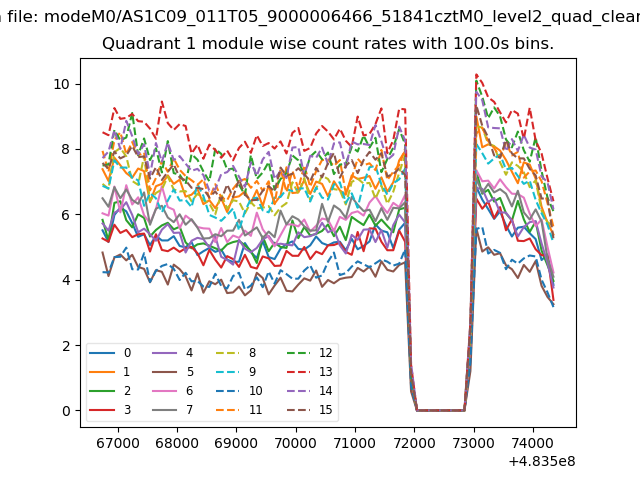
| Module-wise count rates for Quadrant A Data is divided into 100 sec bins |
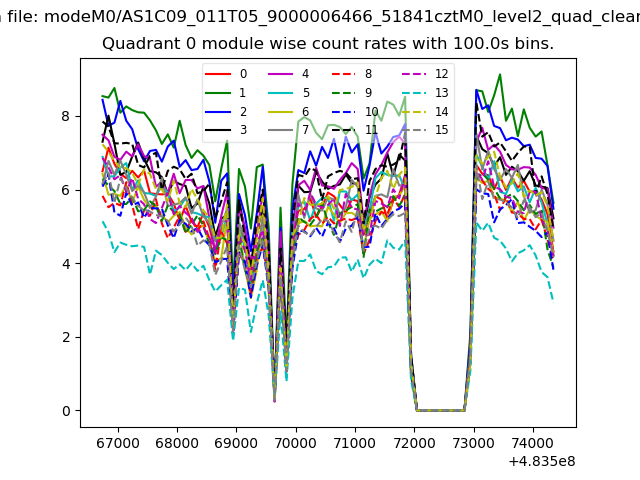 |
 |
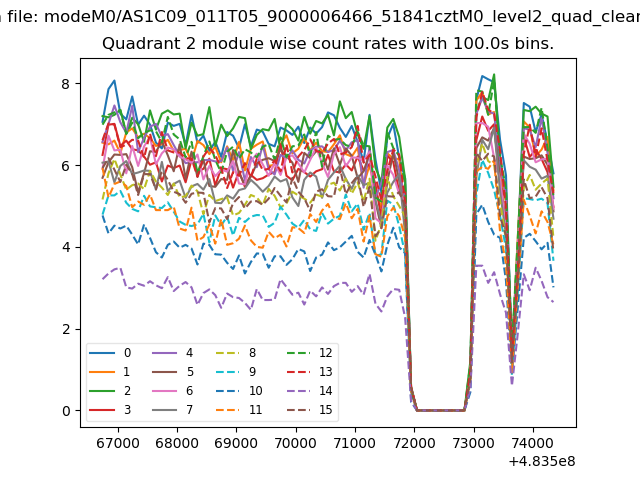
| Module-wise count rates for Quadrant B Data is divided into 100 sec bins |
 |
 |
| Module-wise count rates for Quadrant C Data is divided into 100 sec bins |
 |
 |
| Module-wise count rates for Quadrant D Data is divided into 100 sec bins |
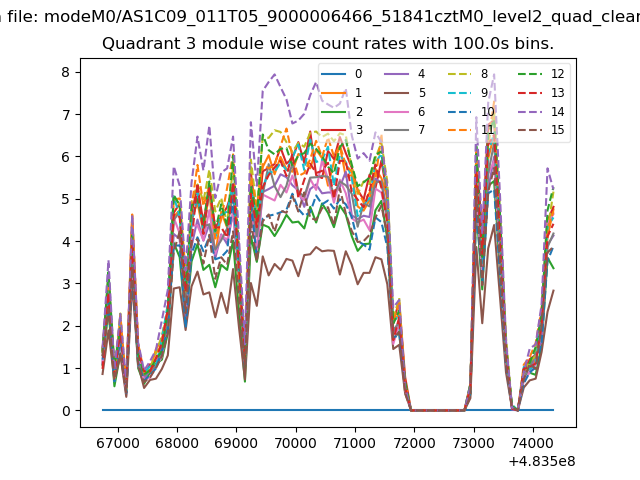 |
 |
| Parameter | Plot |
|---|---|
| CZT HV Monitor | 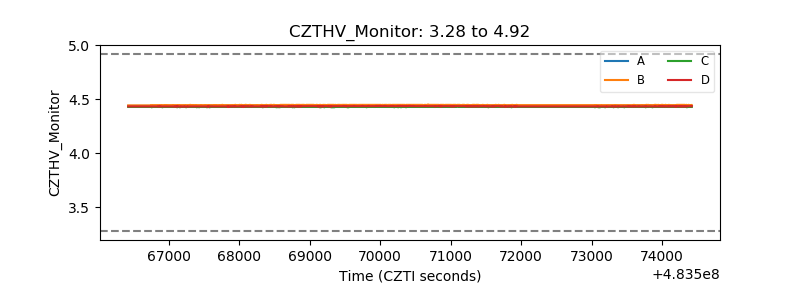 |
| D_VDD | 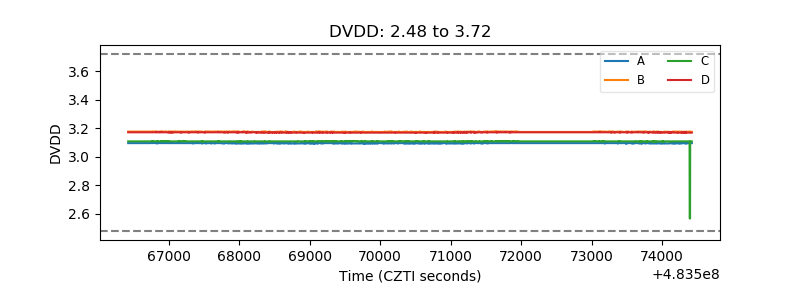 |
| Temperature 1 | 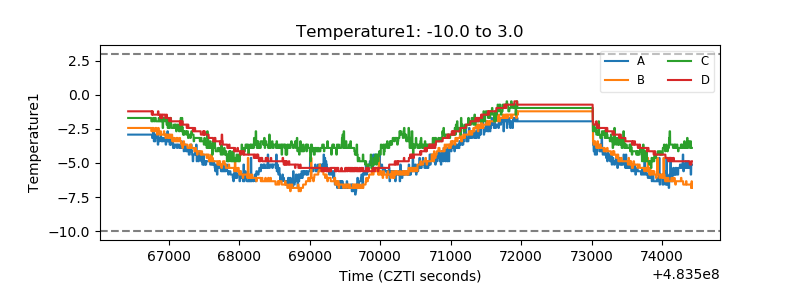 |
| Veto HV Monitor |  |
| Veto LLD | 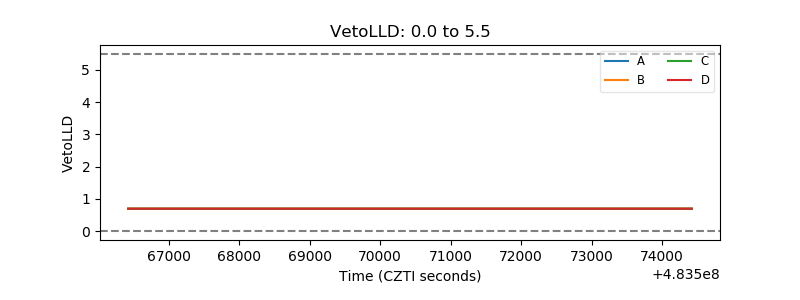 |
| Alpha Counter | 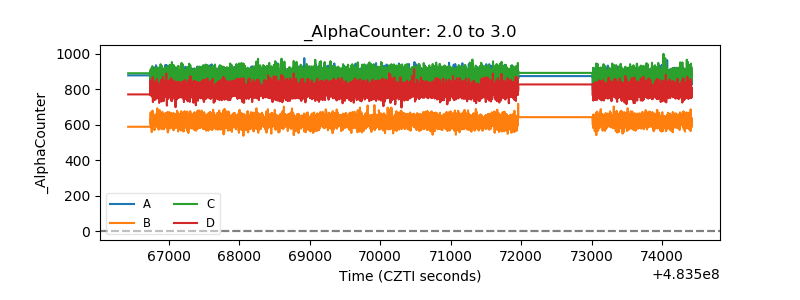 |
| _CPM_Rate | 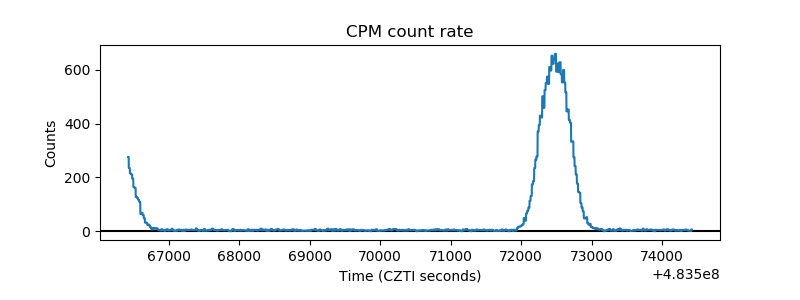 |
| CZT Counter | 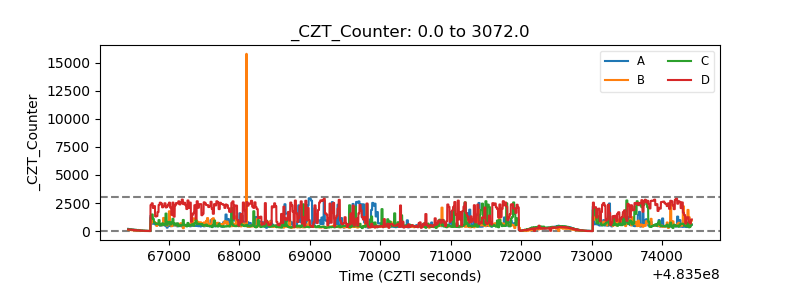 |
| +2.5 Volts monitor | 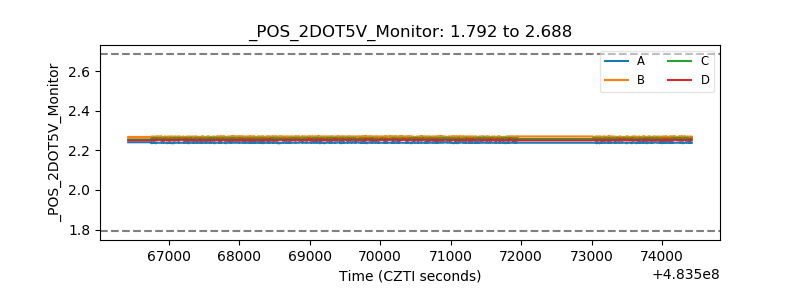 |
| +5 Volts monitor | 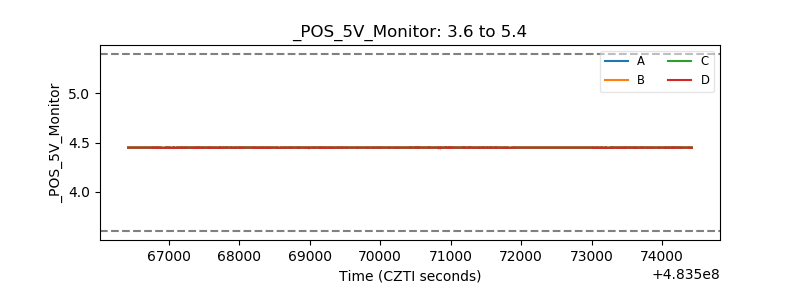 |
| _ROLL_ROT | 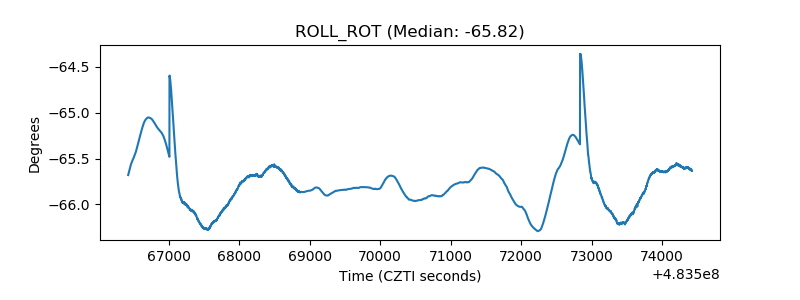 |
| _Roll_DEC | 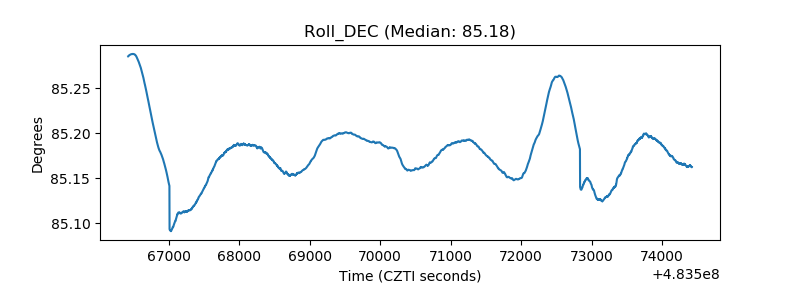 |
| _Roll_RA | 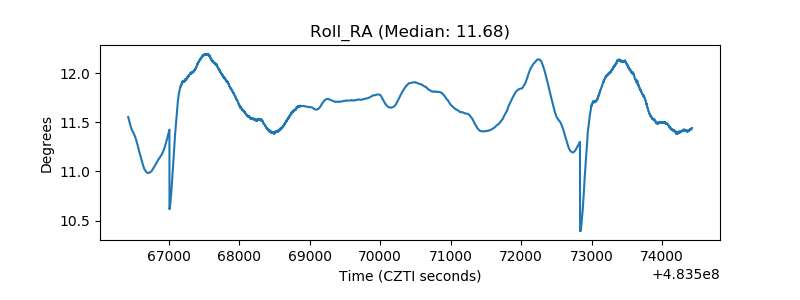 |
| Veto Counter | 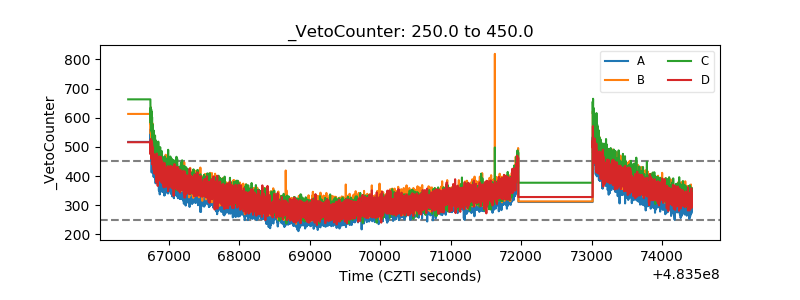 |