| Param | Original file | Final file |
|---|---|---|
| Filename | modeM0/AS1C09_011T05_9000006466_51842cztM0_level2.fits | modeM0/AS1C09_011T05_9000006466_51842cztM0_level2_quad_clean.evt |
| Size (bytes) | 689,924,160 | 85,383,360 |
| Size | 658.0 MB | 81.4 MB |
| Events in quadrant A | 4,555,368 | 602,609 |
| Events in quadrant B | 4,663,456 | 648,577 |
| Events in quadrant C | 4,837,850 | 563,313 |
| Events in quadrant D | 10,988,457 | 325,640 |
| Mode SS | |||
|---|---|---|---|
| Quadrant | BADHDUFLAG | Total packets | Discarded packets |
| A | 0 | 132 | 0 |
| B | 0 | 132 | 0 |
| C | 0 | 132 | 0 |
| D | 0 | 132 | 0 |
| Mode M0 | |||
|---|---|---|---|
| Quadrant | BADHDUFLAG | Total packets | Discarded packets |
| A | 0 | 18047 | 2 |
| B | 0 | 18372 | 2 |
| C | 0 | 18825 | 2 |
| D | 0 | 37093 | 6 |
| Mode M9 | |||
|---|---|---|---|
| Quadrant | BADHDUFLAG | Total packets | Discarded packets |
| A | 0 | 20 | 0 |
| B | 0 | 21 | 0 |
| C | 0 | 21 | 0 |
| D | 0 | 21 | 0 |
| Quadrant | Total seconds | Saturated seconds | Saturation percentage |
|---|---|---|---|
| A | 6373 | 165 | 2.589048% |
| B | 6373 | 324 | 5.083948% |
| C | 6373 | 521 | 8.175114% |
| D | 6372 | 3014 | 47.300691% |
Noise dominated data is calculated using 1-second bins in cleaned event files. If a bin has >2000 counts, and if more than 50% of those come from <1% of pixels, then it is considered to be noise-dominated and hence unusable.
| Quadrant | # 1 sec bins | Bins with >0 counts | Bins with >2000 counts | High rate bins dominated by noise | Noise dominated (total time) | Noise dominated (detector-on time) | Marked lightcurve |
|---|---|---|---|---|---|---|---|
| A | 7473 | 6374 | 112 | 112 | 1.50% | 1.76% | 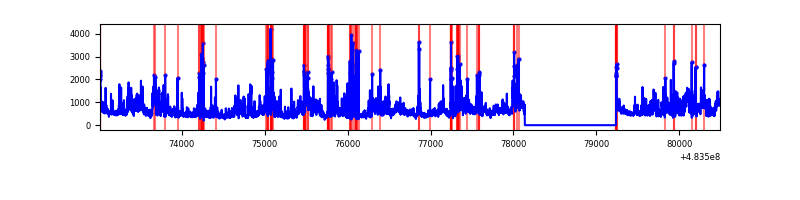 |
| B | 7473 | 6374 | 164 | 164 | 2.19% | 2.57% | 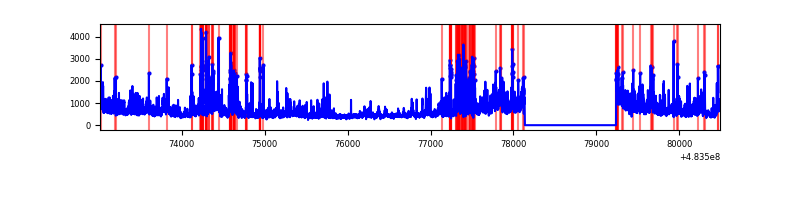 |
| C | 7473 | 6373 | 385 | 385 | 5.15% | 6.04% | 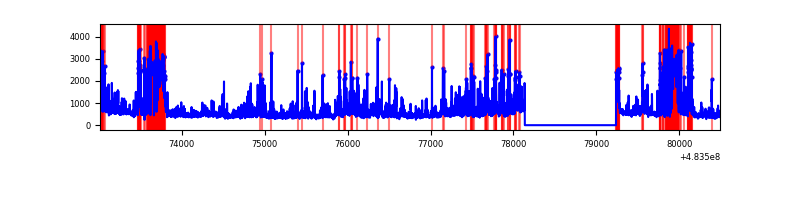 |
| D | 7472 | 6372 | 2626 | 2626 | 35.14% | 41.21% | 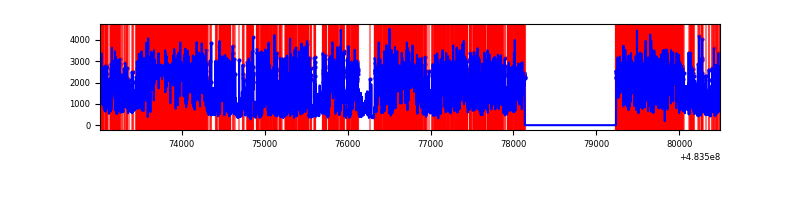 |
Top three noisy pixels from each quadrant. If the there are fewer than three noisy pixels in the level2.evt file, extra rows are filled as -1
| Pixel properties | Quadrant properties | ||||||
|---|---|---|---|---|---|---|---|
| Quadrant | DetID | PixID | Counts | Sigma | Mean | Median | Sigma |
| A | 12 | 3 | 872398 | 5305.31 | 662 | 646 | 164.3 |
| A | 15 | 174 | 365808 | 2222.3 | 662 | 646 | 164.3 |
| A | 11 | 3 | 185137 | 1122.78 | 662 | 646 | 164.3 |
| B | 5 | 185 | 443649 | 3164.39 | 659 | 638 | 140.0 |
| B | 5 | 32 | 414656 | 2957.29 | 659 | 638 | 140.0 |
| B | 8 | 128 | 282616 | 2014.14 | 659 | 638 | 140.0 |
| C | 15 | 218 | 973064 | 5523.07 | 637 | 633 | 176.1 |
| C | 15 | 219 | 254266 | 1440.55 | 637 | 633 | 176.1 |
| C | 15 | 248 | 210885 | 1194.16 | 637 | 633 | 176.1 |
| D | 11 | 129 | 5921598 | 42706.14 | 491 | 474 | 138.6 |
| D | 3 | 12 | 967116 | 6971.91 | 491 | 474 | 138.6 |
| D | 12 | 6 | 832124 | 5998.28 | 491 | 474 | 138.6 |
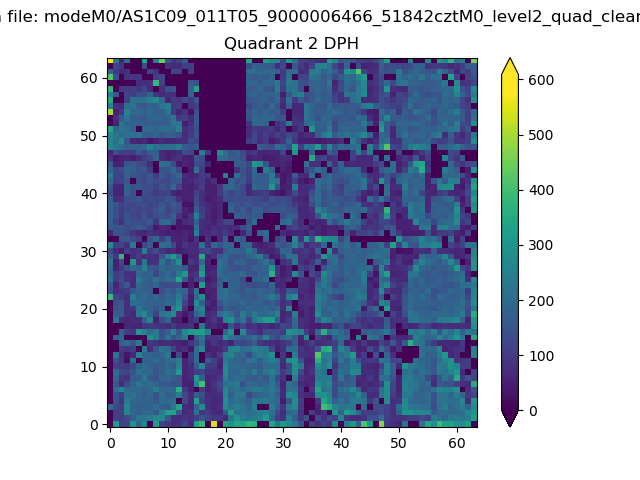
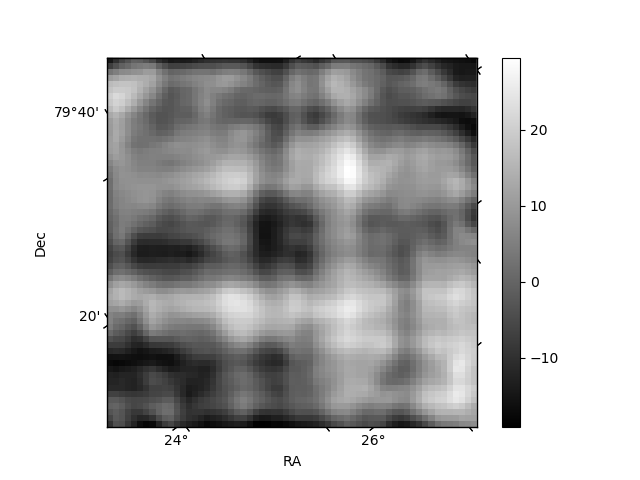
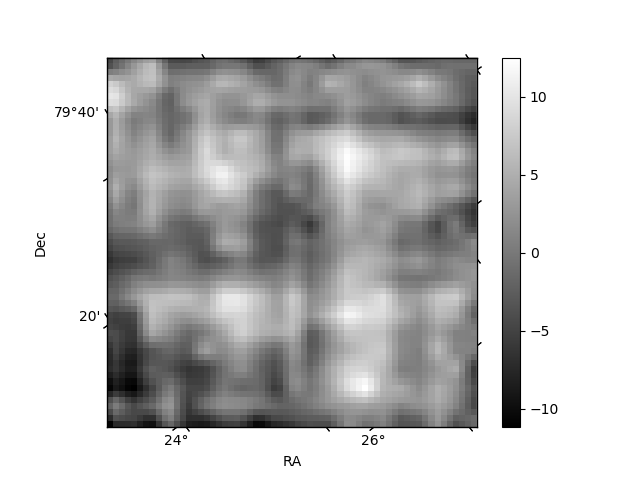
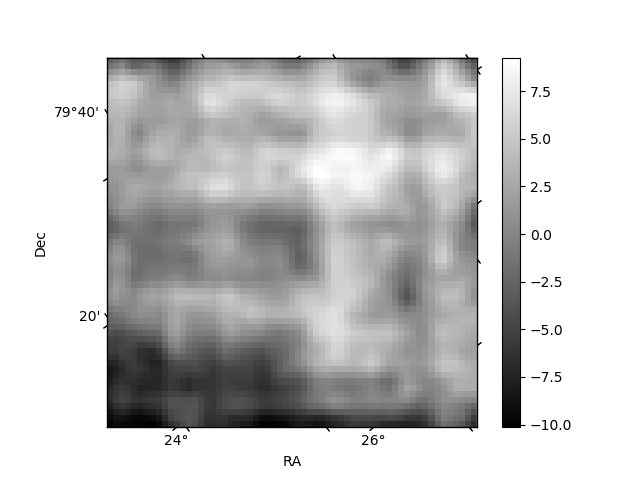
Histogram calculated using DETX and DETY for each event in the final _common_clean file
| Quadrant A | 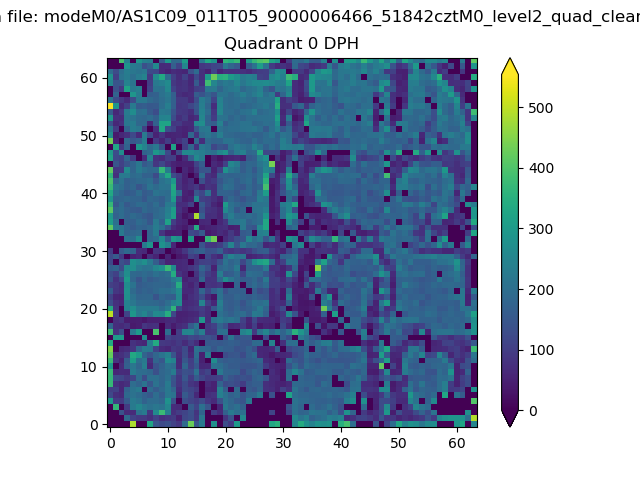 |
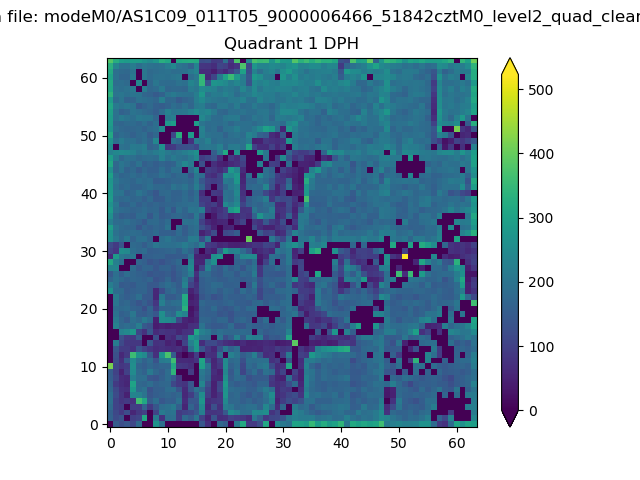 |
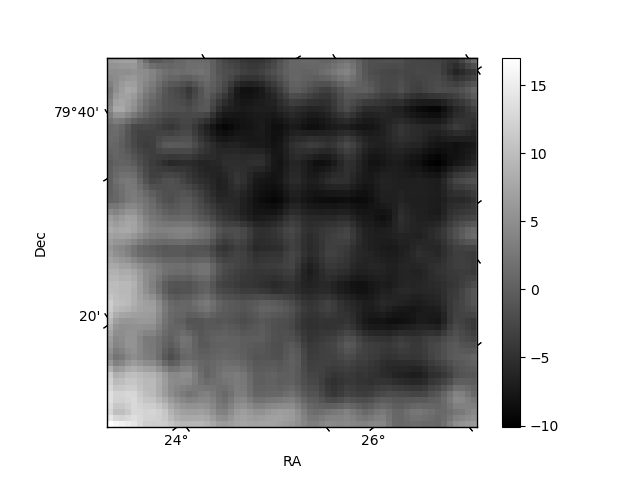
Quadrant B |
|---|---|---|---|
| Quadrant D | 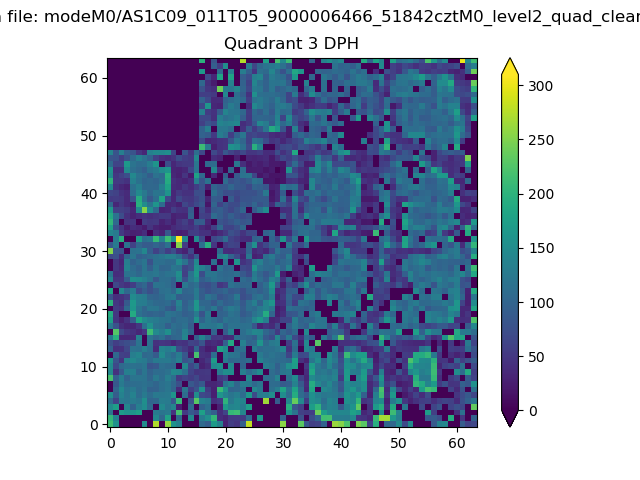 |
 |
Quadrant C |
| Plot type | Count rate plots | Images |
|---|---|---|
| Comparison with Poisson distribution Blue bars denote a histogram of data divided into 1 sec bins. Red curve is a Poisson curve with rate = median count rate of data. |
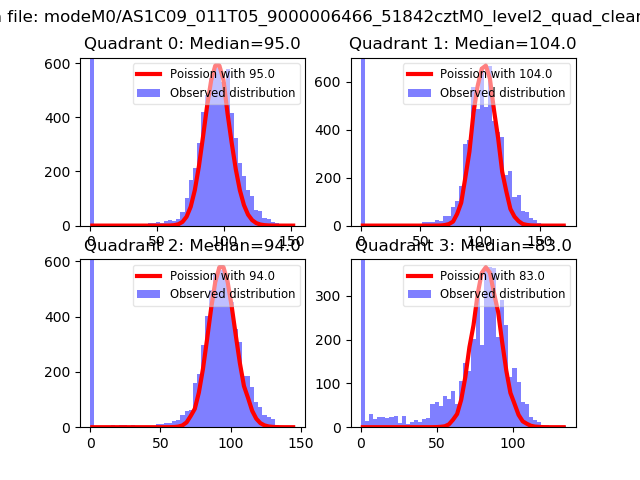 |
 |
| Quadrant-wise count rates Data is divided into 100 sec bins |
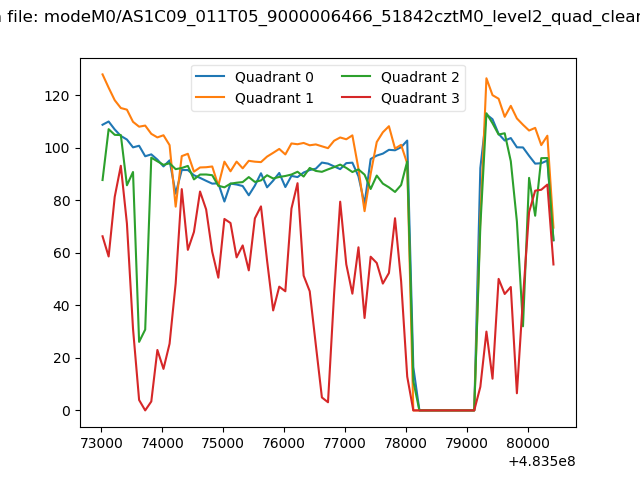 |
|
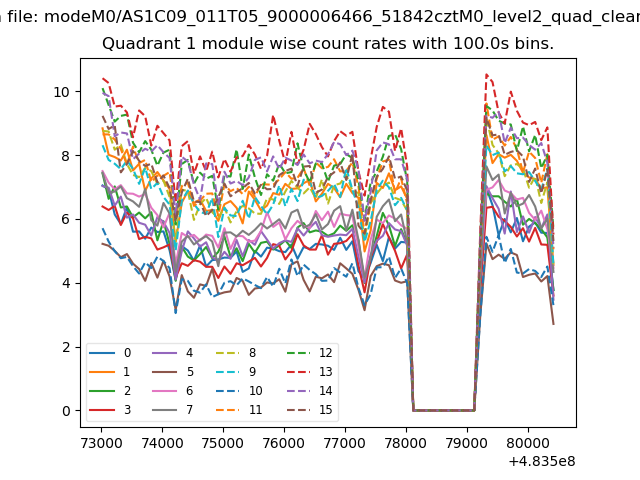
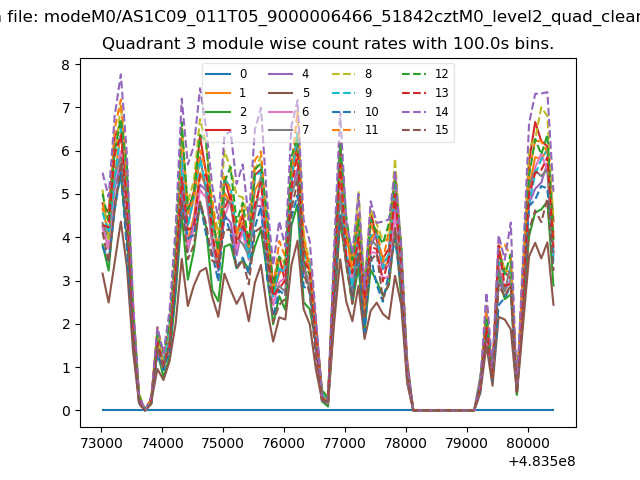
| Module-wise count rates for Quadrant A Data is divided into 100 sec bins |
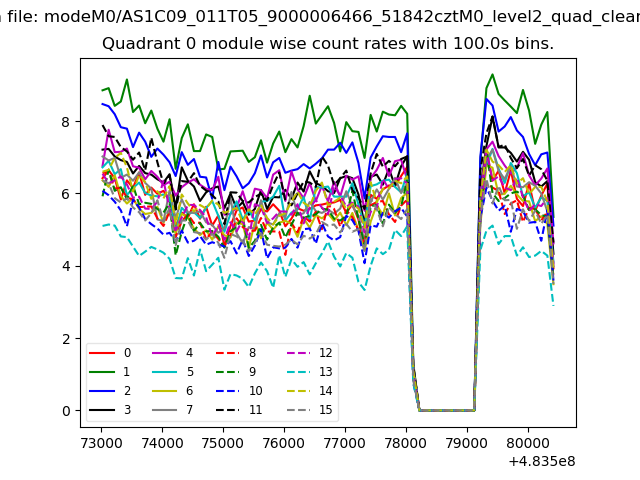 |
 |
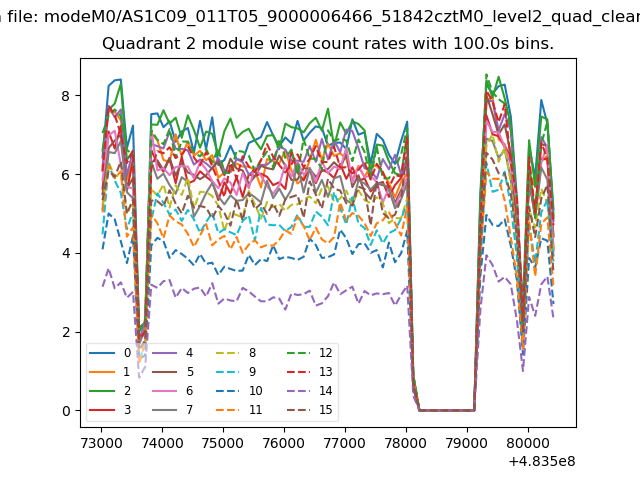
| Module-wise count rates for Quadrant B Data is divided into 100 sec bins |
 |
 |
| Module-wise count rates for Quadrant C Data is divided into 100 sec bins |
 |
 |
| Module-wise count rates for Quadrant D Data is divided into 100 sec bins |
 |
 |
| Parameter | Plot |
|---|---|
| CZT HV Monitor | 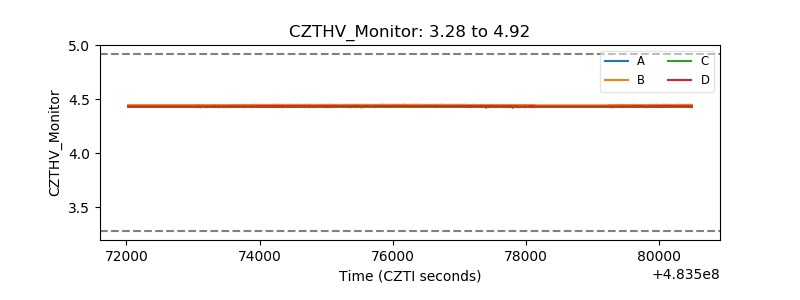 |
| D_VDD | 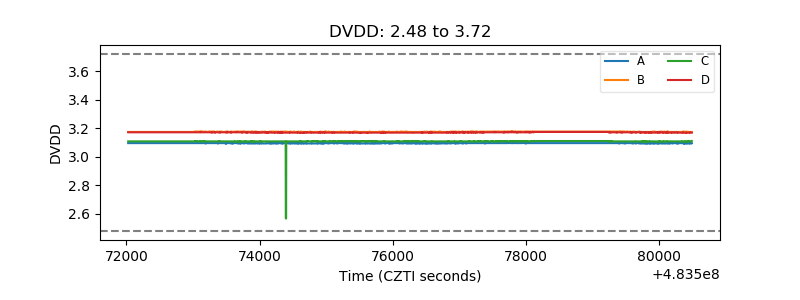 |
| Temperature 1 | 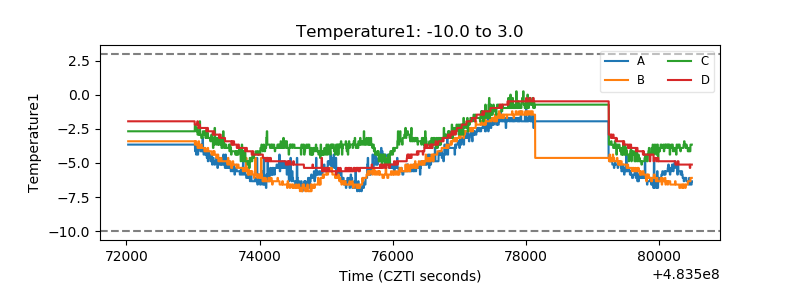 |
| Veto HV Monitor |  |
| Veto LLD | 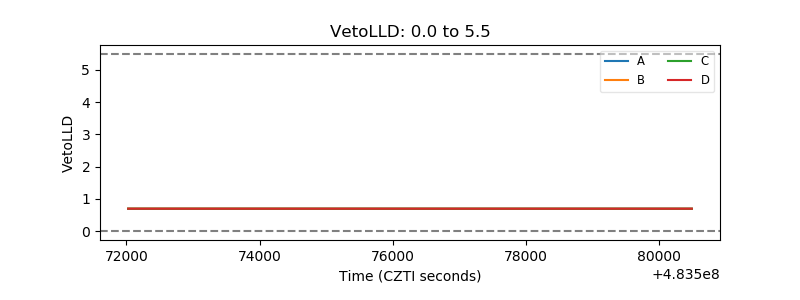 |
| Alpha Counter | 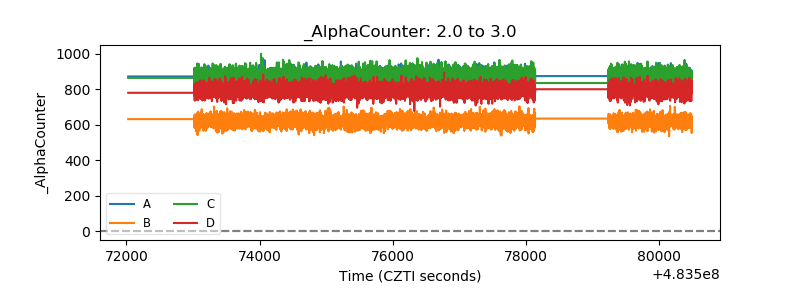 |
| _CPM_Rate | 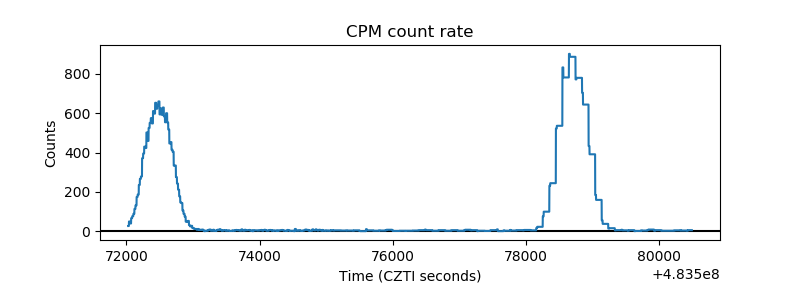 |
| CZT Counter | 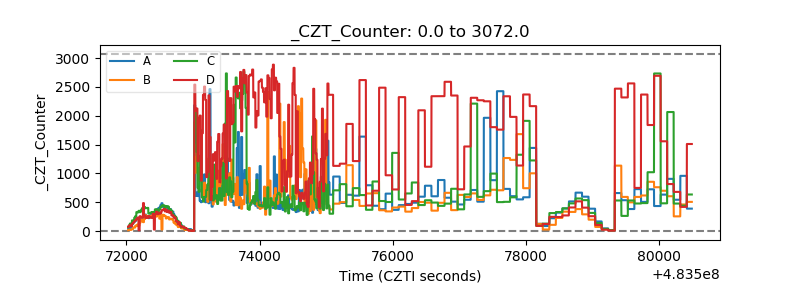 |
| +2.5 Volts monitor |  |
| +5 Volts monitor |  |
| _ROLL_ROT | 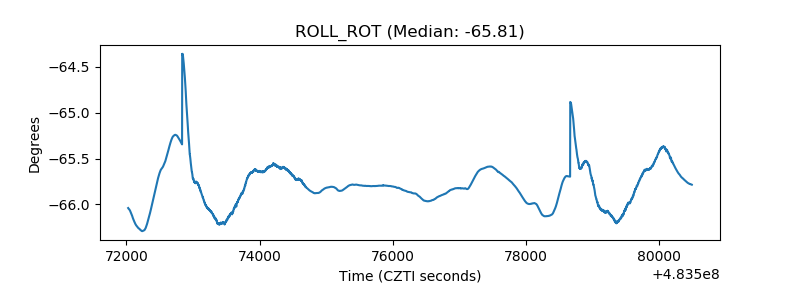 |
| _Roll_DEC | 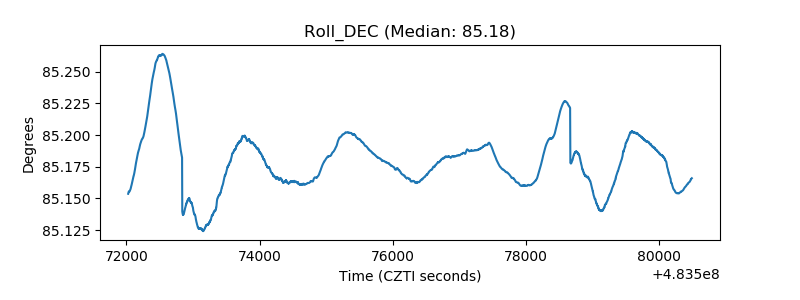 |
| _Roll_RA | 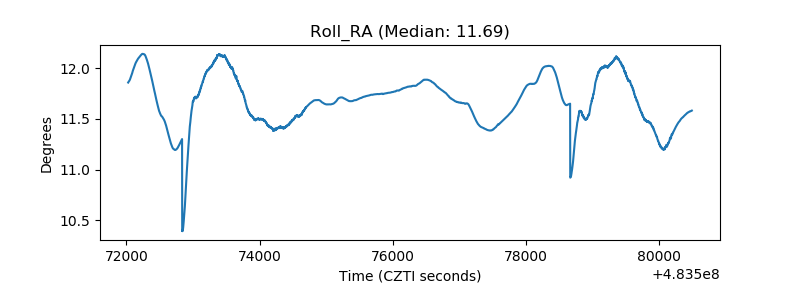 |
| Veto Counter | 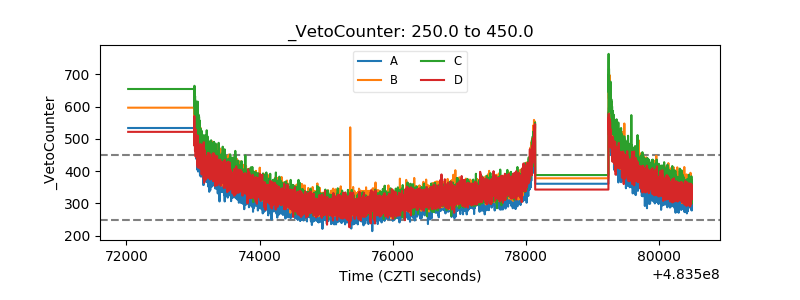 |