| Param | Original file | Final file |
|---|---|---|
| Filename | modeM0/AS1C09_011T05_9000006466_51843cztM0_level2.fits | modeM0/AS1C09_011T05_9000006466_51843cztM0_level2_quad_clean.evt |
| Size (bytes) | 806,814,720 | 88,502,400 |
| Size | 769.4 MB | 84.4 MB |
| Events in quadrant A | 4,589,424 | 638,012 |
| Events in quadrant B | 7,295,871 | 641,307 |
| Events in quadrant C | 6,617,758 | 544,804 |
| Events in quadrant D | 10,845,210 | 388,687 |
| Mode SS | |||
|---|---|---|---|
| Quadrant | BADHDUFLAG | Total packets | Discarded packets |
| A | 0 | 134 | 0 |
| B | 0 | 134 | 0 |
| C | 0 | 134 | 0 |
| D | 0 | 134 | 0 |
| Mode M0 | |||
|---|---|---|---|
| Quadrant | BADHDUFLAG | Total packets | Discarded packets |
| A | 0 | 18358 | 2 |
| B | 0 | 26306 | 2 |
| C | 0 | 24358 | 2 |
| D | 0 | 36890 | 2 |
| Mode M9 | |||
|---|---|---|---|
| Quadrant | BADHDUFLAG | Total packets | Discarded packets |
| A | 0 | 19 | 0 |
| B | 0 | 20 | 0 |
| C | 0 | 20 | 0 |
| D | 0 | 20 | 0 |
| Quadrant | Total seconds | Saturated seconds | Saturation percentage |
|---|---|---|---|
| A | 6699 | 177 | 2.642185% |
| B | 6699 | 907 | 13.539334% |
| C | 6699 | 1154 | 17.226452% |
| D | 6699 | 2612 | 38.990894% |
Noise dominated data is calculated using 1-second bins in cleaned event files. If a bin has >2000 counts, and if more than 50% of those come from <1% of pixels, then it is considered to be noise-dominated and hence unusable.
| Quadrant | # 1 sec bins | Bins with >0 counts | Bins with >2000 counts | High rate bins dominated by noise | Noise dominated (total time) | Noise dominated (detector-on time) | Marked lightcurve |
|---|---|---|---|---|---|---|---|
| A | 7854 | 6700 | 125 | 125 | 1.59% | 1.87% |  |
| B | 7854 | 6700 | 654 | 654 | 8.33% | 9.76% |  |
| C | 7854 | 6700 | 840 | 840 | 10.70% | 12.54% | 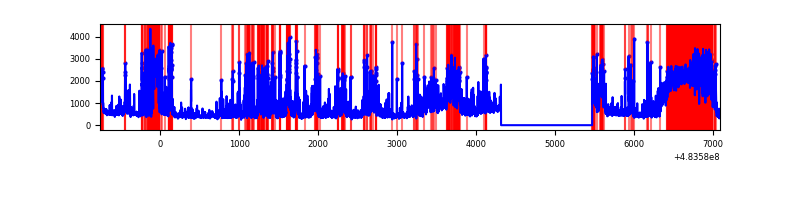 |
| D | 7853 | 6699 | 2339 | 2339 | 29.78% | 34.92% | 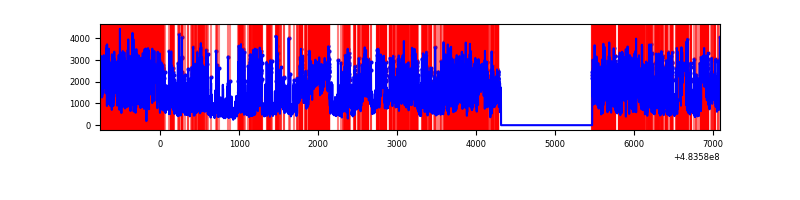 |
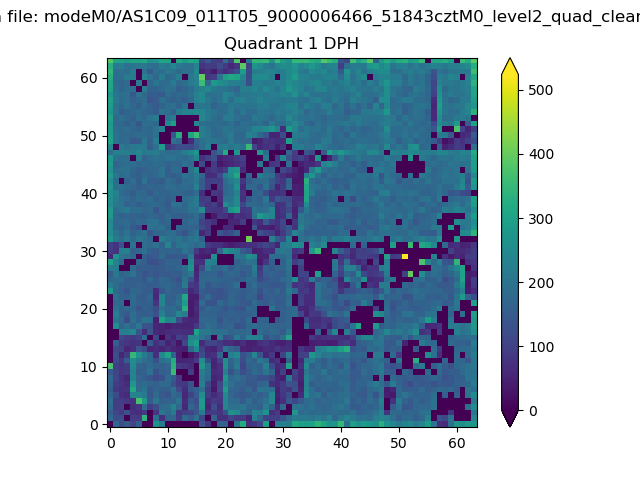
Top three noisy pixels from each quadrant. If the there are fewer than three noisy pixels in the level2.evt file, extra rows are filled as -1
| Pixel properties | Quadrant properties | ||||||
|---|---|---|---|---|---|---|---|
| Quadrant | DetID | PixID | Counts | Sigma | Mean | Median | Sigma |
| A | 12 | 3 | 772145 | 4497.91 | 693 | 675 | 171.5 |
| A | 11 | 3 | 329746 | 1918.58 | 693 | 675 | 171.5 |
| A | 5 | 240 | 167475 | 972.5 | 693 | 675 | 171.5 |
| B | 10 | 254 | 1781415 | 12468.4 | 674 | 652 | 142.8 |
| B | 4 | 206 | 976914 | 6835.51 | 674 | 652 | 142.8 |
| B | 5 | 185 | 707114 | 4946.45 | 674 | 652 | 142.8 |
| C | 15 | 218 | 2239694 | 12801.42 | 630 | 625 | 174.9 |
| C | 15 | 219 | 585730 | 3345.22 | 630 | 625 | 174.9 |
| C | 15 | 192 | 514540 | 2938.2 | 630 | 625 | 174.9 |
| D | 11 | 129 | 6007833 | 38777.4 | 551 | 530 | 154.9 |
| D | 8 | 176 | 736457 | 4750.44 | 551 | 530 | 154.9 |
| D | 12 | 6 | 605227 | 3903.35 | 551 | 530 | 154.9 |
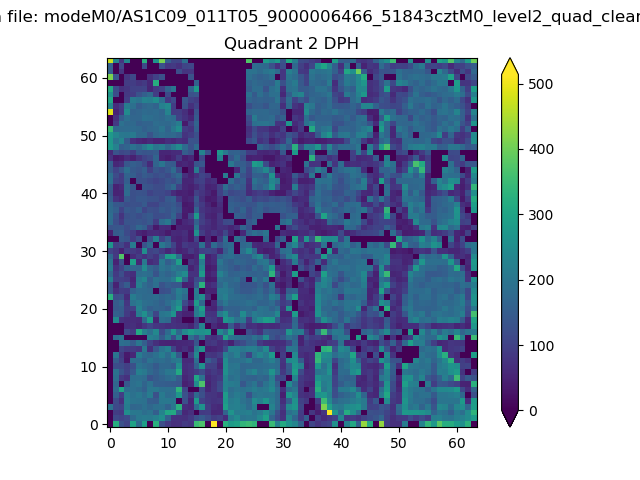
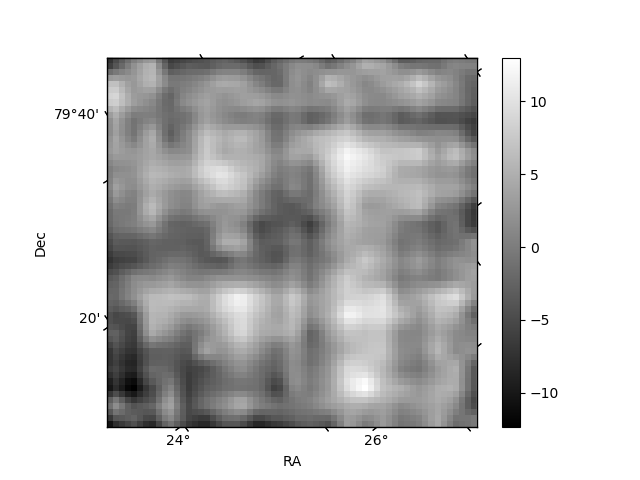
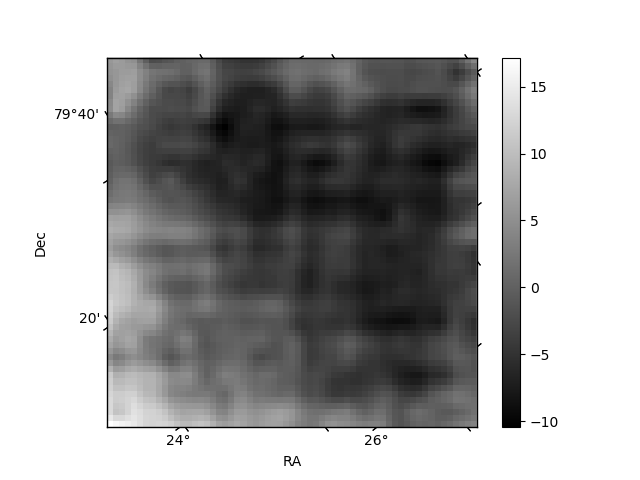
Histogram calculated using DETX and DETY for each event in the final _common_clean file
| Quadrant A | 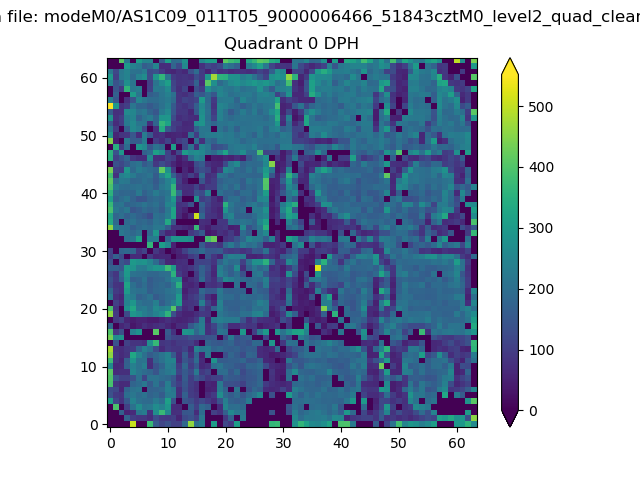 |
 |
Quadrant B |
|---|---|---|---|
| Quadrant D | 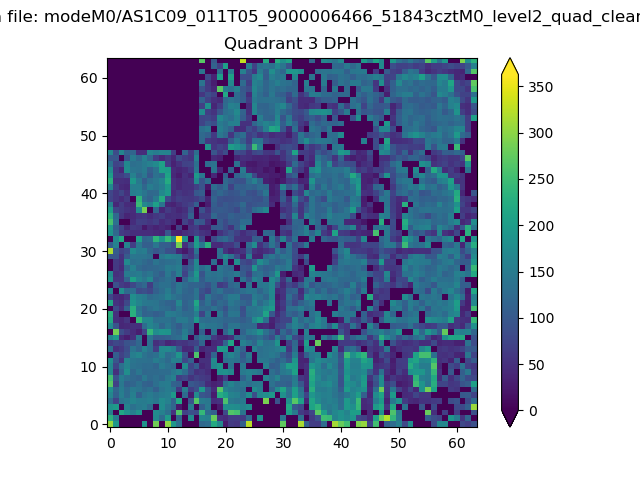 |
 |
Quadrant C |
| Plot type | Count rate plots | Images |
|---|---|---|
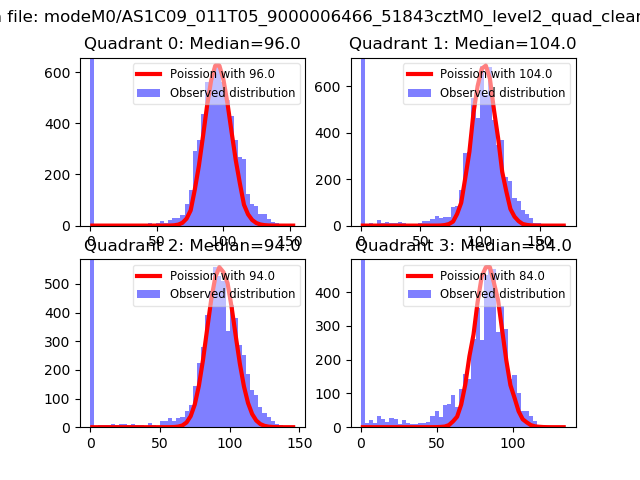
| Comparison with Poisson distribution Blue bars denote a histogram of data divided into 1 sec bins. Red curve is a Poisson curve with rate = median count rate of data. |
 |
 |
| Quadrant-wise count rates Data is divided into 100 sec bins |
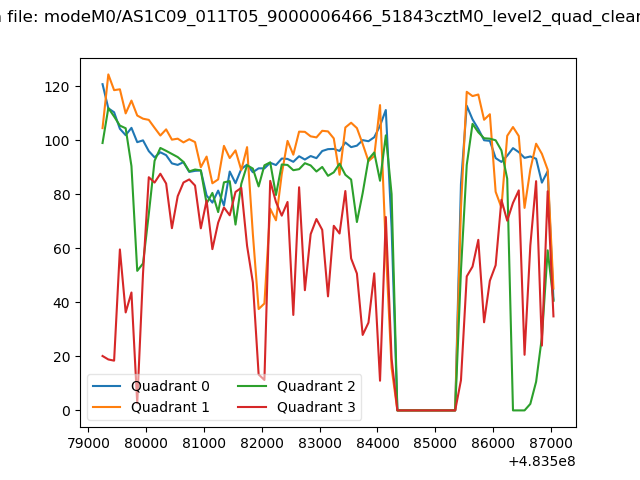 |
|
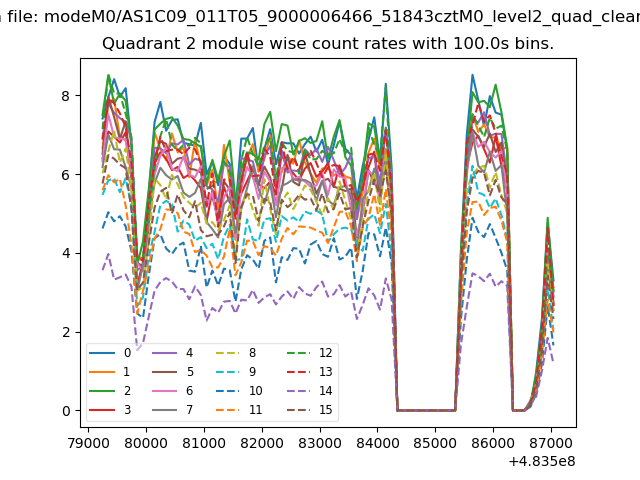
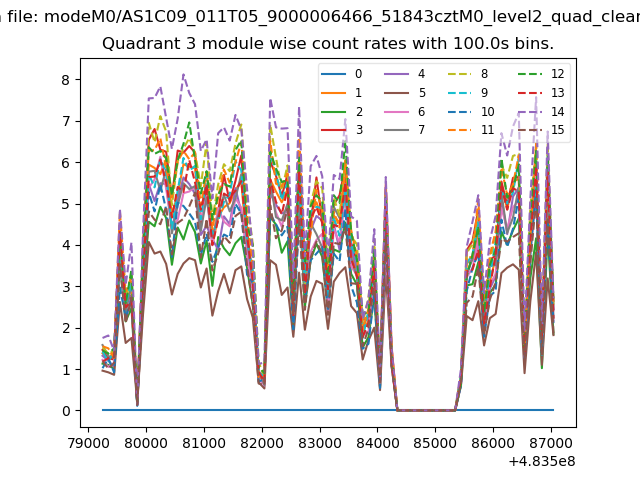
| Module-wise count rates for Quadrant A Data is divided into 100 sec bins |
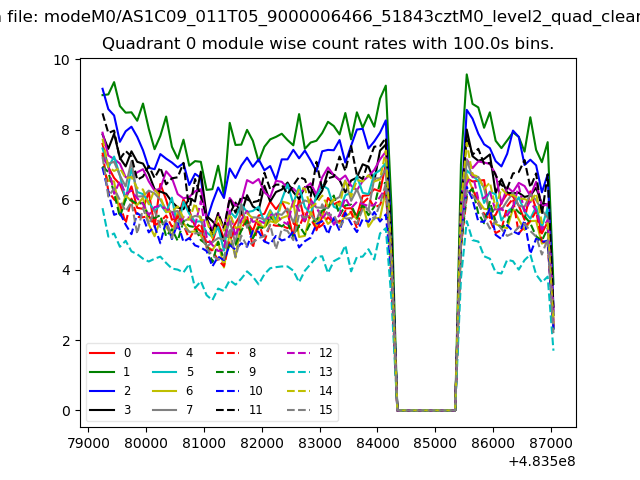 |
 |
| Module-wise count rates for Quadrant B Data is divided into 100 sec bins |
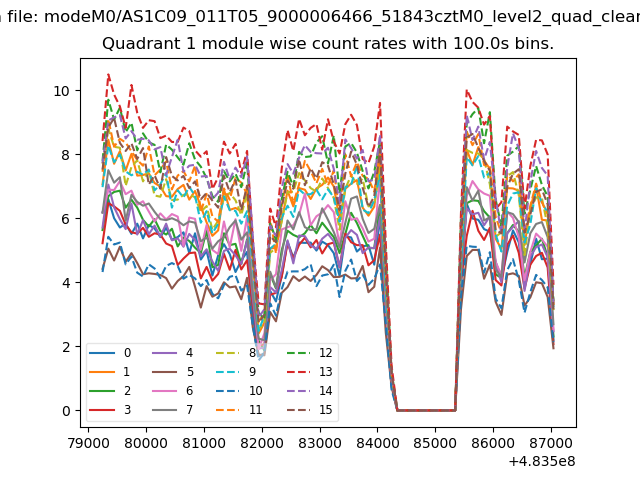 |
 |
| Module-wise count rates for Quadrant C Data is divided into 100 sec bins |
 |
 |
| Module-wise count rates for Quadrant D Data is divided into 100 sec bins |
 |
 |
| Parameter | Plot |
|---|---|
| CZT HV Monitor | 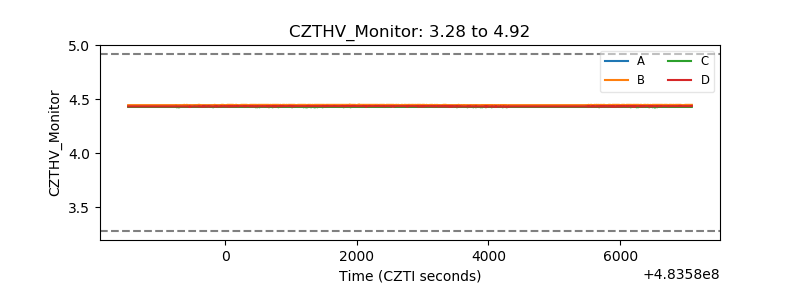 |
| D_VDD | 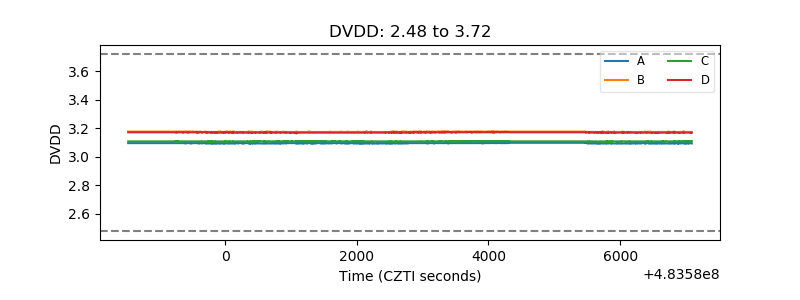 |
| Temperature 1 | 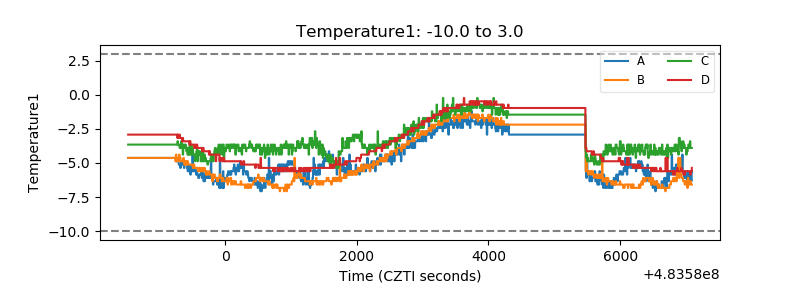 |
| Veto HV Monitor | 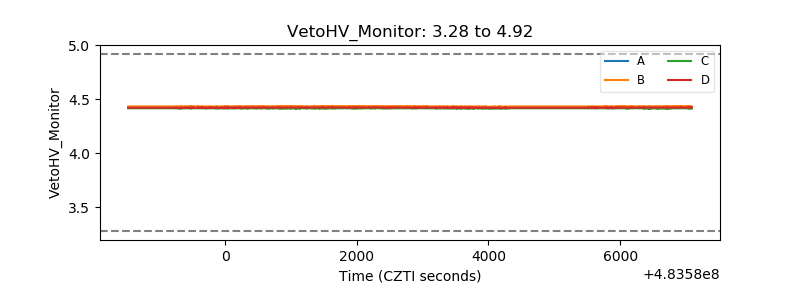 |
| Veto LLD | 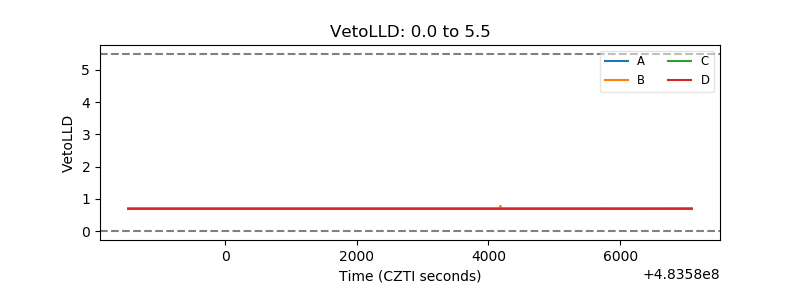 |
| Alpha Counter | 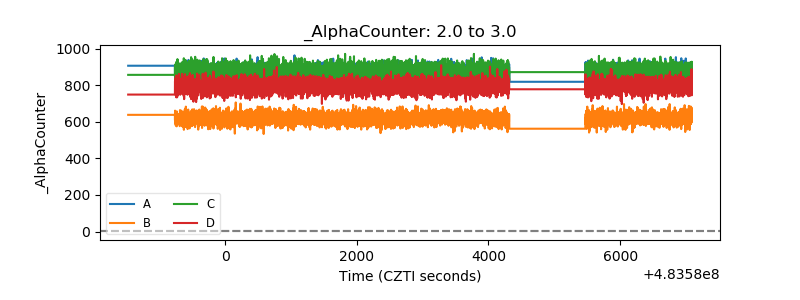 |
| _CPM_Rate | 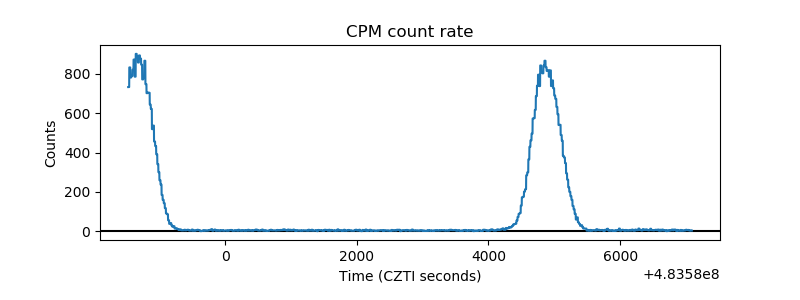 |
| CZT Counter | 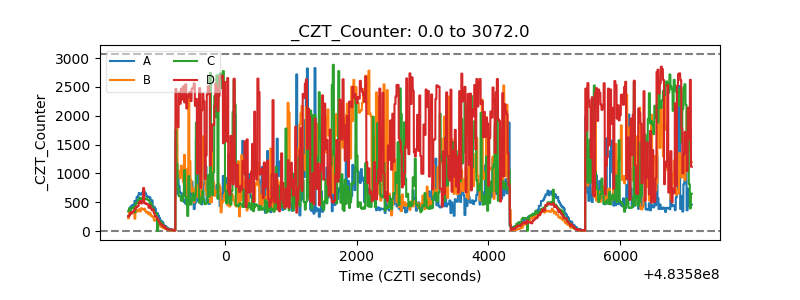 |
| +2.5 Volts monitor | 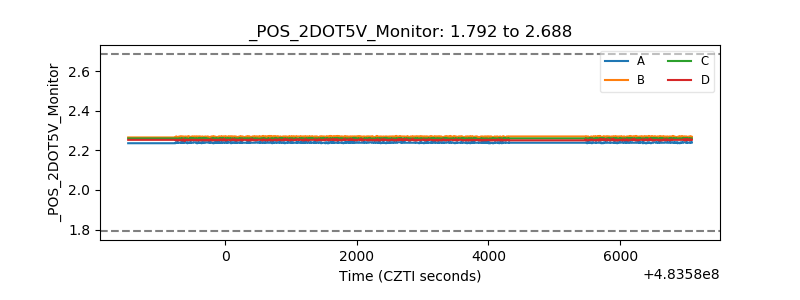 |
| +5 Volts monitor |  |
| _ROLL_ROT | 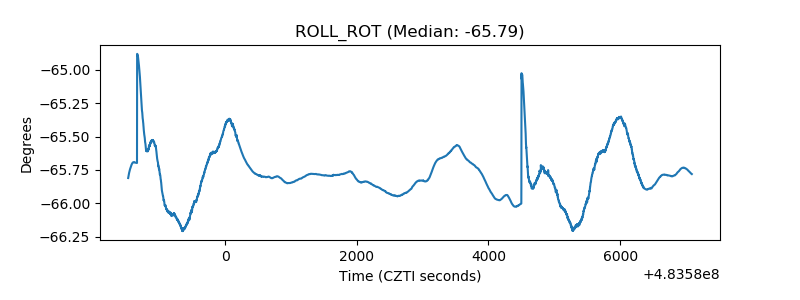 |
| _Roll_DEC | 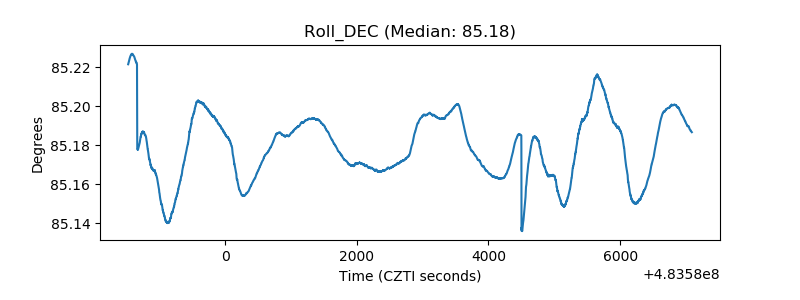 |
| _Roll_RA | 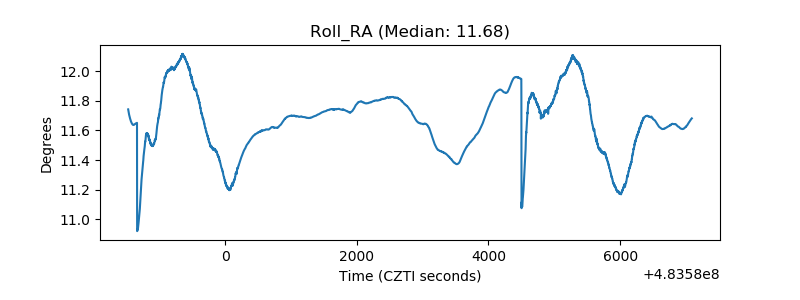 |
| Veto Counter | 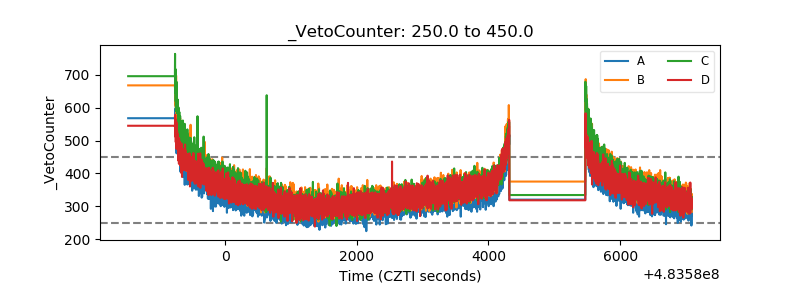 |