| Param | Original file | Final file |
|---|---|---|
| Filename | modeM0/AS1C09_011T05_9000006466_51844cztM0_level2.fits | modeM0/AS1C09_011T05_9000006466_51844cztM0_level2_quad_clean.evt |
| Size (bytes) | 662,996,160 | 74,422,080 |
| Size | 632.3 MB | 71.0 MB |
| Events in quadrant A | 4,374,731 | 512,700 |
| Events in quadrant B | 6,062,440 | 552,571 |
| Events in quadrant C | 5,113,338 | 452,633 |
| Events in quadrant D | 8,549,775 | 336,083 |
| Mode SS | |||
|---|---|---|---|
| Quadrant | BADHDUFLAG | Total packets | Discarded packets |
| A | 0 | 118 | 0 |
| B | 0 | 118 | 0 |
| C | 0 | 118 | 0 |
| D | 0 | 118 | 0 |
| Mode M0 | |||
|---|---|---|---|
| Quadrant | BADHDUFLAG | Total packets | Discarded packets |
| A | 0 | 17035 | 1 |
| B | 0 | 22021 | 1 |
| C | 0 | 19205 | 1 |
| D | 0 | 29340 | 1 |
| Mode M9 | |||
|---|---|---|---|
| Quadrant | BADHDUFLAG | Total packets | Discarded packets |
| A | 0 | 11 | 0 |
| B | 0 | 11 | 0 |
| C | 0 | 11 | 0 |
| D | 0 | 11 | 0 |
| Quadrant | Total seconds | Saturated seconds | Saturation percentage |
|---|---|---|---|
| A | 5705 | 379 | 6.643295% |
| B | 5706 | 585 | 10.252366% |
| C | 5705 | 979 | 17.160386% |
| D | 5705 | 2022 | 35.442594% |
Noise dominated data is calculated using 1-second bins in cleaned event files. If a bin has >2000 counts, and if more than 50% of those come from <1% of pixels, then it is considered to be noise-dominated and hence unusable.
| Quadrant | # 1 sec bins | Bins with >0 counts | Bins with >2000 counts | High rate bins dominated by noise | Noise dominated (total time) | Noise dominated (detector-on time) | Marked lightcurve |
|---|---|---|---|---|---|---|---|
| A | 6845 | 5706 | 330 | 330 | 4.82% | 5.78% | 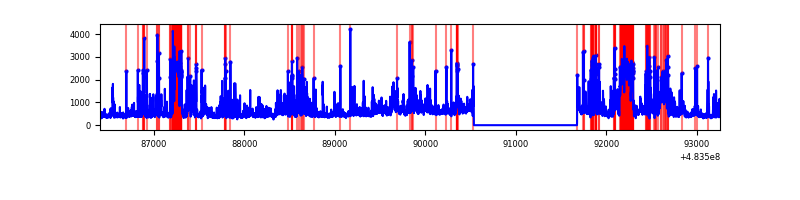 |
| B | 6846 | 5707 | 349 | 349 | 5.10% | 6.12% | 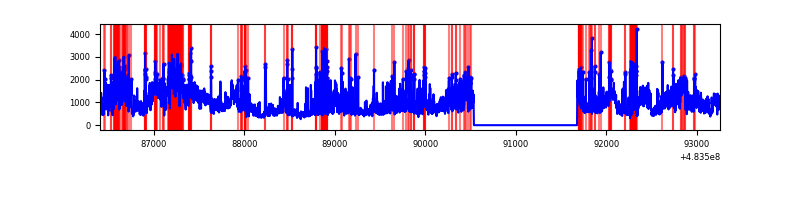 |
| C | 6845 | 5706 | 739 | 739 | 10.80% | 12.95% | 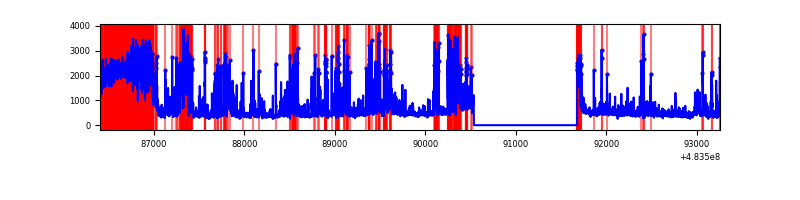 |
| D | 6845 | 5706 | 1894 | 1894 | 27.67% | 33.19% | 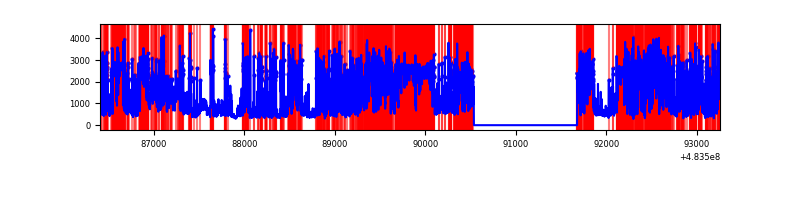 |
Top three noisy pixels from each quadrant. If the there are fewer than three noisy pixels in the level2.evt file, extra rows are filled as -1
| Pixel properties | Quadrant properties | ||||||
|---|---|---|---|---|---|---|---|
| Quadrant | DetID | PixID | Counts | Sigma | Mean | Median | Sigma |
| A | 15 | 174 | 567976 | 4001.86 | 568 | 552 | 141.8 |
| A | 12 | 3 | 463302 | 3263.63 | 568 | 552 | 141.8 |
| A | 11 | 3 | 255706 | 1799.52 | 568 | 552 | 141.8 |
| B | 10 | 254 | 1994199 | 16564.42 | 569 | 550 | 120.4 |
| B | 4 | 206 | 389878 | 3234.77 | 569 | 550 | 120.4 |
| B | 5 | 185 | 342521 | 2841.3 | 569 | 550 | 120.4 |
| C | 15 | 218 | 1553568 | 10744.78 | 519 | 514 | 144.5 |
| C | 15 | 219 | 570775 | 3945.34 | 519 | 514 | 144.5 |
| C | 14 | 80 | 304838 | 2105.46 | 519 | 514 | 144.5 |
| D | 11 | 129 | 5419123 | 42056.59 | 449 | 430 | 128.8 |
| D | 7 | 96 | 331143 | 2566.79 | 449 | 430 | 128.8 |
| D | 3 | 12 | 306628 | 2376.52 | 449 | 430 | 128.8 |
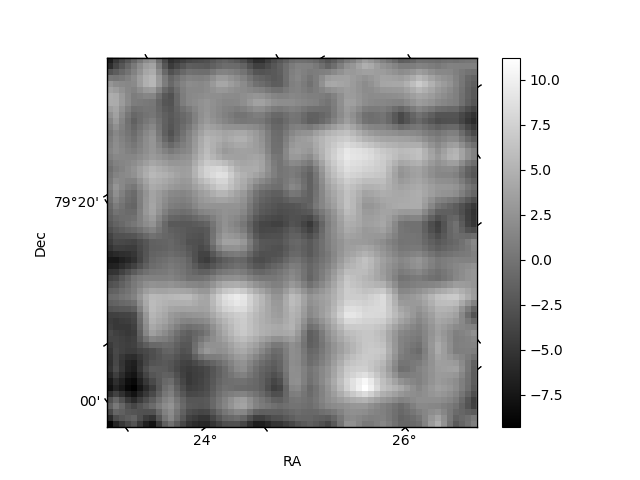
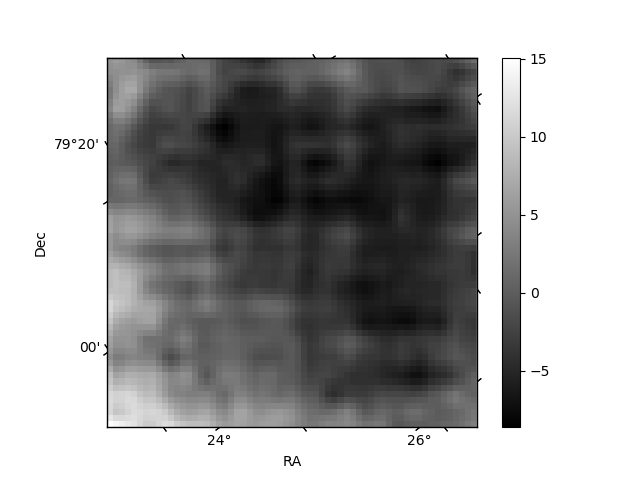
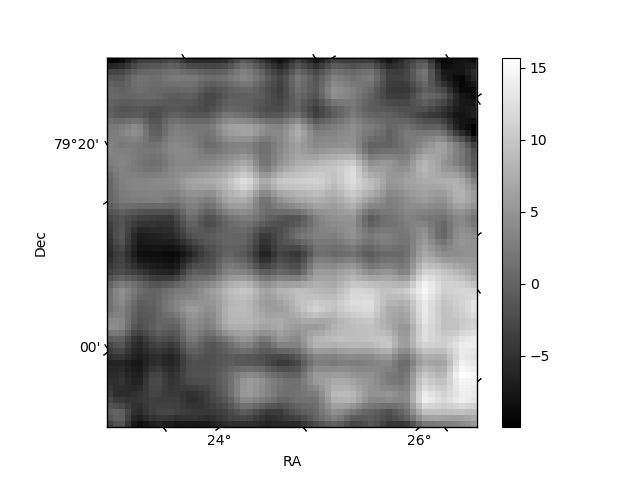
Histogram calculated using DETX and DETY for each event in the final _common_clean file
| Quadrant A | 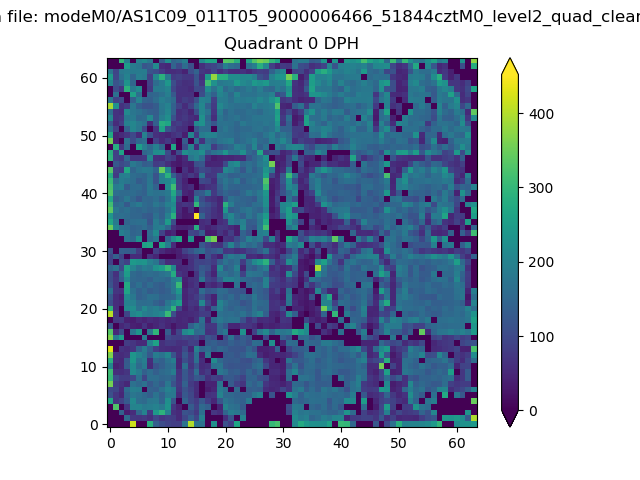 |
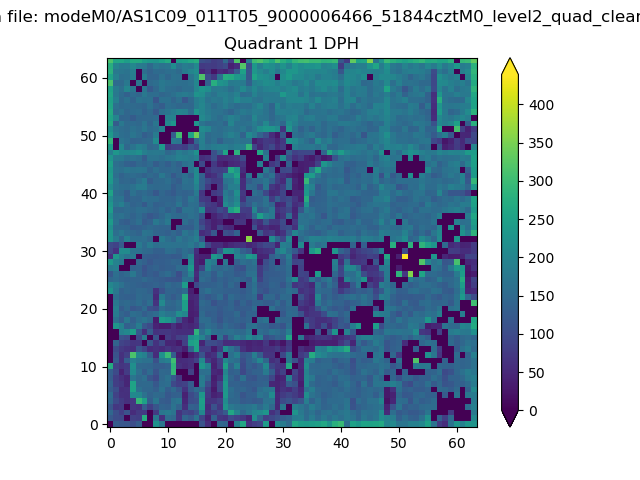 |
Quadrant B |
|---|---|---|---|
| Quadrant D | 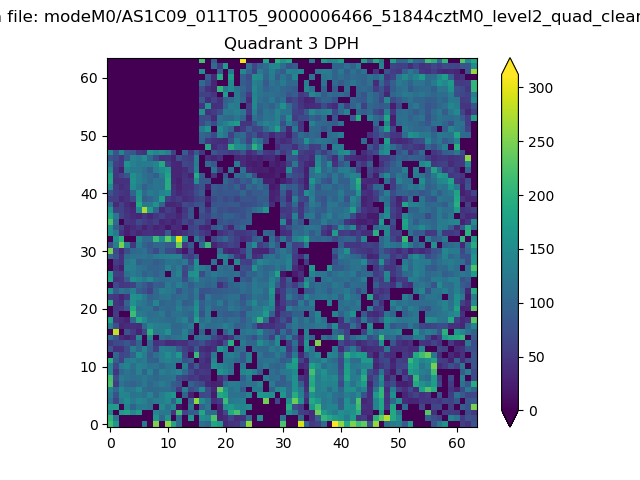 |
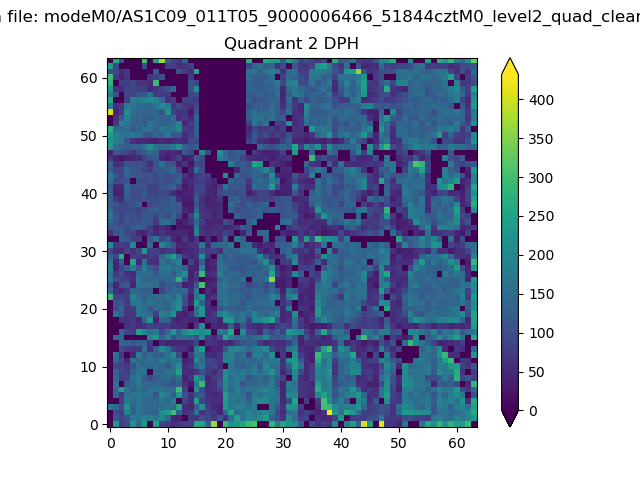 |
Quadrant C |
| Plot type | Count rate plots | Images |
|---|---|---|
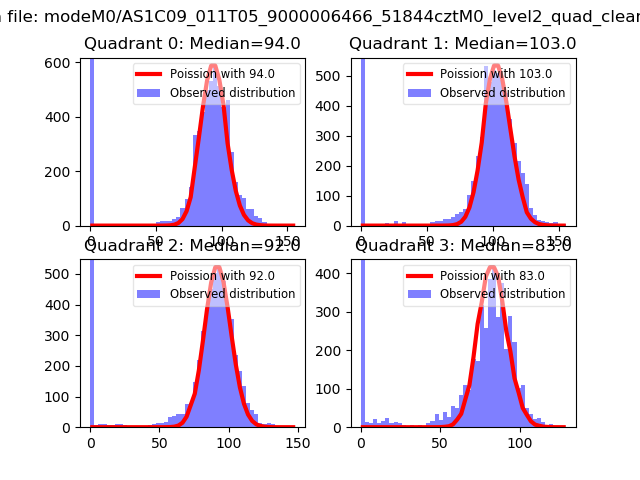
| Comparison with Poisson distribution Blue bars denote a histogram of data divided into 1 sec bins. Red curve is a Poisson curve with rate = median count rate of data. |
 |
 |
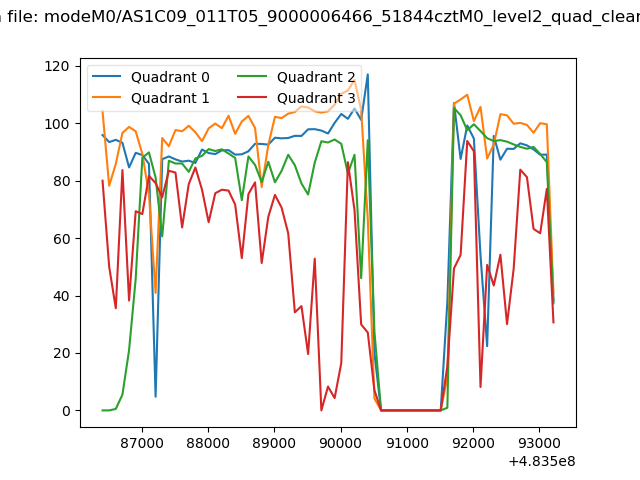
| Quadrant-wise count rates Data is divided into 100 sec bins |
 |
|
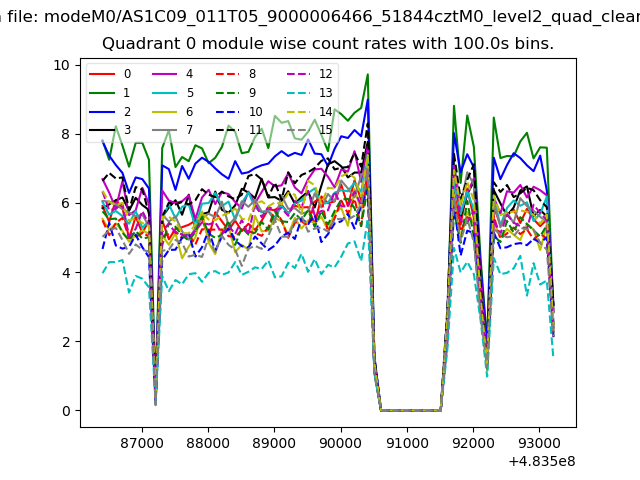
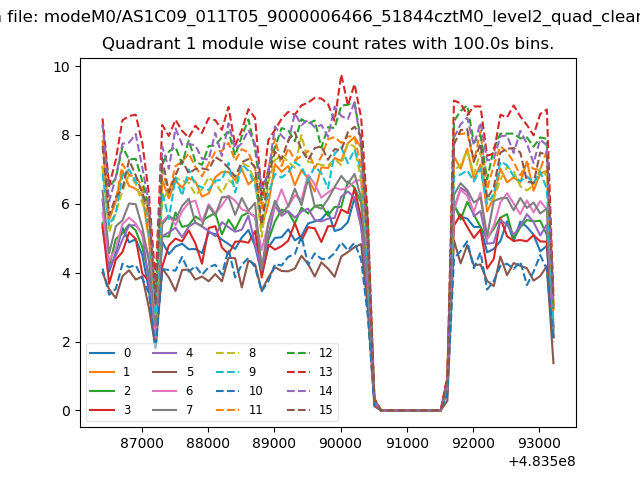
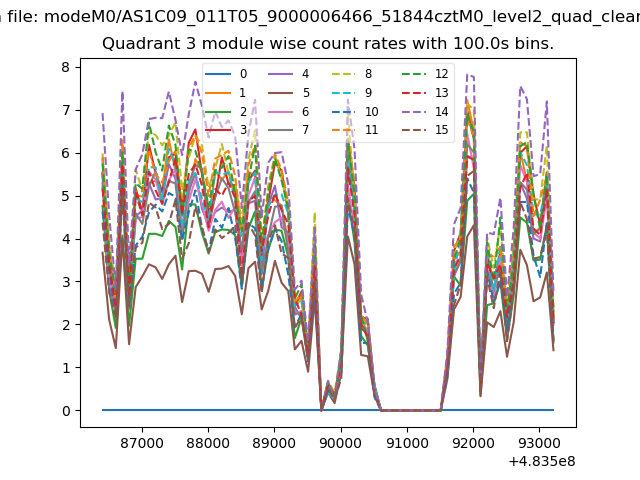
| Module-wise count rates for Quadrant A Data is divided into 100 sec bins |
 |
 |
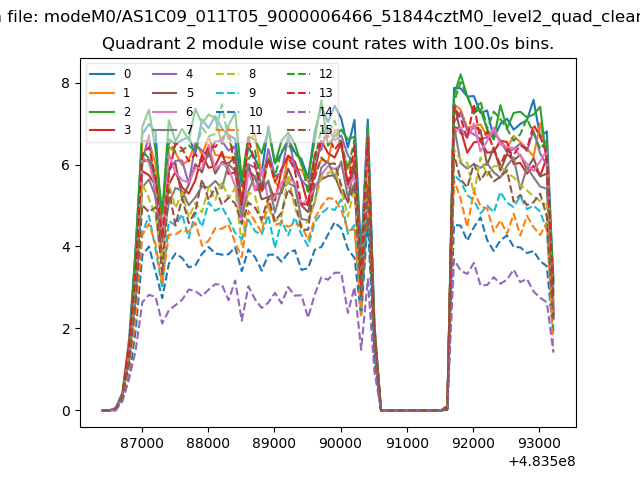
| Module-wise count rates for Quadrant B Data is divided into 100 sec bins |
 |
 |
| Module-wise count rates for Quadrant C Data is divided into 100 sec bins |
 |
 |
| Module-wise count rates for Quadrant D Data is divided into 100 sec bins |
 |
 |
| Parameter | Plot |
|---|---|
| CZT HV Monitor | 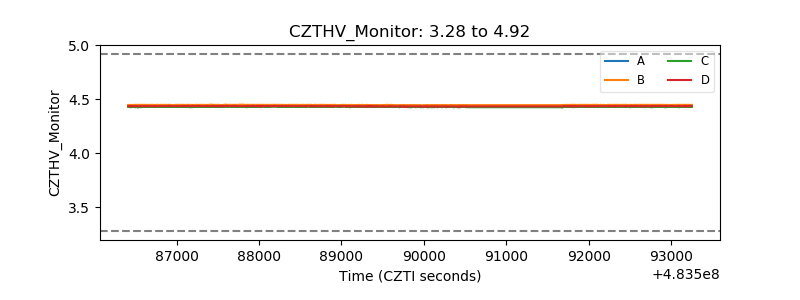 |
| D_VDD | 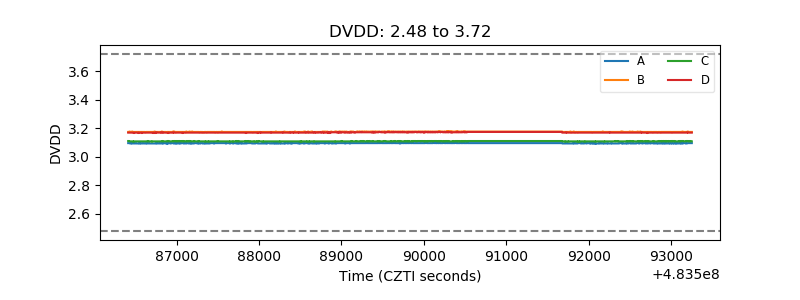 |
| Temperature 1 | 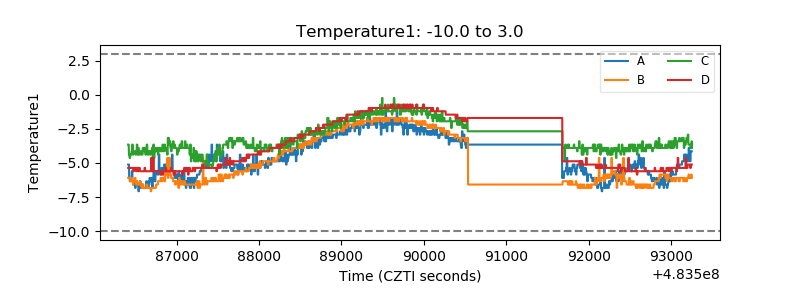 |
| Veto HV Monitor | 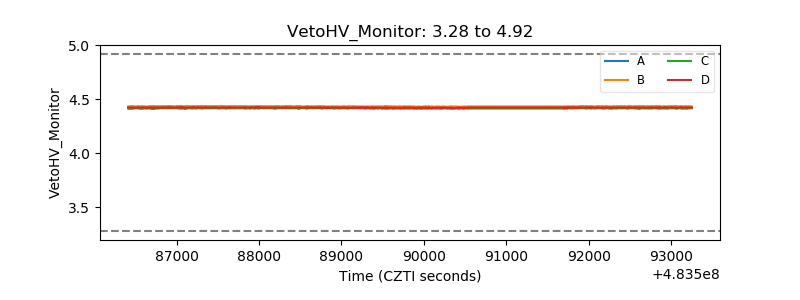 |
| Veto LLD |  |
| Alpha Counter | 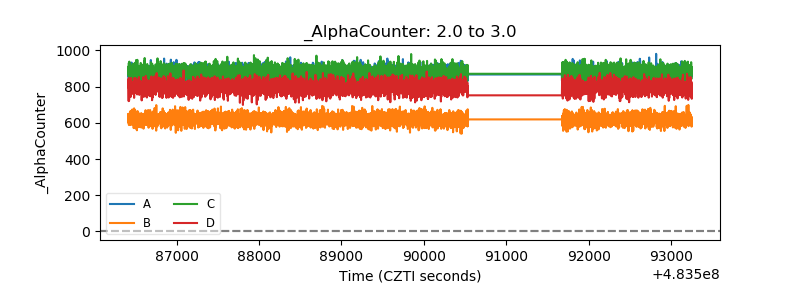 |
| _CPM_Rate | 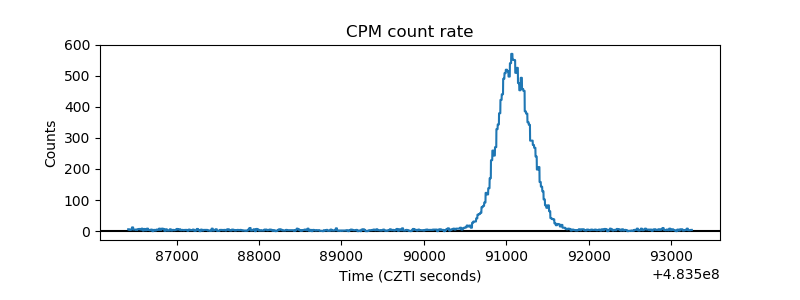 |
| CZT Counter | 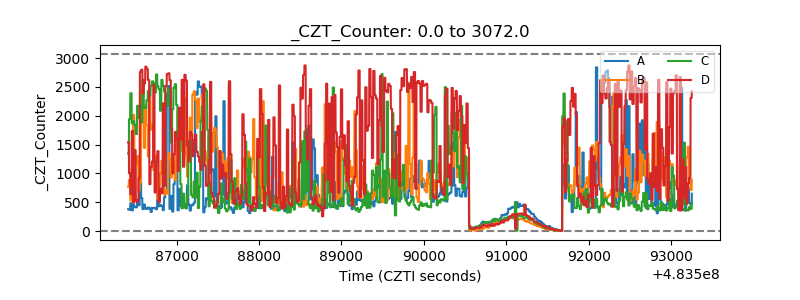 |
| +2.5 Volts monitor |  |
| +5 Volts monitor |  |
| _ROLL_ROT | 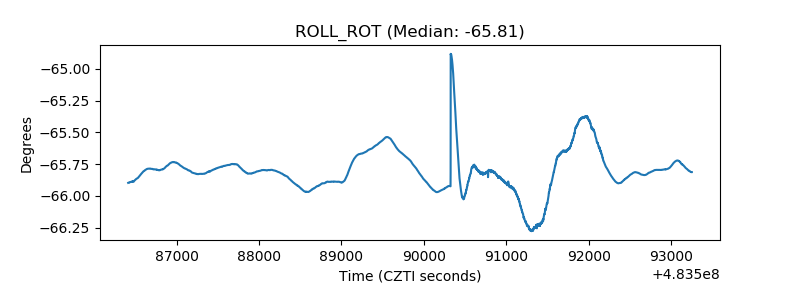 |
| _Roll_DEC | 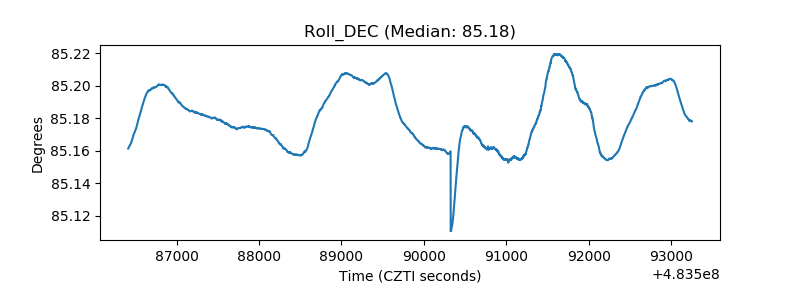 |
| _Roll_RA | 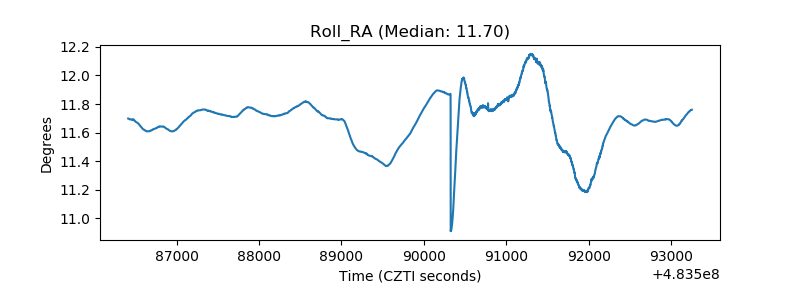 |
| Veto Counter | 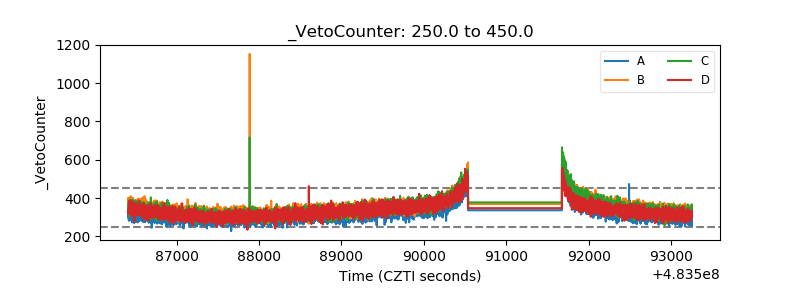 |