| Param | Original file | Final file |
|---|---|---|
| Filename | modeM0/AS1C09_011T05_9000006466_51847cztM0_level2.fits | modeM0/AS1C09_011T05_9000006466_51847cztM0_level2_quad_clean.evt |
| Size (bytes) | 2,086,133,760 | 212,019,840 |
| Size | 1.9 GB | 202.2 MB |
| Events in quadrant A | 11,654,113 | 1,545,687 |
| Events in quadrant B | 14,181,960 | 1,668,639 |
| Events in quadrant C | 15,777,559 | 1,403,008 |
| Events in quadrant D | 34,263,105 | 598,355 |
| Mode SS | |||
|---|---|---|---|
| Quadrant | BADHDUFLAG | Total packets | Discarded packets |
| A | 0 | 352 | 0 |
| B | 0 | 352 | 0 |
| C | 0 | 352 | 0 |
| D | 0 | 352 | 2 |
| Mode M0 | |||
|---|---|---|---|
| Quadrant | BADHDUFLAG | Total packets | Discarded packets |
| A | 0 | 47098 | 30 |
| B | 0 | 54453 | 89 |
| C | 0 | 59354 | 30 |
| D | 0 | 113917 | 125 |
| Mode M9 | |||
|---|---|---|---|
| Quadrant | BADHDUFLAG | Total packets | Discarded packets |
| A | 0 | 19 | 0 |
| B | 0 | 19 | 0 |
| C | 0 | 19 | 0 |
| D | 0 | 19 | 0 |
| Quadrant | Total seconds | Saturated seconds | Saturation percentage |
|---|---|---|---|
| A | 17451 | 851 | 4.876511% |
| B | 17444 | 1355 | 7.767714% |
| C | 17452 | 2050 | 11.746505% |
| D | 17444 | 10842 | 62.153176% |
Noise dominated data is calculated using 1-second bins in cleaned event files. If a bin has >2000 counts, and if more than 50% of those come from <1% of pixels, then it is considered to be noise-dominated and hence unusable.
| Quadrant | # 1 sec bins | Bins with >0 counts | Bins with >2000 counts | High rate bins dominated by noise | Noise dominated (total time) | Noise dominated (detector-on time) | Marked lightcurve |
|---|---|---|---|---|---|---|---|
| A | 19257 | 17460 | 400 | 400 | 2.08% | 2.29% | 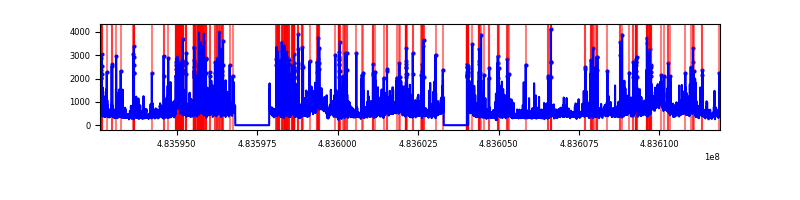 |
| B | 19258 | 17457 | 737 | 737 | 3.83% | 4.22% | 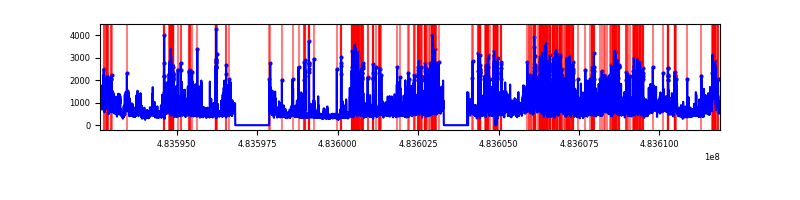 |
| C | 19258 | 17459 | 1750 | 1750 | 9.09% | 10.02% | 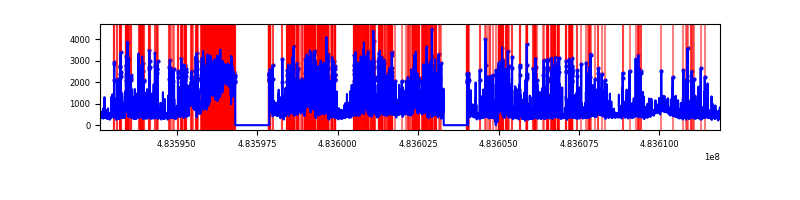 |
| D | 19258 | 17446 | 9834 | 9834 | 51.06% | 56.37% | 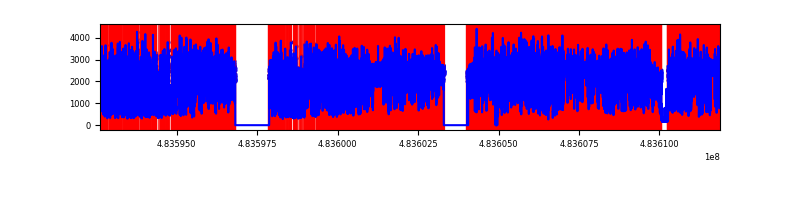 |
Top three noisy pixels from each quadrant. If the there are fewer than three noisy pixels in the level2.evt file, extra rows are filled as -1
| Pixel properties | Quadrant properties | ||||||
|---|---|---|---|---|---|---|---|
| Quadrant | DetID | PixID | Counts | Sigma | Mean | Median | Sigma |
| A | 12 | 3 | 1222572 | 2719.94 | 1816 | 1769 | 448.8 |
| A | 11 | 3 | 875322 | 1946.27 | 1816 | 1769 | 448.8 |
| A | 15 | 174 | 643371 | 1429.49 | 1816 | 1769 | 448.8 |
| B | 10 | 254 | 1450119 | 3864.88 | 1785 | 1719 | 374.8 |
| B | 5 | 32 | 1349452 | 3596.27 | 1785 | 1719 | 374.8 |
| B | 10 | 41 | 1149840 | 3063.63 | 1785 | 1719 | 374.8 |
| C | 5 | 250 | 2055078 | 4460.91 | 1683 | 1670 | 460.3 |
| C | 15 | 248 | 1588033 | 3446.28 | 1683 | 1670 | 460.3 |
| C | 15 | 219 | 1135014 | 2462.12 | 1683 | 1670 | 460.3 |
| D | 11 | 129 | 26056606 | 86692.17 | 1079 | 1040 | 300.6 |
| D | 3 | 12 | 798173 | 2652.22 | 1079 | 1040 | 300.6 |
| D | 8 | 48 | 747664 | 2484.17 | 1079 | 1040 | 300.6 |
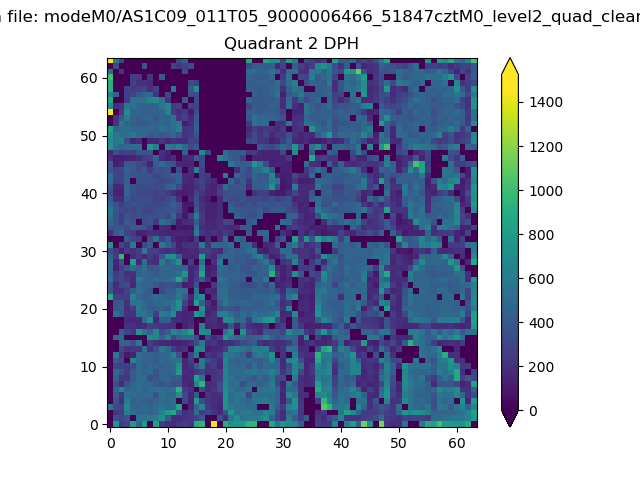
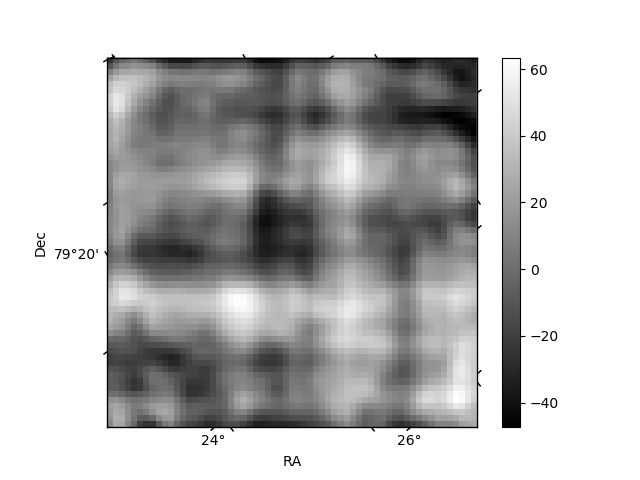
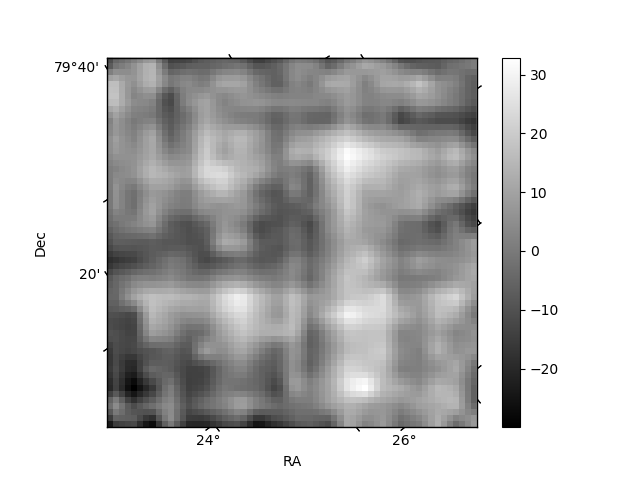
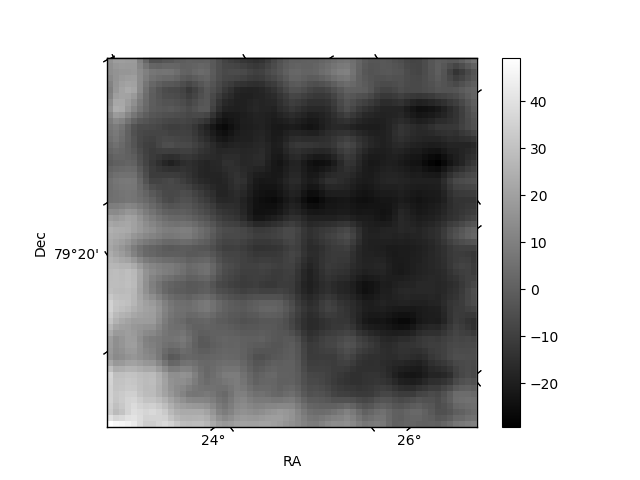
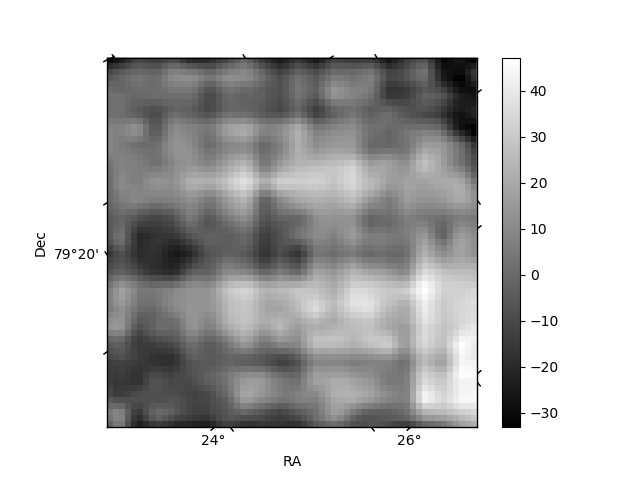
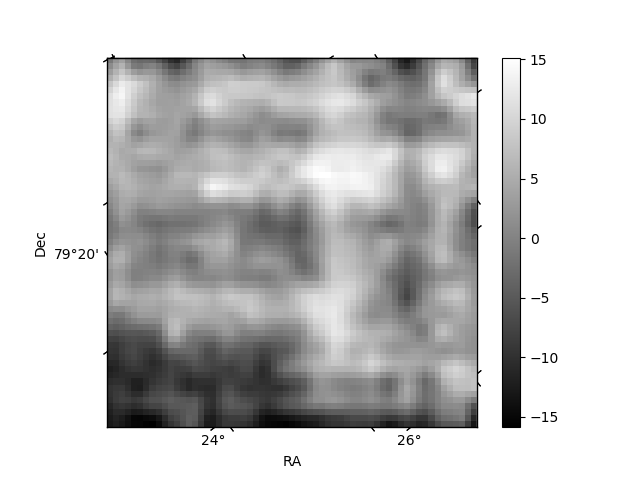
Histogram calculated using DETX and DETY for each event in the final _common_clean file
| Quadrant A | 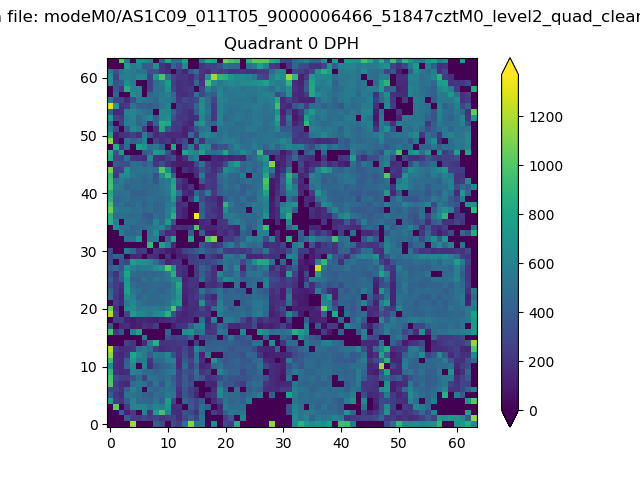 |
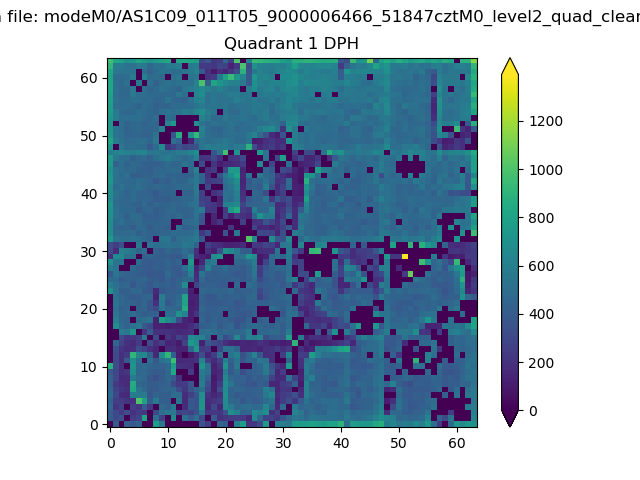 |
Quadrant B |
|---|---|---|---|
| Quadrant D | 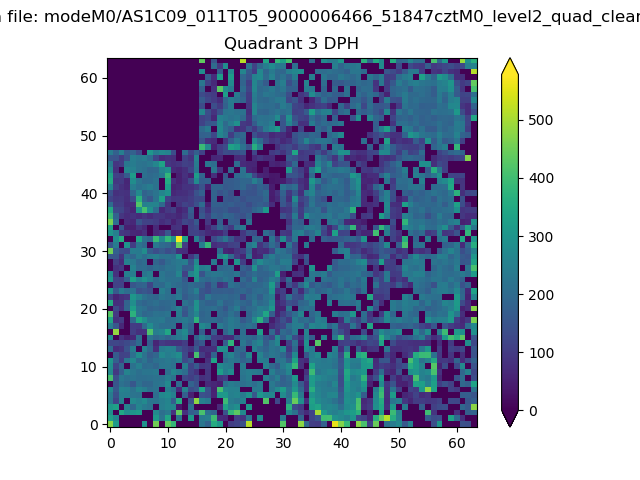 |
 |
Quadrant C |
| Plot type | Count rate plots | Images |
|---|---|---|
| Comparison with Poisson distribution Blue bars denote a histogram of data divided into 1 sec bins. Red curve is a Poisson curve with rate = median count rate of data. |
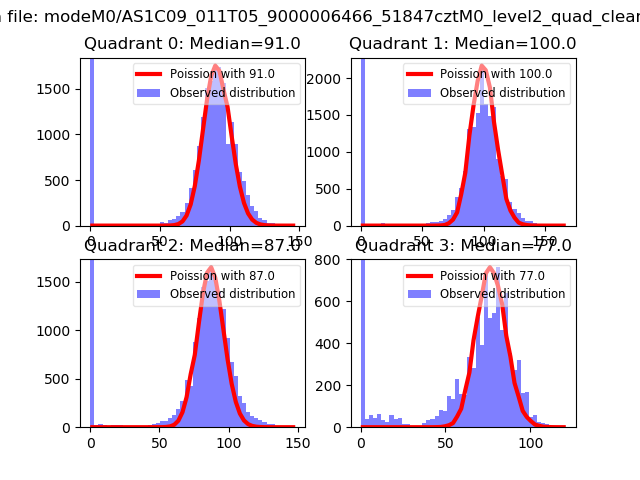 |
 |
| Quadrant-wise count rates Data is divided into 100 sec bins |
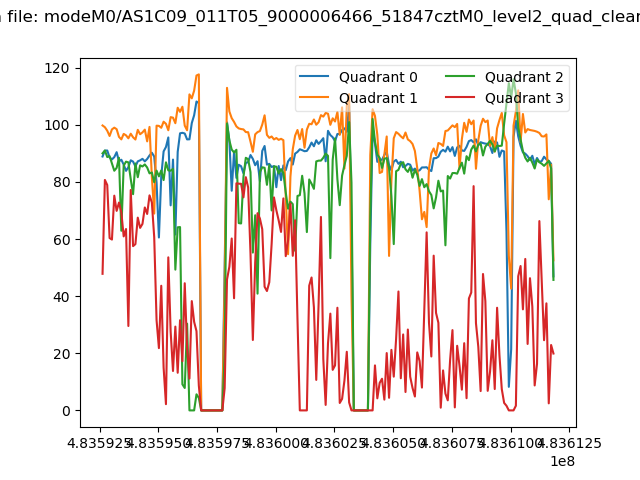 |
|
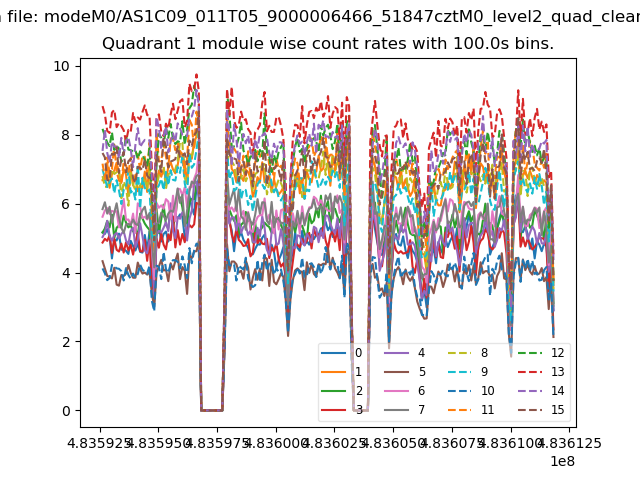
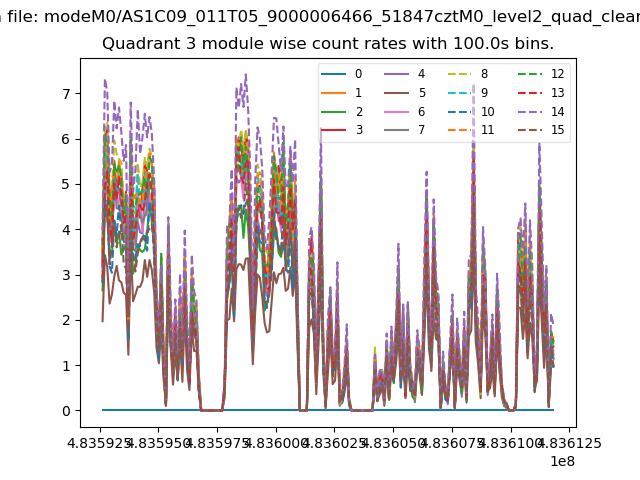
| Module-wise count rates for Quadrant A Data is divided into 100 sec bins |
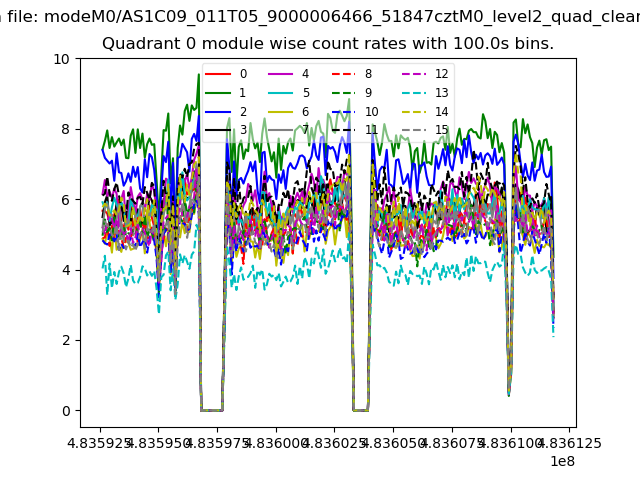 |
 |
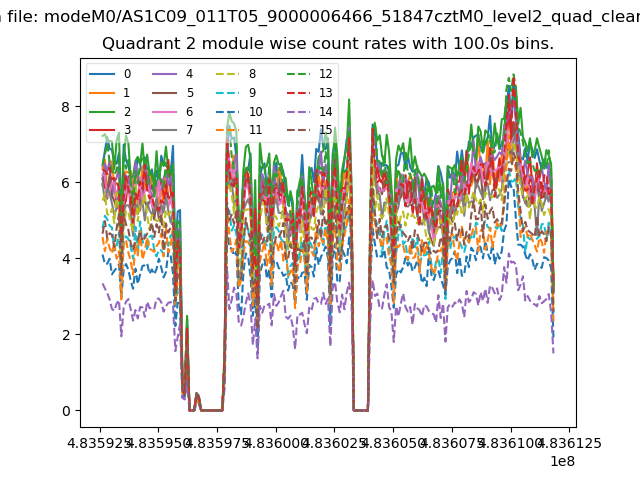
| Module-wise count rates for Quadrant B Data is divided into 100 sec bins |
 |
 |
| Module-wise count rates for Quadrant C Data is divided into 100 sec bins |
 |
 |
| Module-wise count rates for Quadrant D Data is divided into 100 sec bins |
 |
 |
| Parameter | Plot |
|---|---|
| CZT HV Monitor | 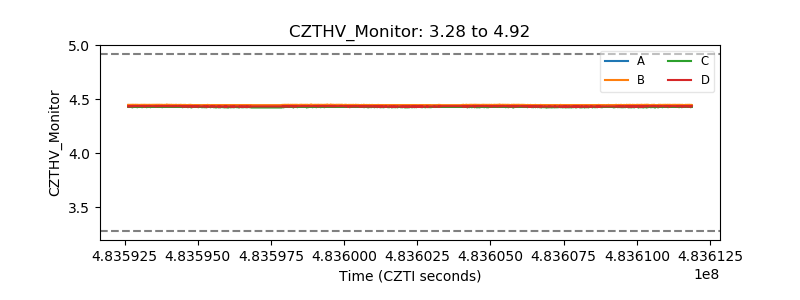 |
| D_VDD | 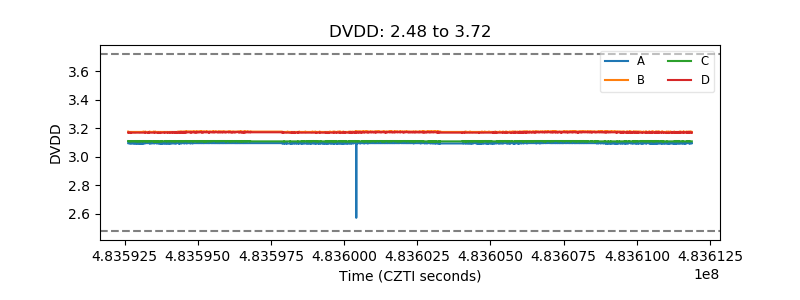 |
| Temperature 1 | 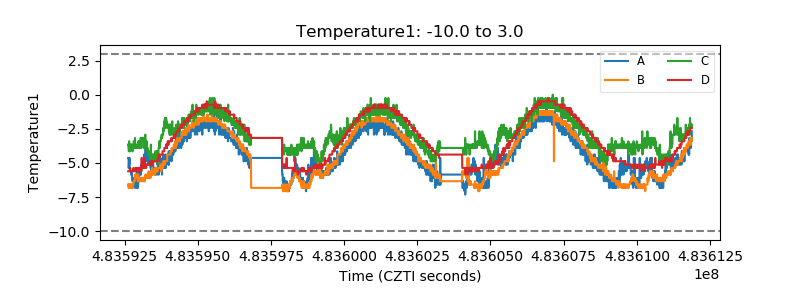 |
| Veto HV Monitor | 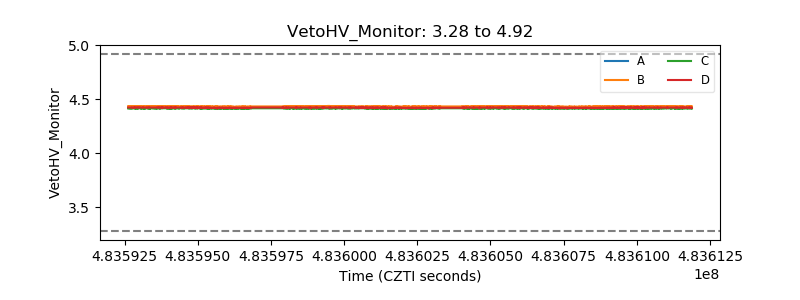 |
| Veto LLD | 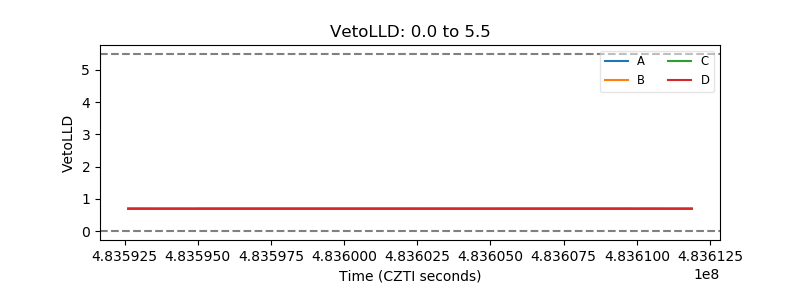 |
| Alpha Counter | 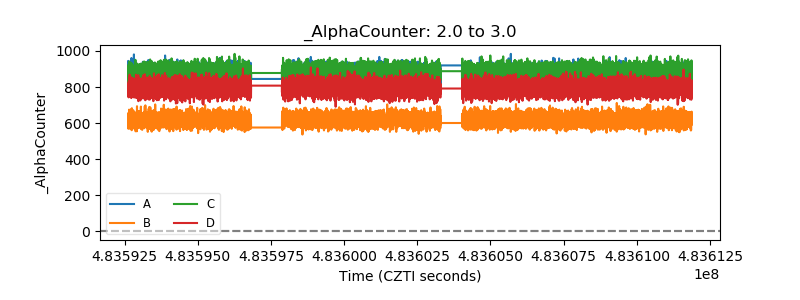 |
| _CPM_Rate | 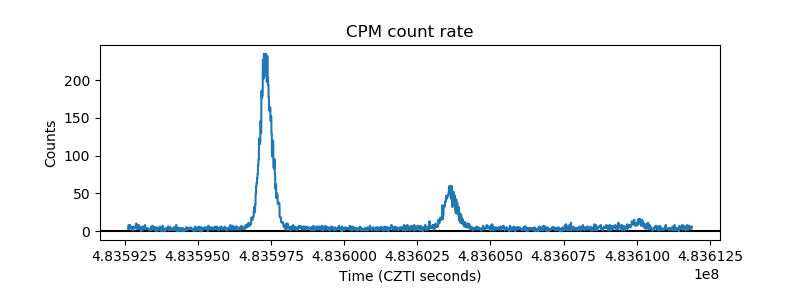 |
| CZT Counter | 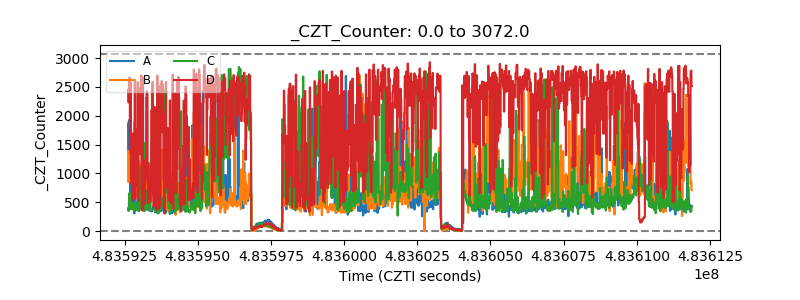 |
| +2.5 Volts monitor | 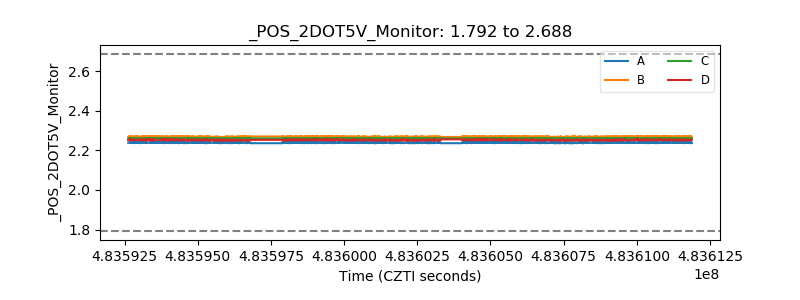 |
| +5 Volts monitor | 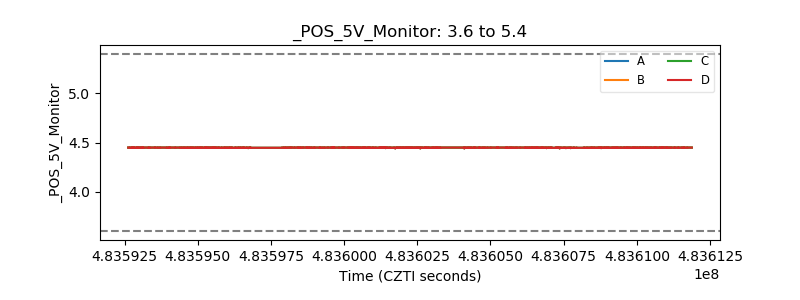 |
| _ROLL_ROT | 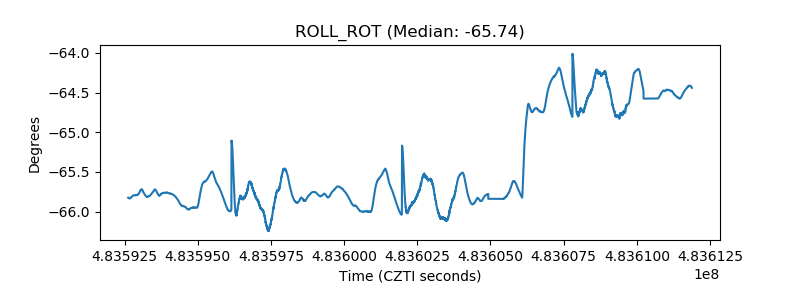 |
| _Roll_DEC | 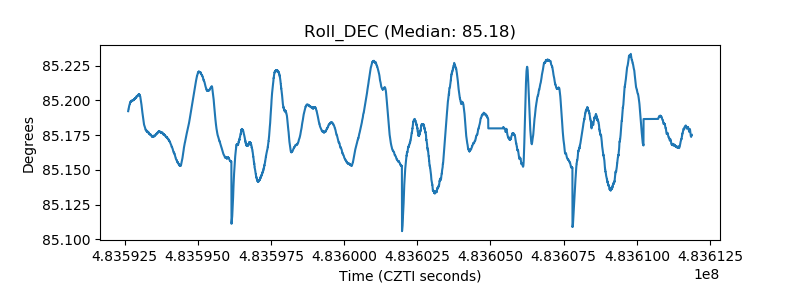 |
| _Roll_RA | 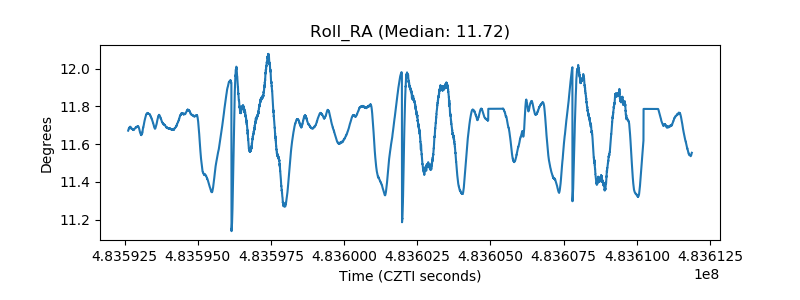 |
| Veto Counter | 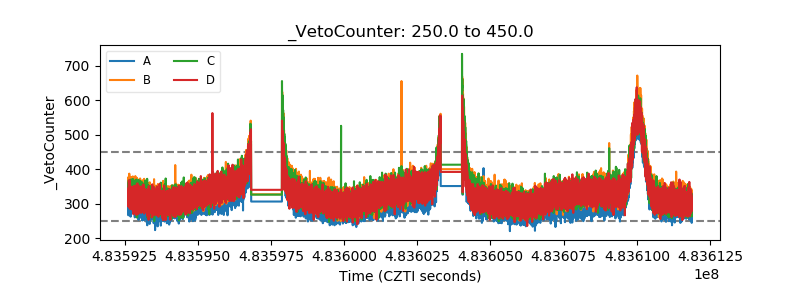 |