| Param | Original file | Final file |
|---|---|---|
| Filename | modeM0/AS1C09_011T05_9000006466_51848cztM0_level2.fits | modeM0/AS1C09_011T05_9000006466_51848cztM0_level2_quad_clean.evt |
| Size (bytes) | 985,970,880 | 83,390,400 |
| Size | 940.3 MB | 79.5 MB |
| Events in quadrant A | 4,257,033 | 676,768 |
| Events in quadrant B | 6,890,932 | 685,438 |
| Events in quadrant C | 6,163,590 | 586,420 |
| Events in quadrant D | 18,611,389 | 59,476 |
| Mode SS | |||
|---|---|---|---|
| Quadrant | BADHDUFLAG | Total packets | Discarded packets |
| A | 0 | 148 | 0 |
| B | 0 | 148 | 0 |
| C | 0 | 148 | 0 |
| D | 0 | 150 | 0 |
| Mode M0 | |||
|---|---|---|---|
| Quadrant | BADHDUFLAG | Total packets | Discarded packets |
| A | 0 | 17763 | 14 |
| B | 0 | 25633 | 24 |
| C | 0 | 23567 | 34 |
| D | 0 | 60492 | 142 |
| Quadrant | Total seconds | Saturated seconds | Saturation percentage |
|---|---|---|---|
| A | 7428 | 117 | 1.575121% |
| B | 7422 | 733 | 9.876044% |
| C | 7419 | 873 | 11.767085% |
| D | 7413 | 6798 | 91.703764% |
Noise dominated data is calculated using 1-second bins in cleaned event files. If a bin has >2000 counts, and if more than 50% of those come from <1% of pixels, then it is considered to be noise-dominated and hence unusable.
| Quadrant | # 1 sec bins | Bins with >0 counts | Bins with >2000 counts | High rate bins dominated by noise | Noise dominated (total time) | Noise dominated (detector-on time) | Marked lightcurve |
|---|---|---|---|---|---|---|---|
| A | 7432 | 7431 | 102 | 102 | 1.37% | 1.37% |  |
| B | 7432 | 7428 | 578 | 578 | 7.78% | 7.78% |  |
| C | 7431 | 7425 | 793 | 793 | 10.67% | 10.68% | 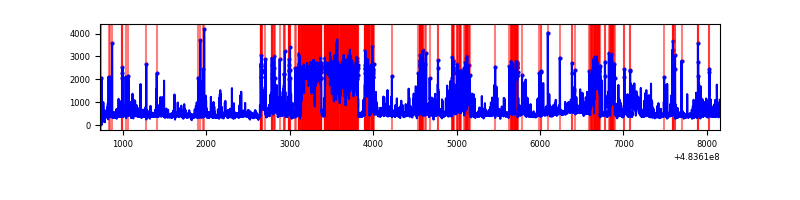 |
| D | 7429 | 7416 | 6673 | 6673 | 89.82% | 89.98% | 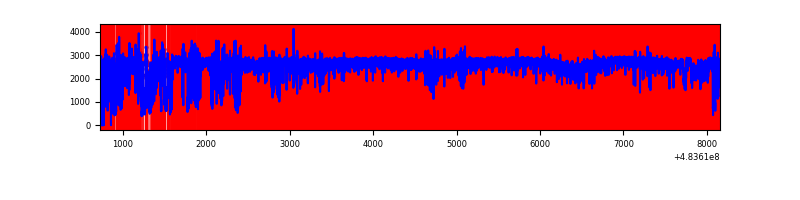 |
Top three noisy pixels from each quadrant. If the there are fewer than three noisy pixels in the level2.evt file, extra rows are filled as -1
| Pixel properties | Quadrant properties | ||||||
|---|---|---|---|---|---|---|---|
| Quadrant | DetID | PixID | Counts | Sigma | Mean | Median | Sigma |
| A | 8 | 246 | 192557 | 1012.39 | 765 | 746 | 189.5 |
| A | 5 | 240 | 190643 | 1002.29 | 765 | 746 | 189.5 |
| A | 12 | 3 | 171886 | 903.29 | 765 | 746 | 189.5 |
| B | 1 | 255 | 790583 | 4989.32 | 734 | 710 | 158.3 |
| B | 5 | 32 | 566805 | 3575.8 | 734 | 710 | 158.3 |
| B | 1 | 207 | 544057 | 3432.11 | 734 | 710 | 158.3 |
| C | 0 | 193 | 1277990 | 6600.37 | 699 | 691 | 193.5 |
| C | 10 | 19 | 358147 | 1847.13 | 699 | 691 | 193.5 |
| C | 15 | 230 | 313084 | 1614.27 | 699 | 691 | 193.5 |
| D | 11 | 129 | 16309914 | 187214.26 | 298 | 286 | 87.1 |
| D | 3 | 12 | 482589 | 5536.24 | 298 | 286 | 87.1 |
| D | 0 | 18 | 144655 | 1657.18 | 298 | 286 | 87.1 |
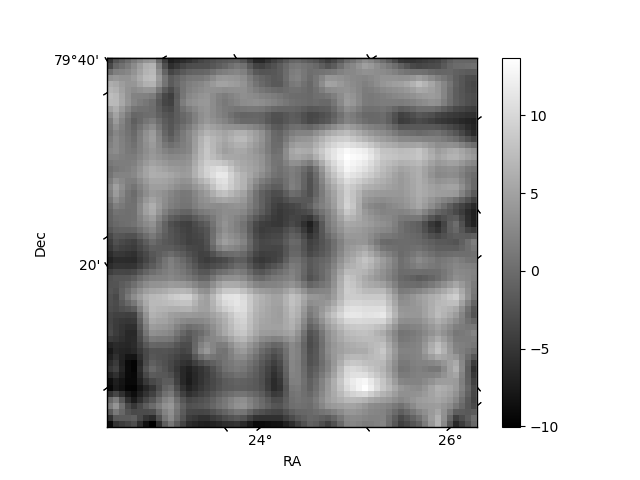
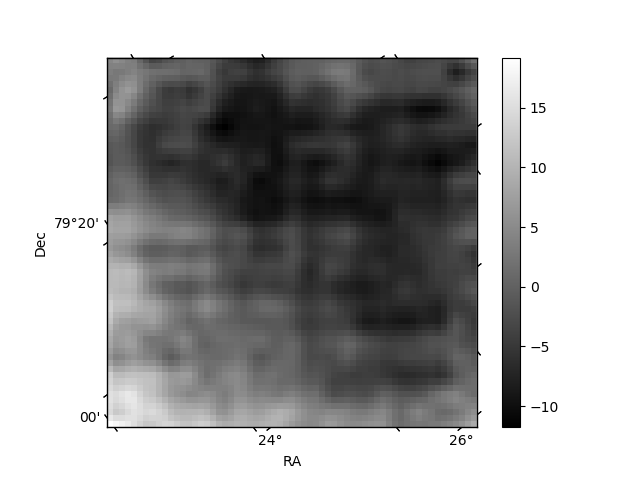
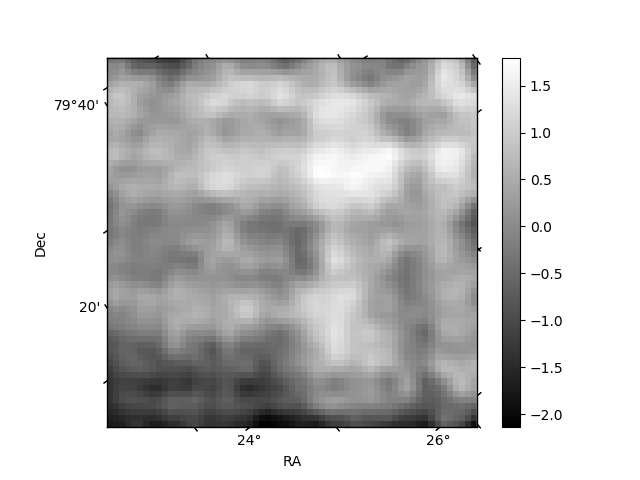
Histogram calculated using DETX and DETY for each event in the final _common_clean file
| Quadrant A | 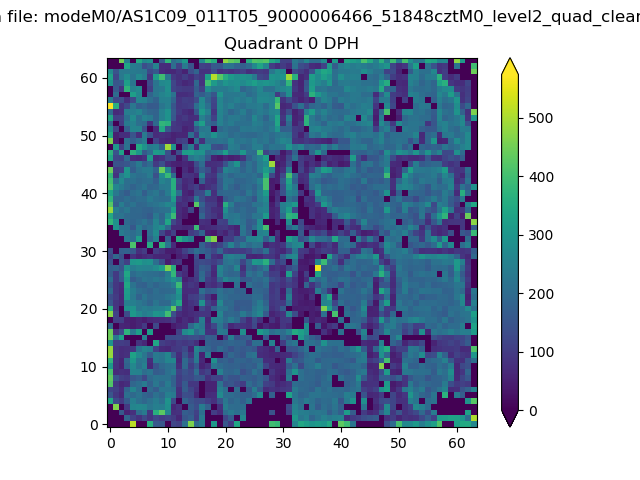 |
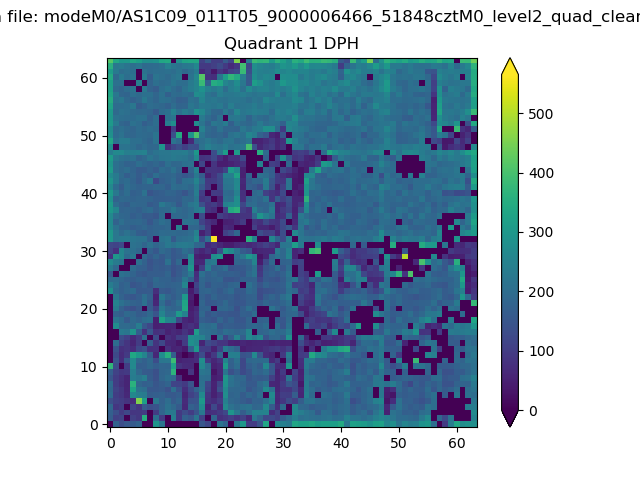 |
Quadrant B |
|---|---|---|---|
| Quadrant D | 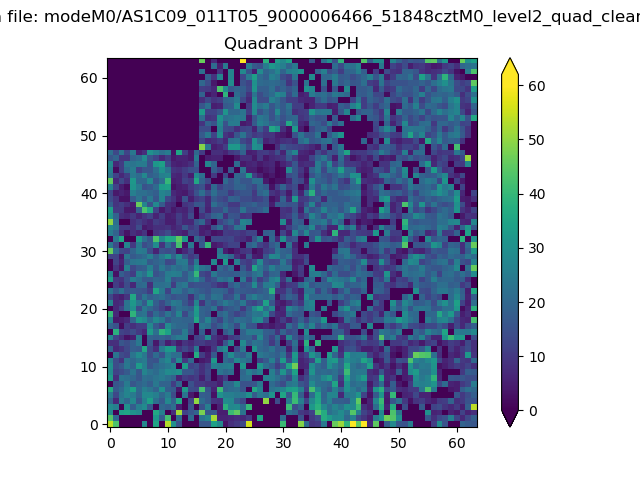 |
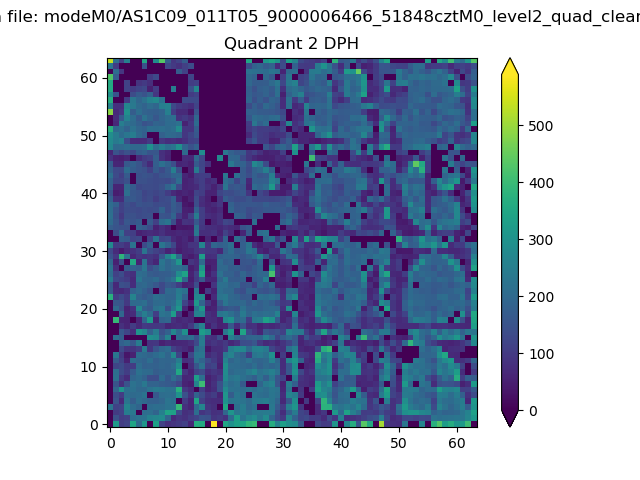 |
Quadrant C |
| Plot type | Count rate plots | Images |
|---|---|---|
| Comparison with Poisson distribution Blue bars denote a histogram of data divided into 1 sec bins. Red curve is a Poisson curve with rate = median count rate of data. |
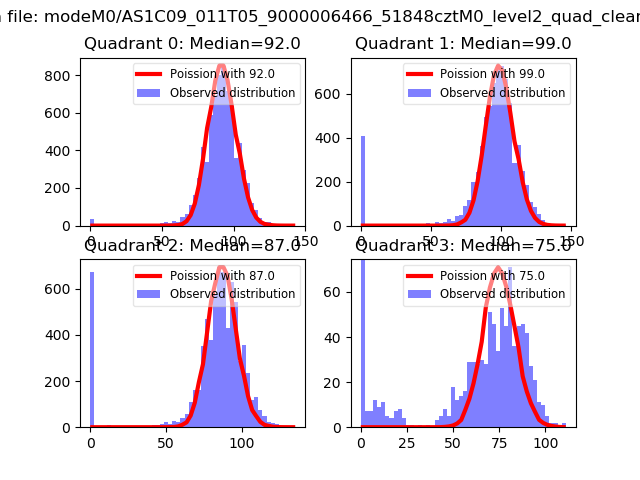 |
 |
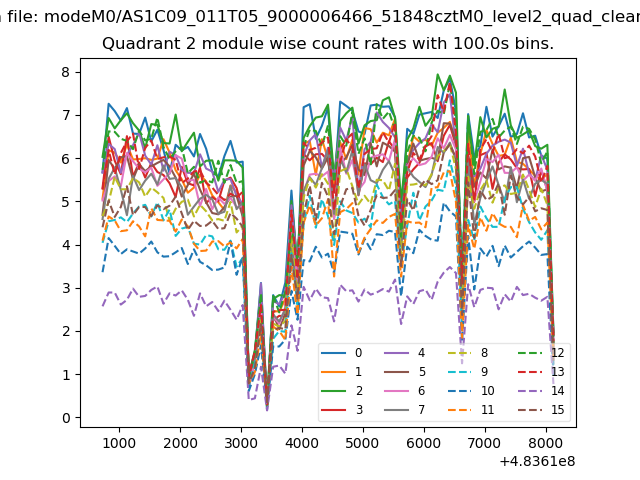
| Quadrant-wise count rates Data is divided into 100 sec bins |
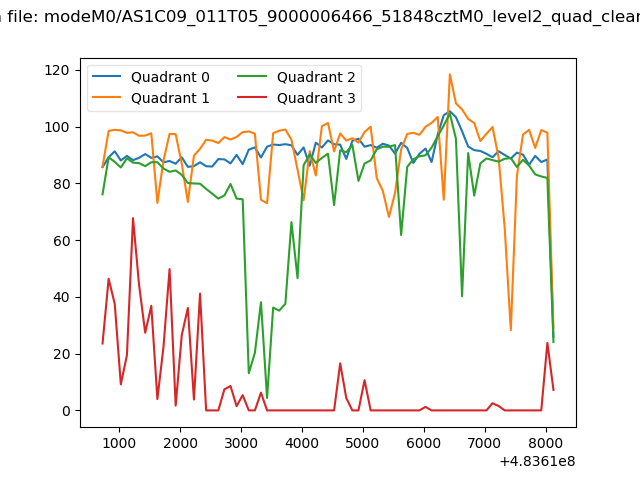 |
|
| Module-wise count rates for Quadrant A Data is divided into 100 sec bins |
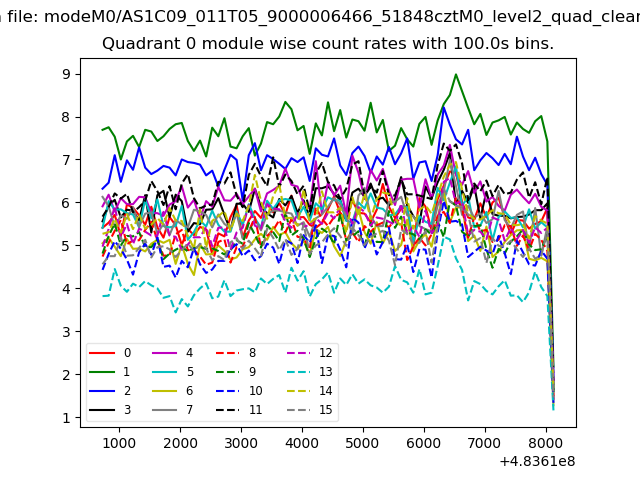 |
 |
| Module-wise count rates for Quadrant B Data is divided into 100 sec bins |
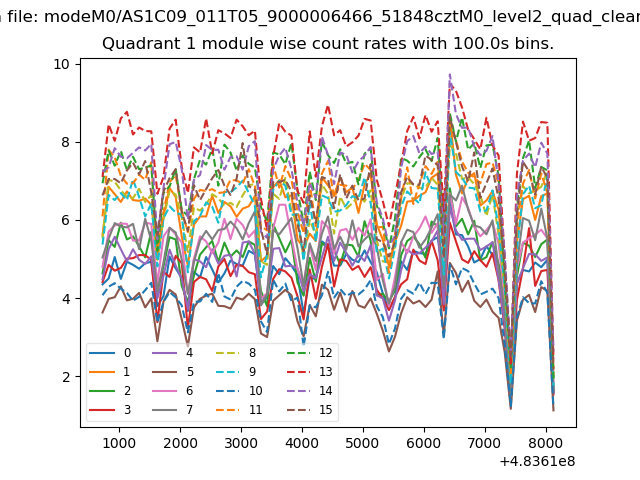 |
 |
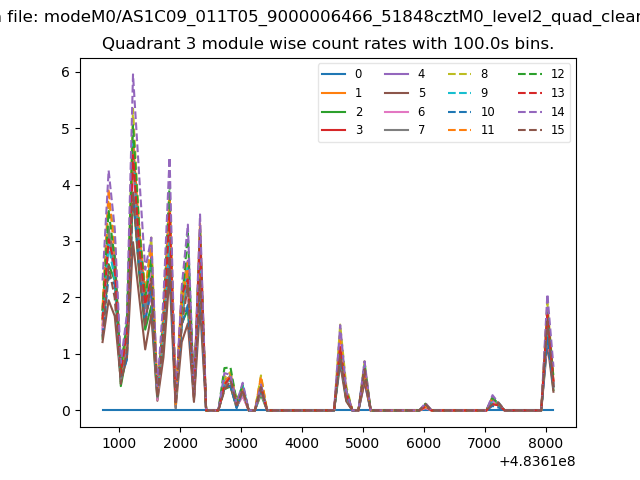
| Module-wise count rates for Quadrant C Data is divided into 100 sec bins |
 |
 |
| Module-wise count rates for Quadrant D Data is divided into 100 sec bins |
 |
 |
| Parameter | Plot |
|---|---|
| CZT HV Monitor | 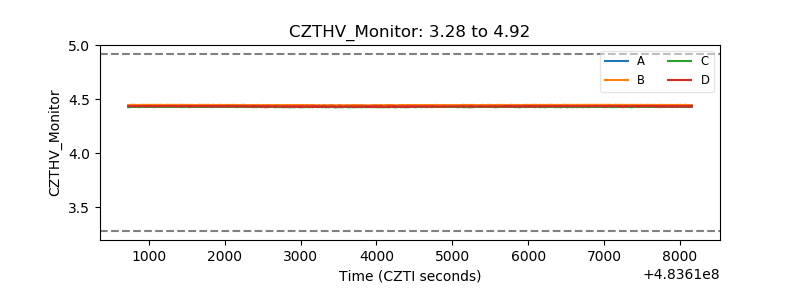 |
| D_VDD | 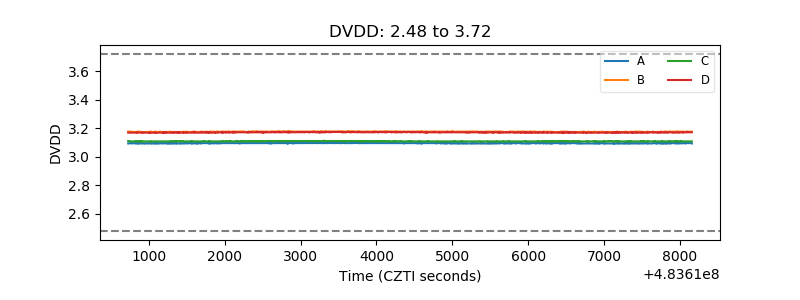 |
| Temperature 1 | 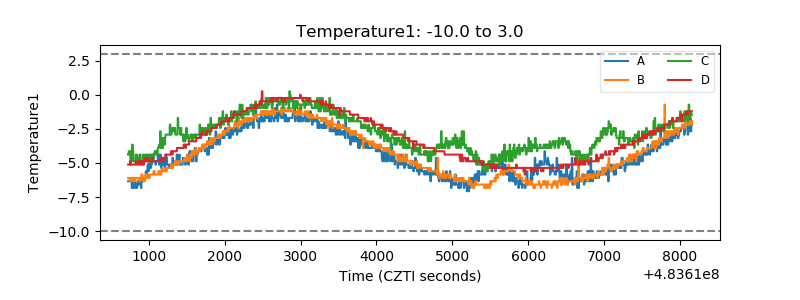 |
| Veto HV Monitor | 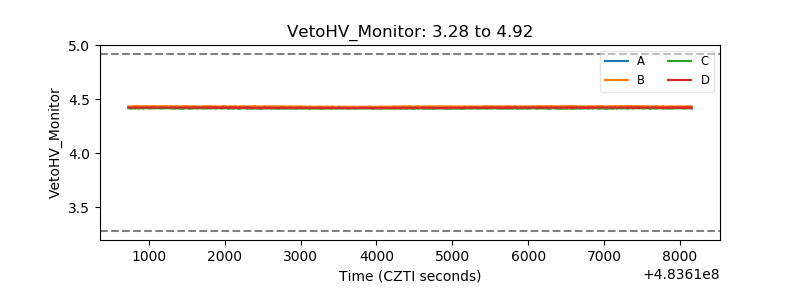 |
| Veto LLD | 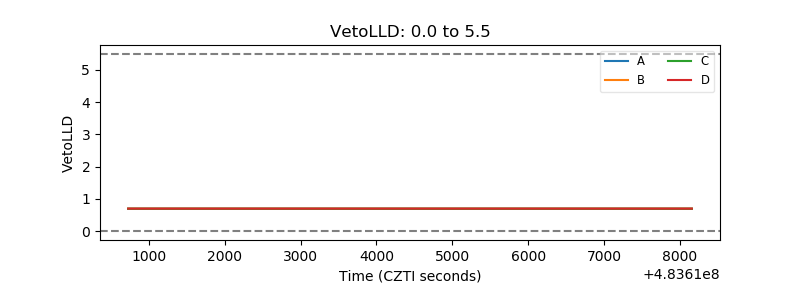 |
| Alpha Counter | 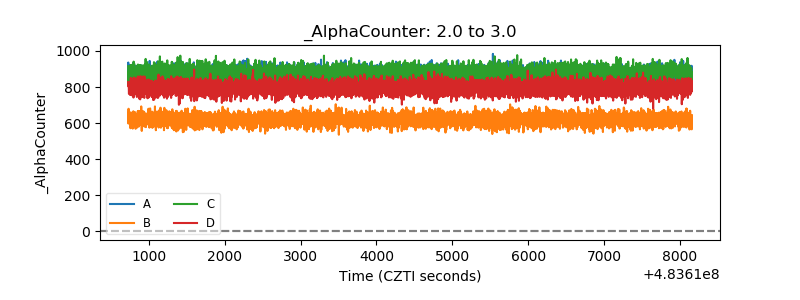 |
| _CPM_Rate | 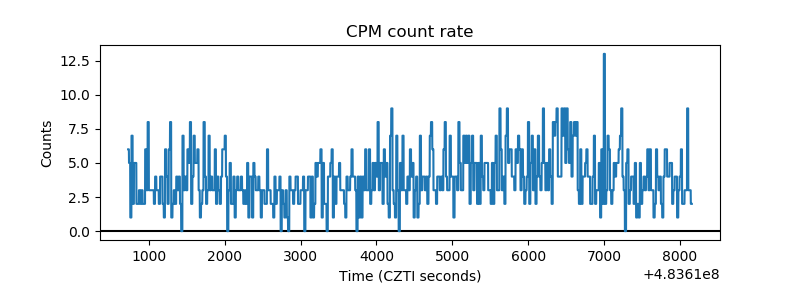 |
| CZT Counter | 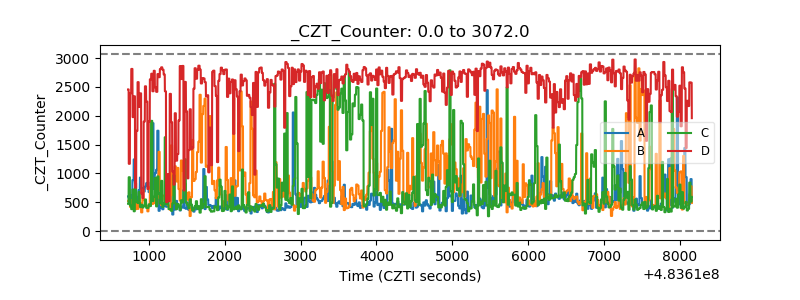 |
| +2.5 Volts monitor | 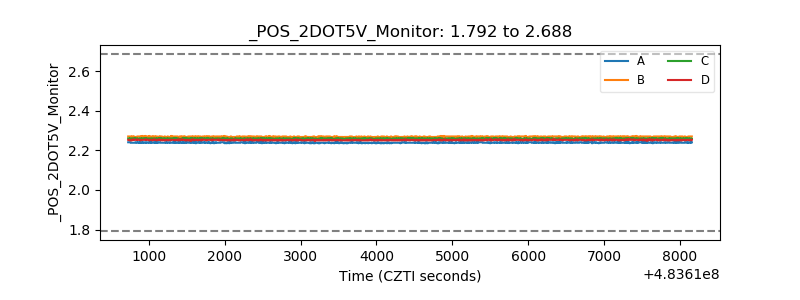 |
| +5 Volts monitor |  |
| _ROLL_ROT | 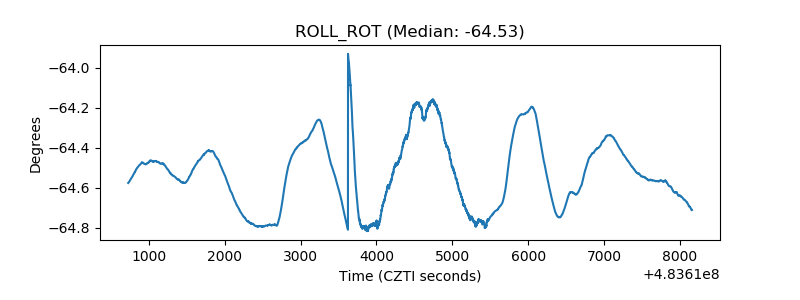 |
| _Roll_DEC | 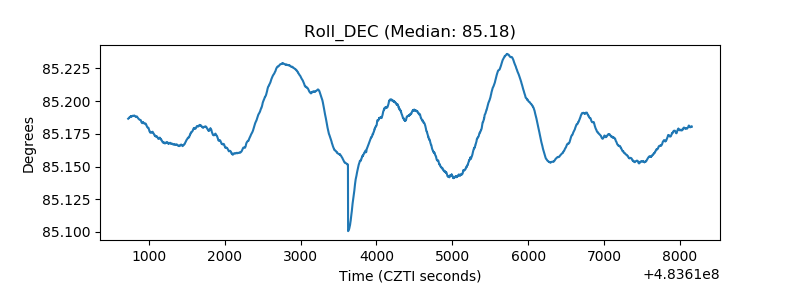 |
| _Roll_RA | 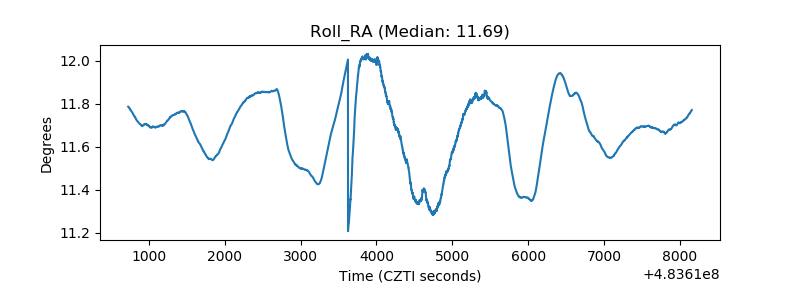 |
| Veto Counter | 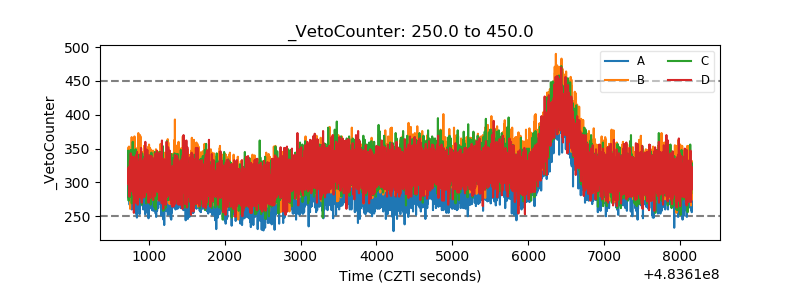 |