| Param | Original file | Final file |
|---|---|---|
| Filename | modeM0/AS1C09_011T05_9000006466_51852cztM0_level2.fits | modeM0/AS1C09_011T05_9000006466_51852cztM0_level2_quad_clean.evt |
| Size (bytes) | 2,186,009,280 | 218,113,920 |
| Size | 2.0 GB | 208.0 MB |
| Events in quadrant A | 20,054,312 | 1,306,571 |
| Events in quadrant B | 14,220,928 | 1,713,304 |
| Events in quadrant C | 12,239,155 | 1,548,478 |
| Events in quadrant D | 32,975,258 | 756,955 |
| Mode SS | |||
|---|---|---|---|
| Quadrant | BADHDUFLAG | Total packets | Discarded packets |
| A | 0 | 378 | 0 |
| B | 0 | 378 | 0 |
| C | 0 | 378 | 0 |
| D | 0 | 378 | 0 |
| Mode M0 | |||
|---|---|---|---|
| Quadrant | BADHDUFLAG | Total packets | Discarded packets |
| A | 0 | 72331 | 2 |
| B | 0 | 54847 | 2 |
| C | 0 | 49385 | 3 |
| D | 0 | 110701 | 2 |
| Mode M9 | |||
|---|---|---|---|
| Quadrant | BADHDUFLAG | Total packets | Discarded packets |
| A | 0 | 10 | 0 |
| B | 0 | 10 | 0 |
| C | 0 | 10 | 0 |
| D | 0 | 10 | 0 |
| Quadrant | Total seconds | Saturated seconds | Saturation percentage |
|---|---|---|---|
| A | 18529 | 4203 | 22.683361% |
| B | 18529 | 1555 | 8.392250% |
| C | 18528 | 1000 | 5.397237% |
| D | 18529 | 9798 | 52.879270% |
Noise dominated data is calculated using 1-second bins in cleaned event files. If a bin has >2000 counts, and if more than 50% of those come from <1% of pixels, then it is considered to be noise-dominated and hence unusable.
| Quadrant | # 1 sec bins | Bins with >0 counts | Bins with >2000 counts | High rate bins dominated by noise | Noise dominated (total time) | Noise dominated (detector-on time) | Marked lightcurve |
|---|---|---|---|---|---|---|---|
| A | 19543 | 18528 | 3676 | 3676 | 18.81% | 19.84% | 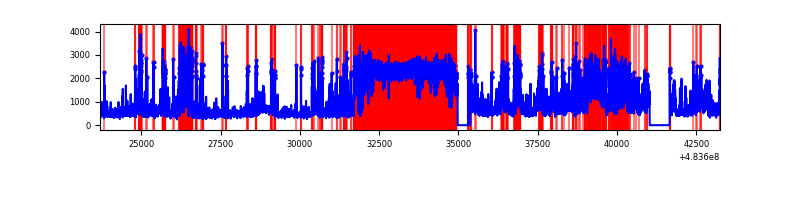 |
| B | 19544 | 18530 | 1132 | 1132 | 5.79% | 6.11% | 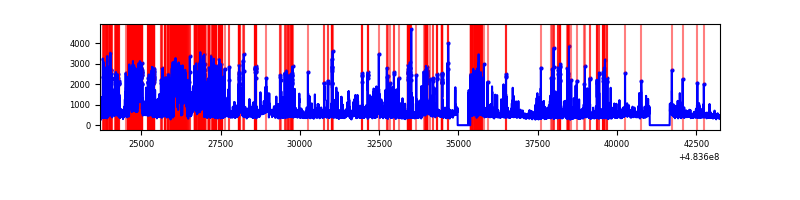 |
| C | 19543 | 18530 | 774 | 774 | 3.96% | 4.18% | 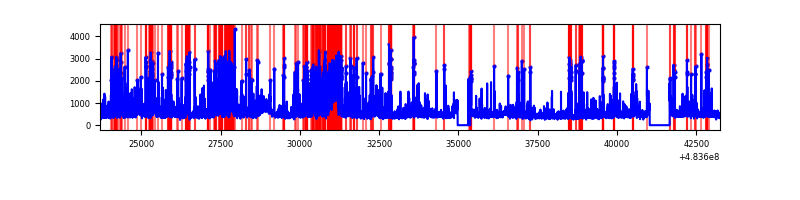 |
| D | 19543 | 18530 | 8669 | 8669 | 44.36% | 46.78% | 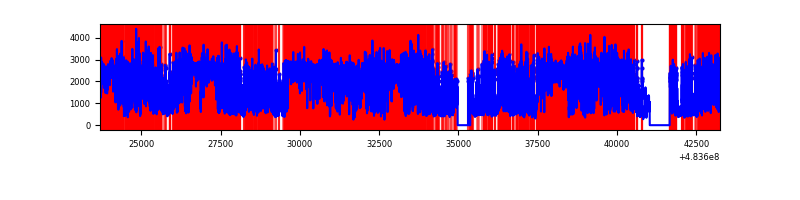 |
Top three noisy pixels from each quadrant. If the there are fewer than three noisy pixels in the level2.evt file, extra rows are filled as -1
| Pixel properties | Quadrant properties | ||||||
|---|---|---|---|---|---|---|---|
| Quadrant | DetID | PixID | Counts | Sigma | Mean | Median | Sigma |
| A | 0 | 228 | 8151098 | 18624.05 | 1749 | 1706 | 437.6 |
| A | 12 | 3 | 1258640 | 2872.51 | 1749 | 1706 | 437.6 |
| A | 8 | 246 | 775705 | 1768.84 | 1749 | 1706 | 437.6 |
| B | 10 | 44 | 2424566 | 6045.58 | 1899 | 1832 | 400.7 |
| B | 5 | 185 | 1328346 | 3310.12 | 1899 | 1832 | 400.7 |
| B | 7 | 252 | 395552 | 982.47 | 1899 | 1832 | 400.7 |
| C | 15 | 158 | 898811 | 1726.44 | 1888 | 1867 | 519.5 |
| C | 13 | 3 | 526043 | 1008.94 | 1888 | 1867 | 519.5 |
| C | 14 | 80 | 492700 | 944.76 | 1888 | 1867 | 519.5 |
| D | 11 | 129 | 20700512 | 55465.34 | 1335 | 1285 | 373.2 |
| D | 7 | 60 | 2314912 | 6199.56 | 1335 | 1285 | 373.2 |
| D | 6 | 42 | 885473 | 2369.26 | 1335 | 1285 | 373.2 |
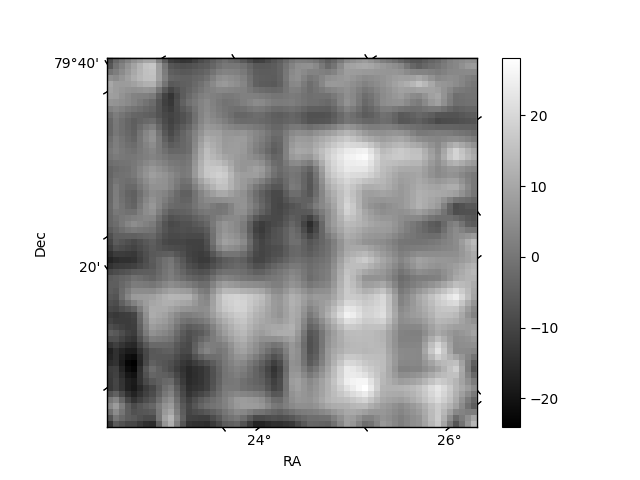
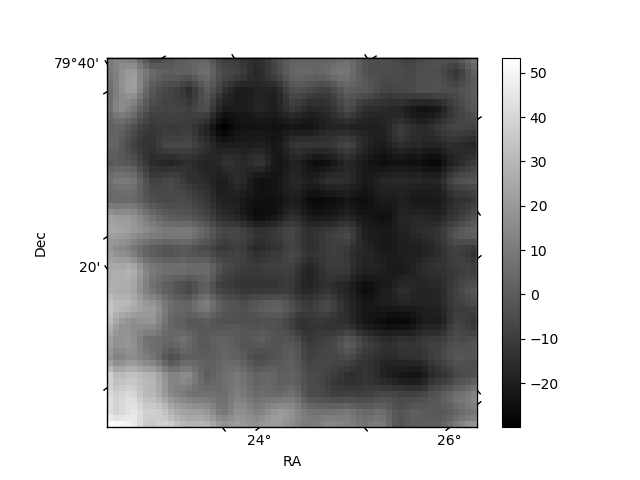
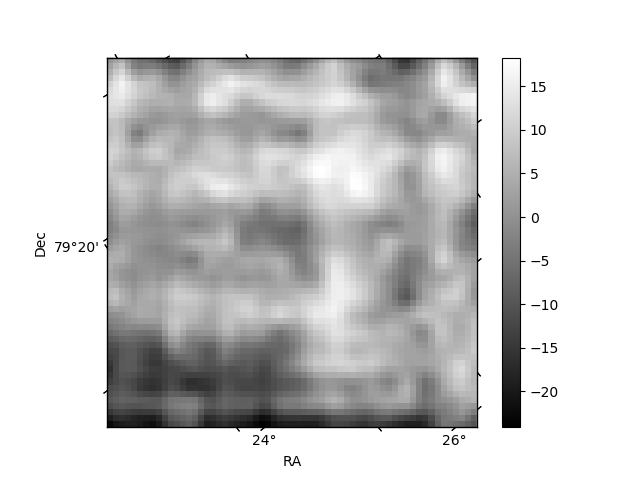
Histogram calculated using DETX and DETY for each event in the final _common_clean file
| Quadrant A | 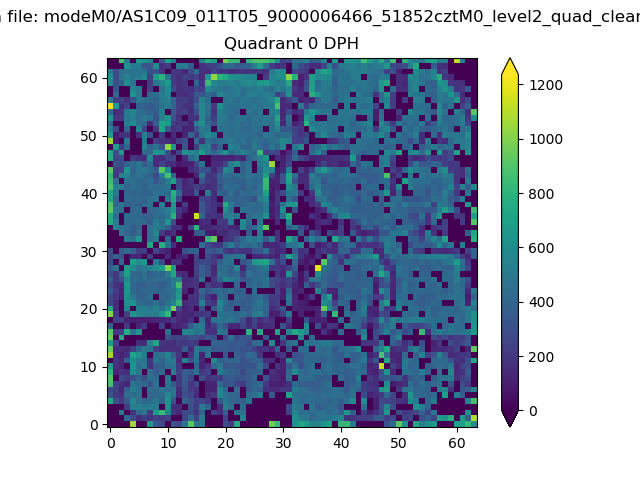 |
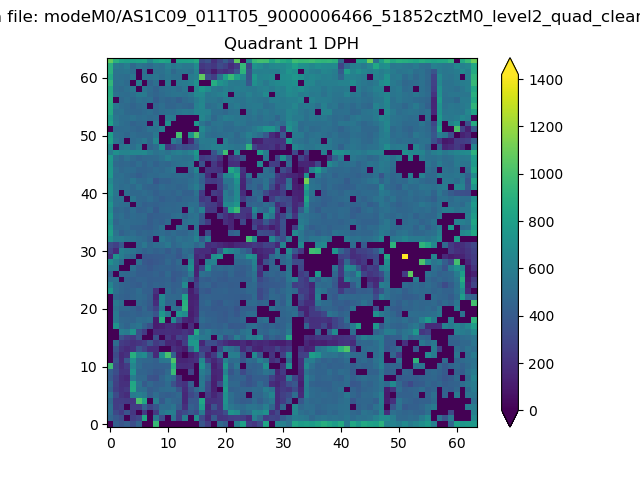 |
Quadrant B |
|---|---|---|---|
| Quadrant D | 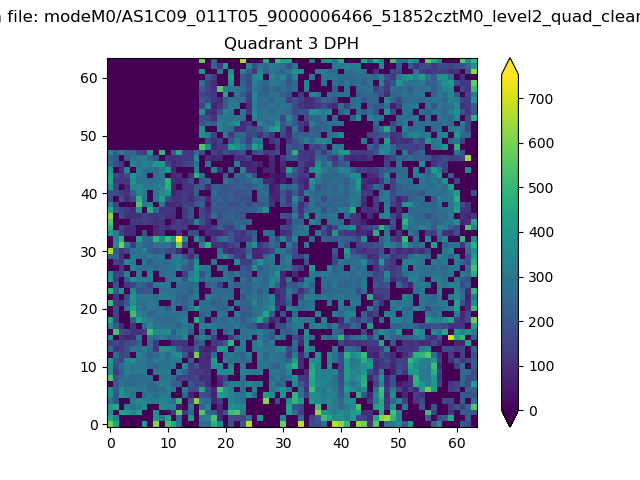 |
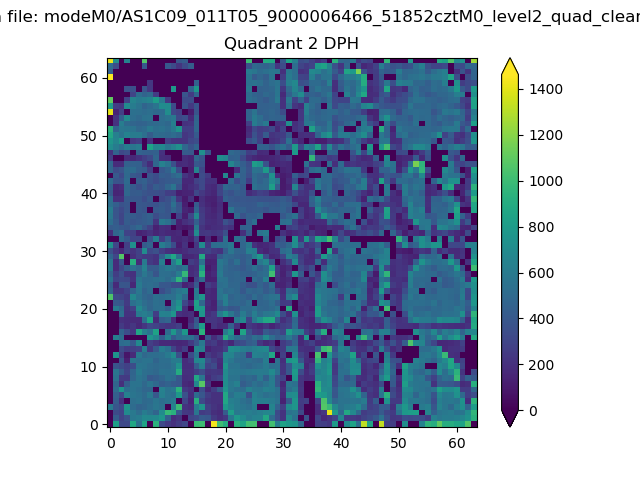 |
Quadrant C |
| Plot type | Count rate plots | Images |
|---|---|---|
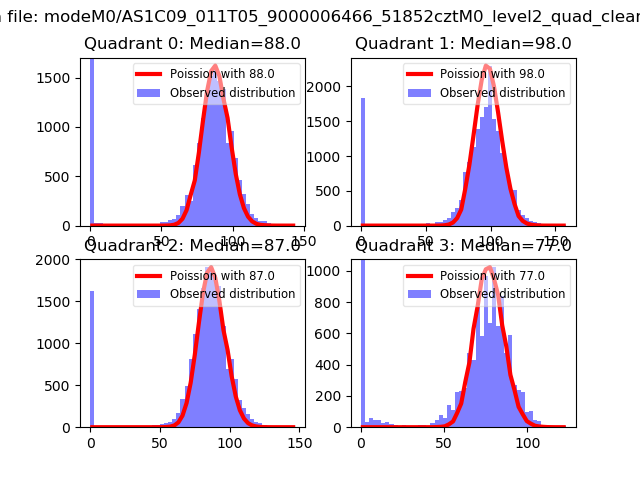
| Comparison with Poisson distribution Blue bars denote a histogram of data divided into 1 sec bins. Red curve is a Poisson curve with rate = median count rate of data. |
 |
 |
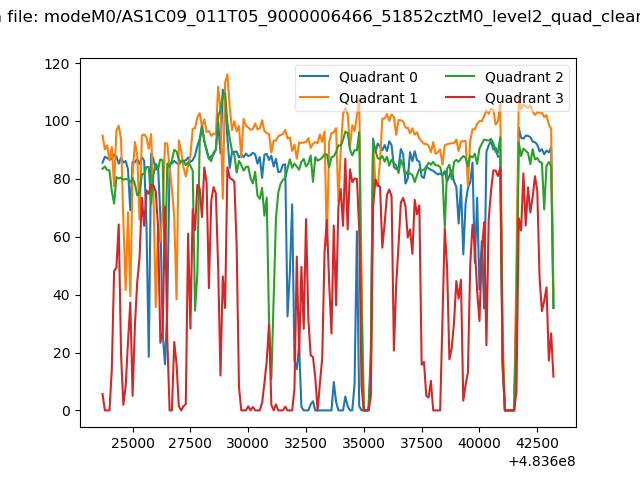
| Quadrant-wise count rates Data is divided into 100 sec bins |
 |
|
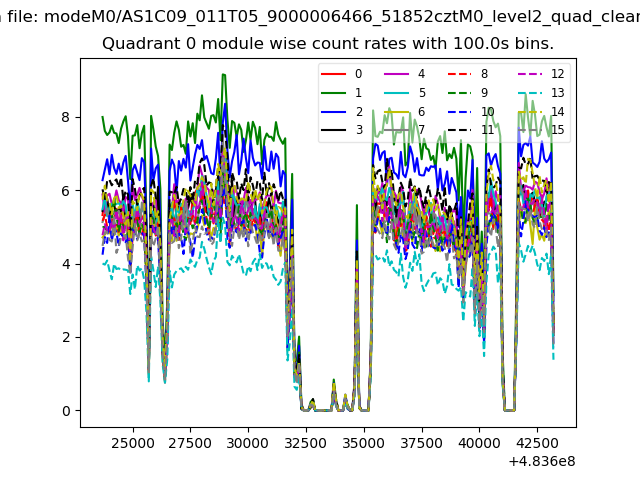
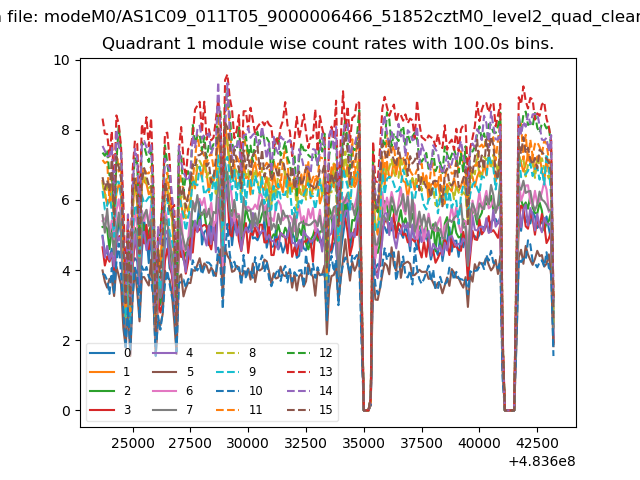
| Module-wise count rates for Quadrant A Data is divided into 100 sec bins |
 |
 |
| Module-wise count rates for Quadrant B Data is divided into 100 sec bins |
 |
 |
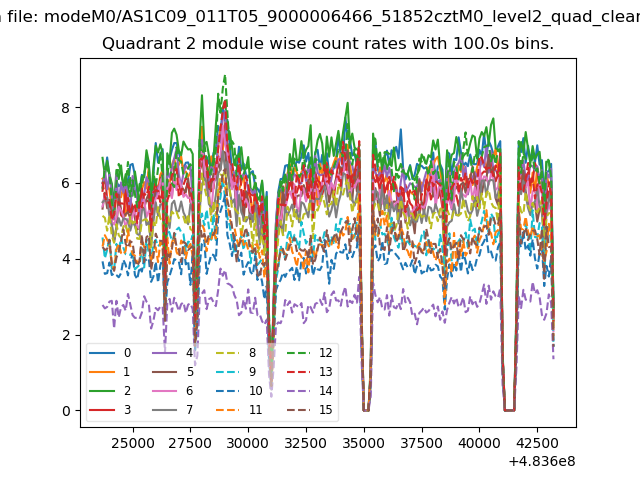
| Module-wise count rates for Quadrant C Data is divided into 100 sec bins |
 |
 |
| Module-wise count rates for Quadrant D Data is divided into 100 sec bins |
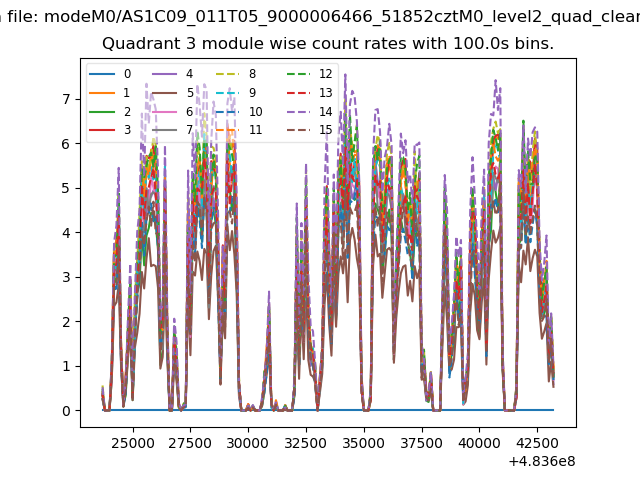 |
 |
| Parameter | Plot |
|---|---|
| CZT HV Monitor | 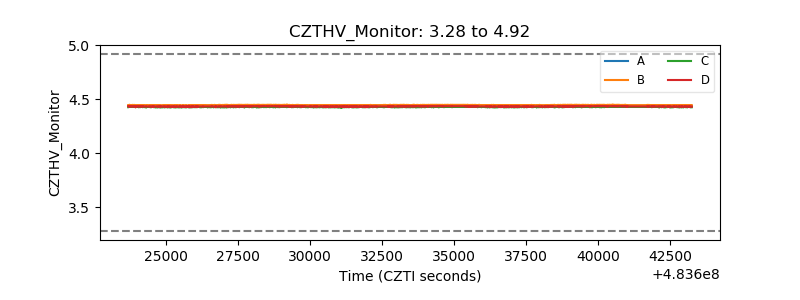 |
| D_VDD | 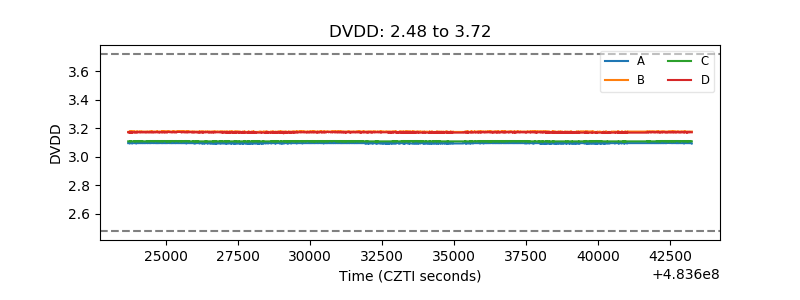 |
| Temperature 1 | 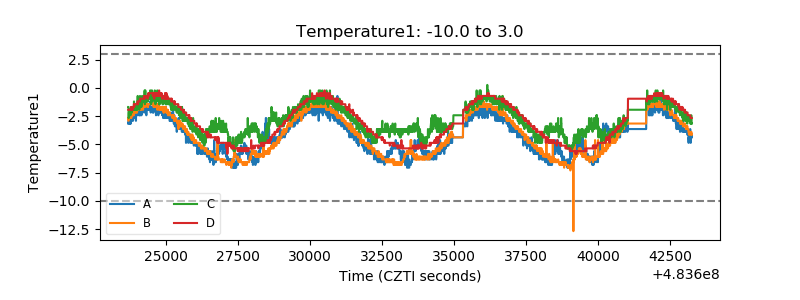 |
| Veto HV Monitor | 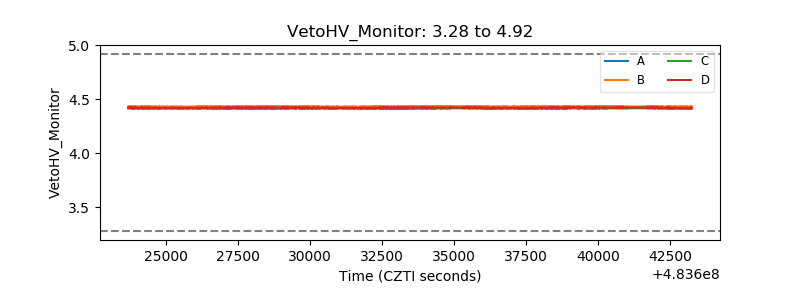 |
| Veto LLD | 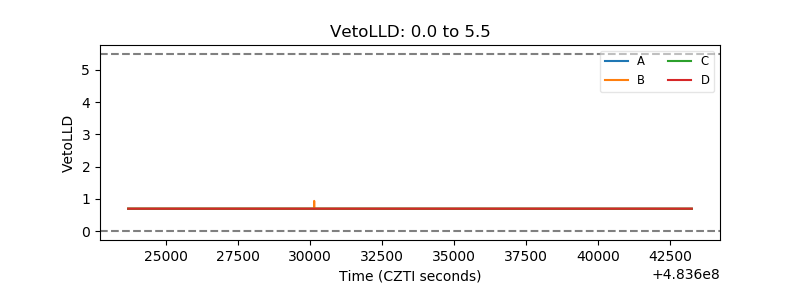 |
| Alpha Counter | 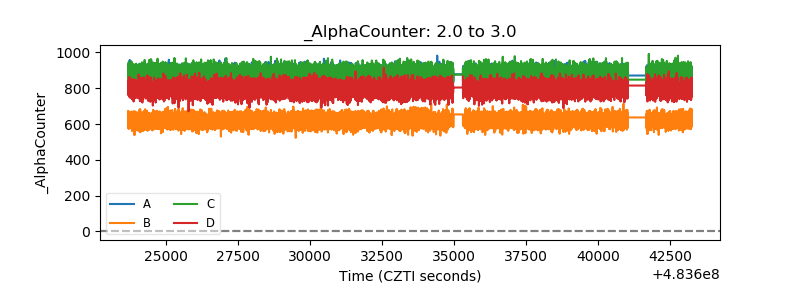 |
| _CPM_Rate | 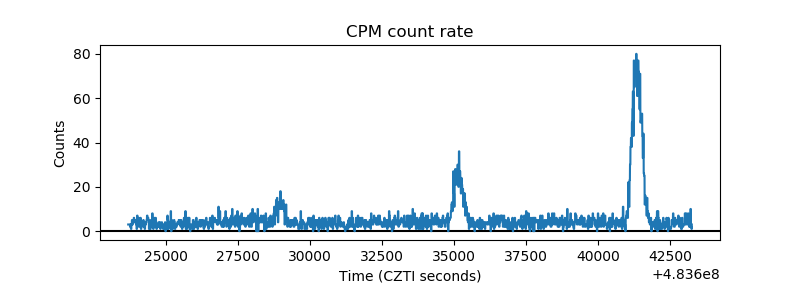 |
| CZT Counter | 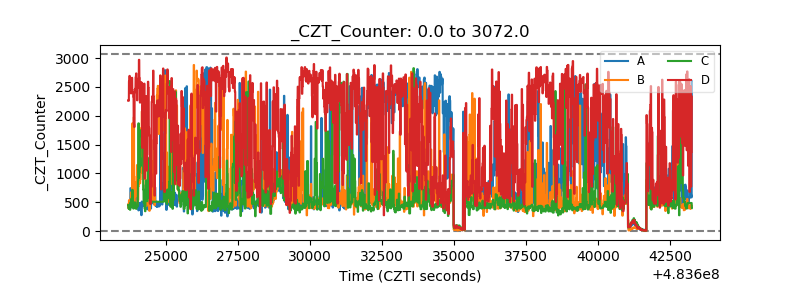 |
| +2.5 Volts monitor |  |
| +5 Volts monitor |  |
| _ROLL_ROT | 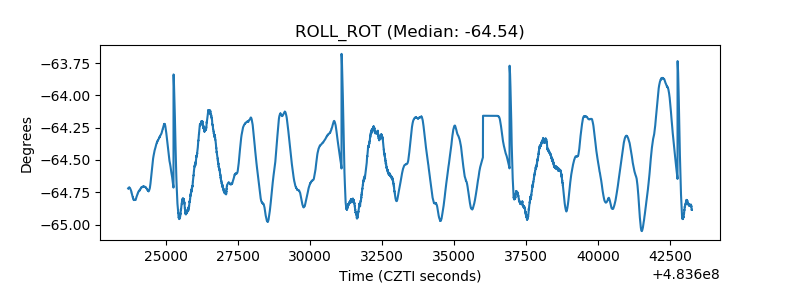 |
| _Roll_DEC | 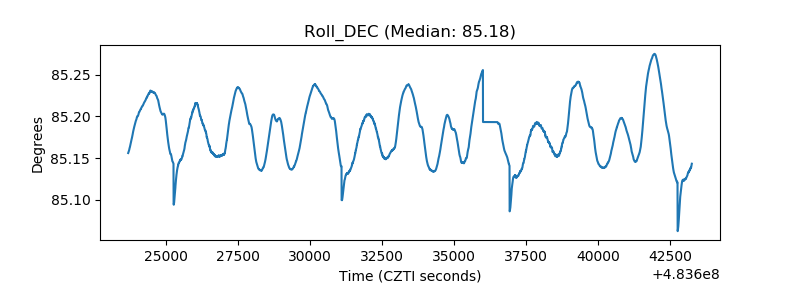 |
| _Roll_RA | 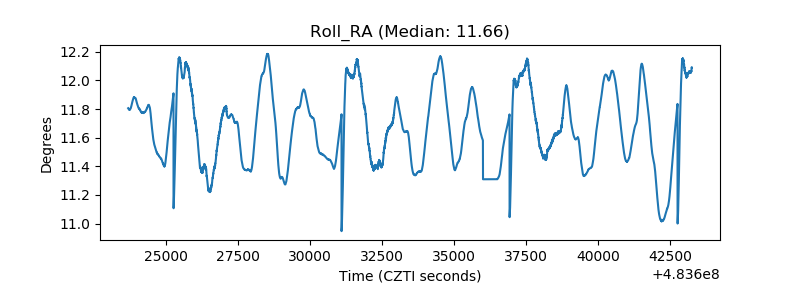 |
| Veto Counter | 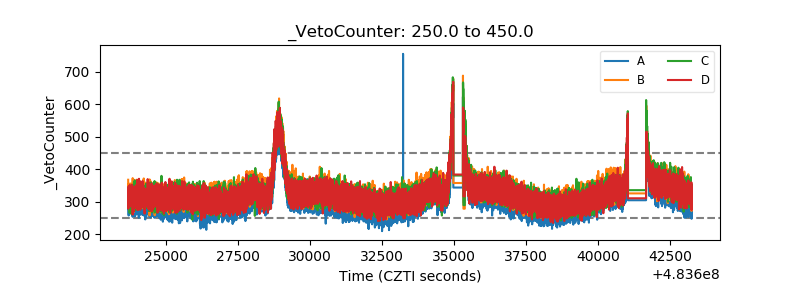 |