| Param | Original file | Final file |
|---|---|---|
| Filename | modeM0/AS1C09_011T05_9000006466_51853cztM0_level2.fits | modeM0/AS1C09_011T05_9000006466_51853cztM0_level2_quad_clean.evt |
| Size (bytes) | 628,830,720 | 93,695,040 |
| Size | 599.7 MB | 89.4 MB |
| Events in quadrant A | 6,093,163 | 601,264 |
| Events in quadrant B | 4,509,804 | 672,211 |
| Events in quadrant C | 4,417,121 | 591,674 |
| Events in quadrant D | 7,722,836 | 491,190 |
| Mode SS | |||
|---|---|---|---|
| Quadrant | BADHDUFLAG | Total packets | Discarded packets |
| A | 0 | 140 | 0 |
| B | 0 | 140 | 0 |
| C | 0 | 140 | 0 |
| D | 0 | 140 | 0 |
| Mode M0 | |||
|---|---|---|---|
| Quadrant | BADHDUFLAG | Total packets | Discarded packets |
| A | 0 | 22818 | 2 |
| B | 0 | 18148 | 2 |
| C | 0 | 17951 | 2 |
| D | 0 | 27643 | 2 |
| Mode M9 | |||
|---|---|---|---|
| Quadrant | BADHDUFLAG | Total packets | Discarded packets |
| A | 0 | 9 | 0 |
| B | 0 | 10 | 0 |
| C | 0 | 10 | 0 |
| D | 0 | 10 | 0 |
| Quadrant | Total seconds | Saturated seconds | Saturation percentage |
|---|---|---|---|
| A | 6893 | 597 | 8.660960% |
| B | 6893 | 372 | 5.396779% |
| C | 6893 | 398 | 5.773974% |
| D | 6893 | 1328 | 19.265922% |
Noise dominated data is calculated using 1-second bins in cleaned event files. If a bin has >2000 counts, and if more than 50% of those come from <1% of pixels, then it is considered to be noise-dominated and hence unusable.
| Quadrant | # 1 sec bins | Bins with >0 counts | Bins with >2000 counts | High rate bins dominated by noise | Noise dominated (total time) | Noise dominated (detector-on time) | Marked lightcurve |
|---|---|---|---|---|---|---|---|
| A | 7712 | 6893 | 565 | 565 | 7.33% | 8.20% | 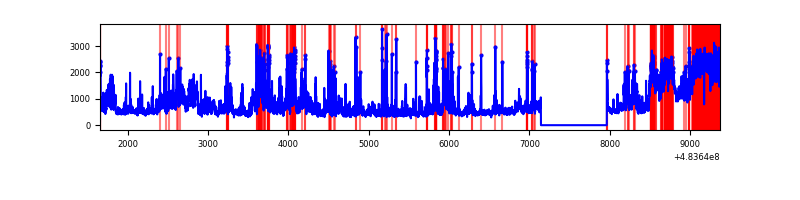 |
| B | 7713 | 6894 | 294 | 294 | 3.81% | 4.26% | 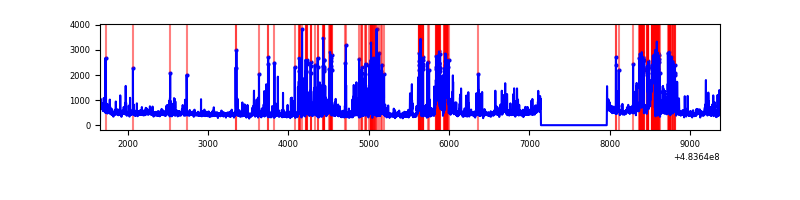 |
| C | 7713 | 6893 | 335 | 335 | 4.34% | 4.86% | 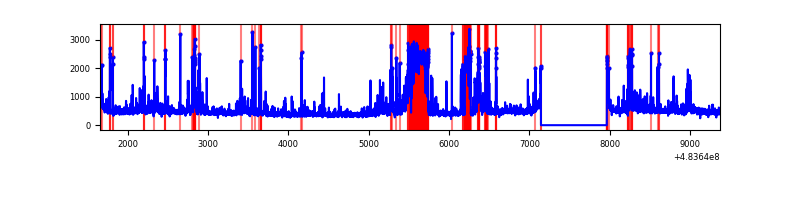 |
| D | 7713 | 6893 | 1187 | 1187 | 15.39% | 17.22% | 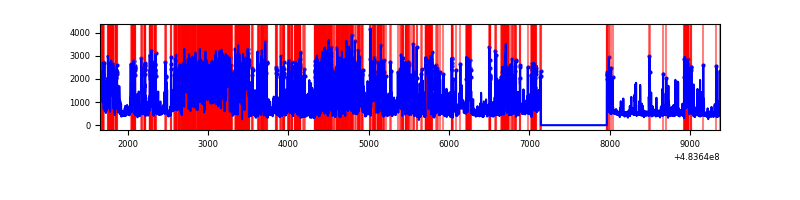 |
Top three noisy pixels from each quadrant. If the there are fewer than three noisy pixels in the level2.evt file, extra rows are filled as -1
| Pixel properties | Quadrant properties | ||||||
|---|---|---|---|---|---|---|---|
| Quadrant | DetID | PixID | Counts | Sigma | Mean | Median | Sigma |
| A | 4 | 249 | 1042171 | 5810.42 | 711 | 692 | 179.2 |
| A | 12 | 3 | 605283 | 3373.02 | 711 | 692 | 179.2 |
| A | 0 | 228 | 453089 | 2523.93 | 711 | 692 | 179.2 |
| B | 1 | 255 | 389442 | 2588.27 | 712 | 687 | 150.2 |
| B | 5 | 185 | 307888 | 2045.29 | 712 | 687 | 150.2 |
| B | 7 | 252 | 178531 | 1184.05 | 712 | 687 | 150.2 |
| C | 15 | 230 | 600866 | 3104.2 | 701 | 694 | 193.3 |
| C | 15 | 158 | 301229 | 1554.42 | 701 | 694 | 193.3 |
| C | 13 | 3 | 192188 | 990.44 | 701 | 694 | 193.3 |
| D | 11 | 129 | 3592104 | 19951.29 | 648 | 622 | 180.0 |
| D | 6 | 42 | 580552 | 3221.61 | 648 | 622 | 180.0 |
| D | 0 | 18 | 306222 | 1697.66 | 648 | 622 | 180.0 |
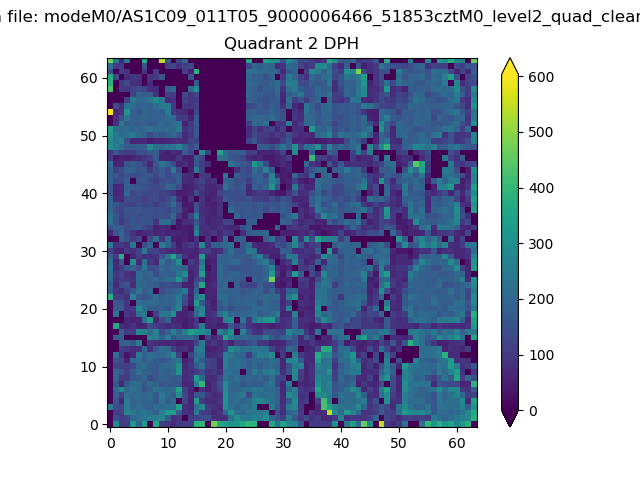
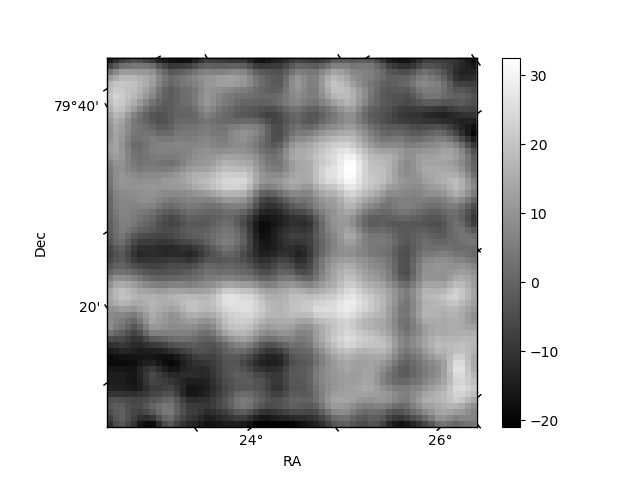
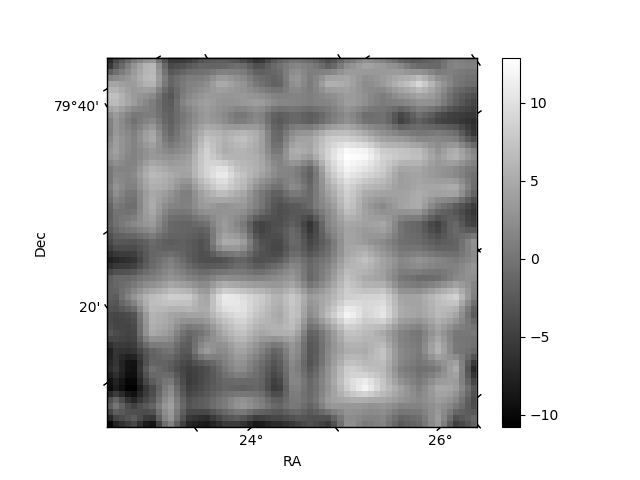
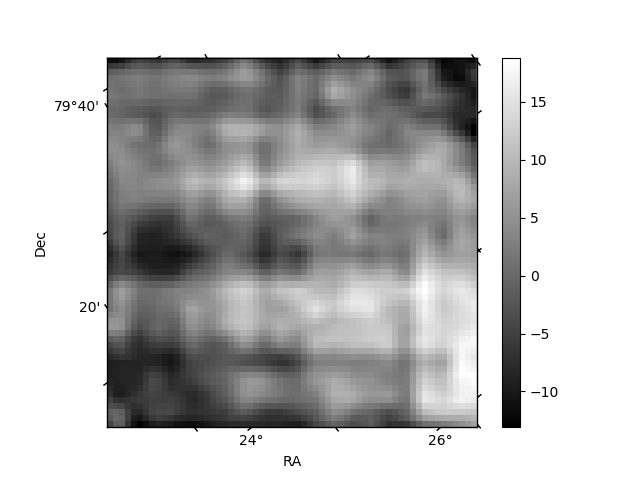
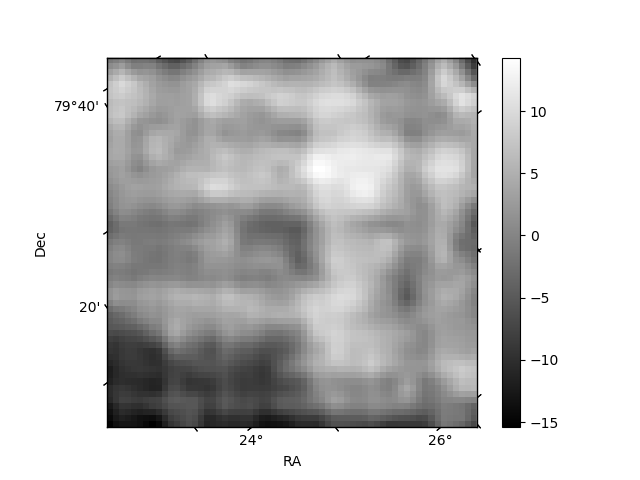
Histogram calculated using DETX and DETY for each event in the final _common_clean file
| Quadrant A | 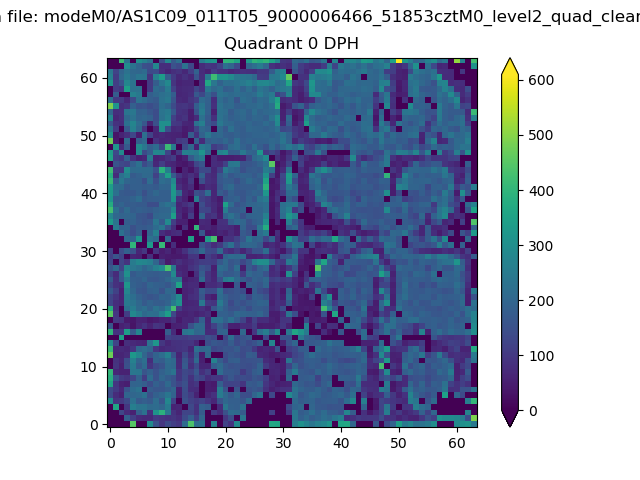 |
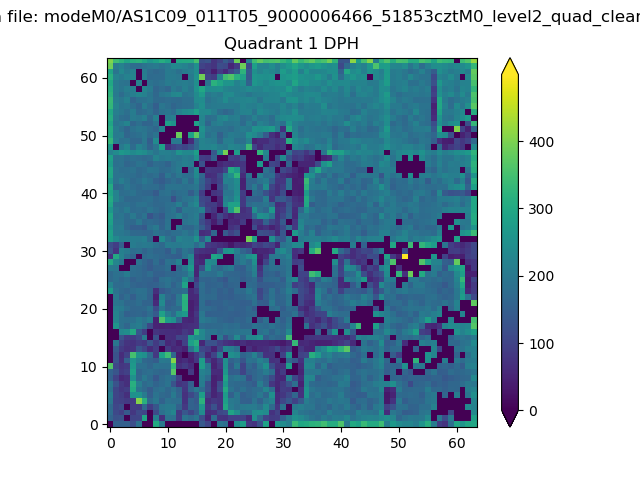 |
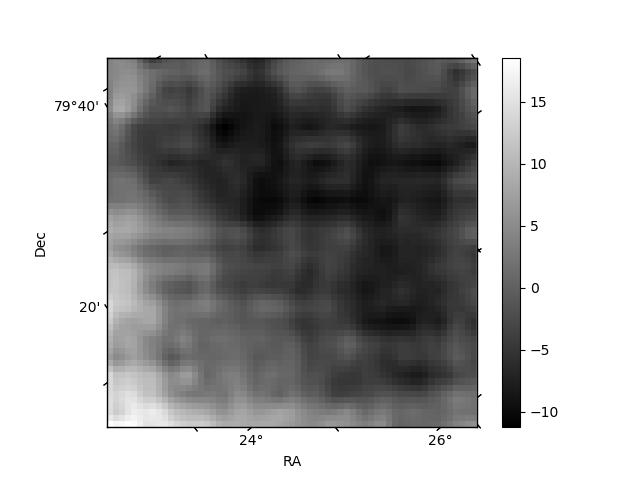
Quadrant B |
|---|---|---|---|
| Quadrant D | 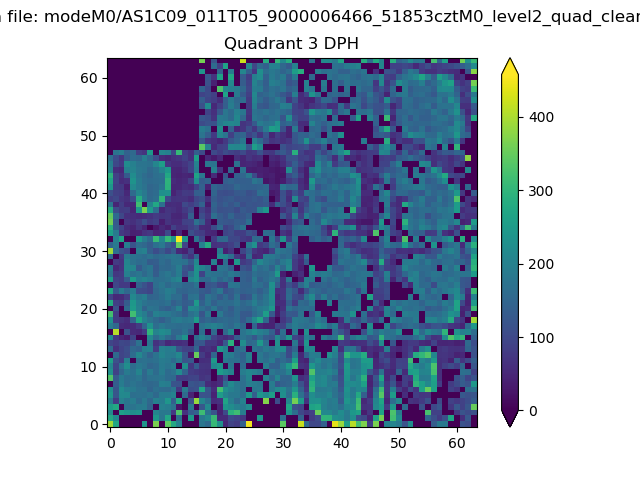 |
 |
Quadrant C |
| Plot type | Count rate plots | Images |
|---|---|---|
| Comparison with Poisson distribution Blue bars denote a histogram of data divided into 1 sec bins. Red curve is a Poisson curve with rate = median count rate of data. |
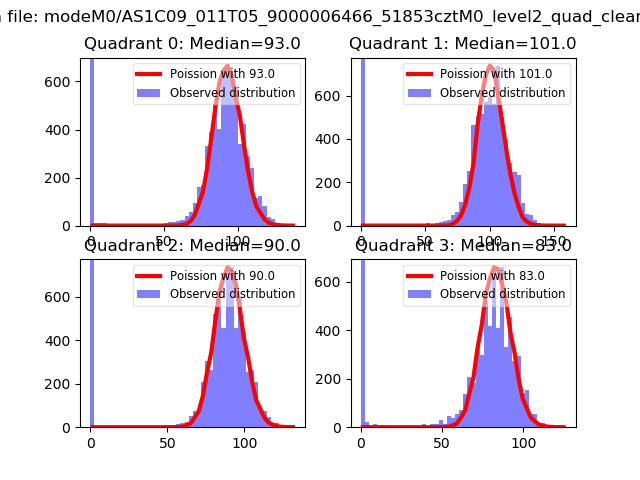 |
 |
| Quadrant-wise count rates Data is divided into 100 sec bins |
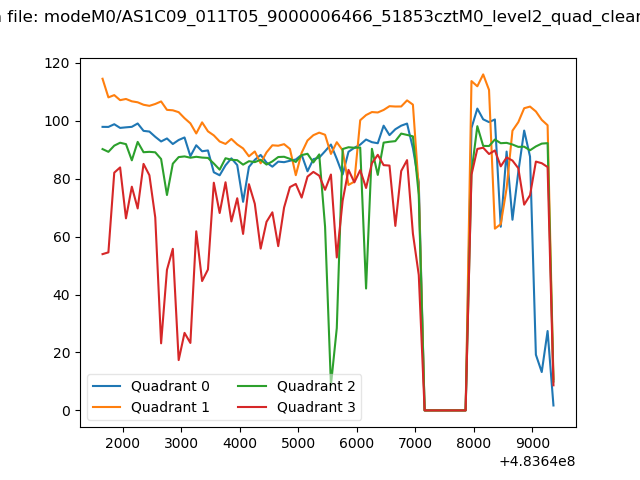 |
|
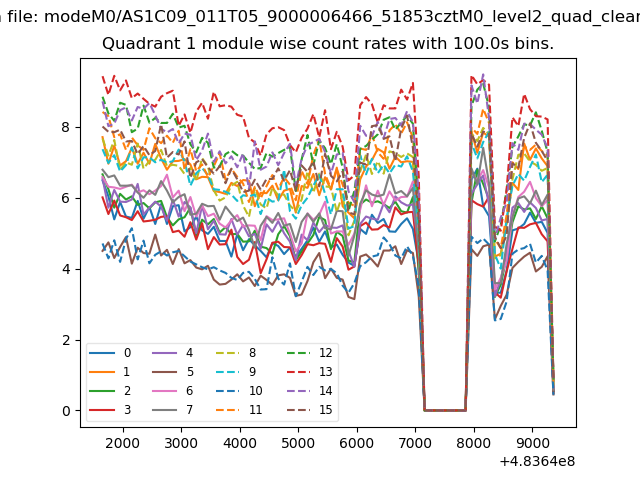
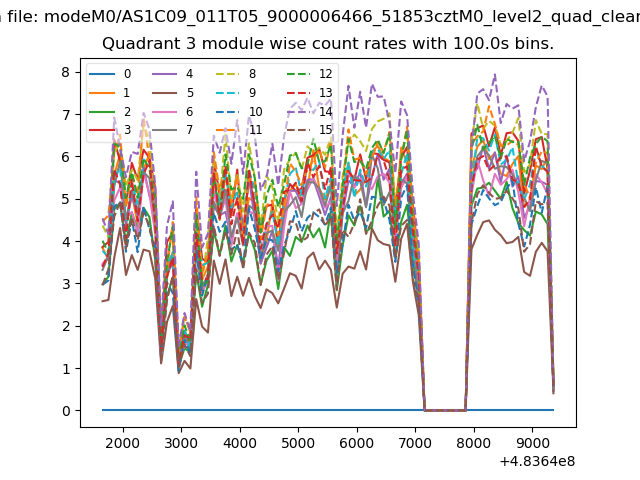
| Module-wise count rates for Quadrant A Data is divided into 100 sec bins |
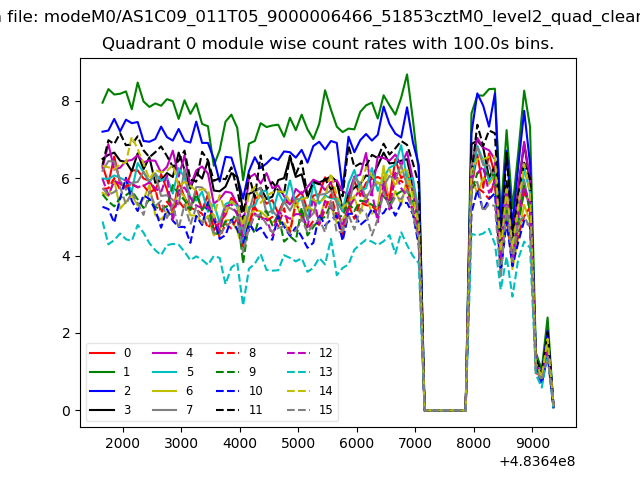 |
 |
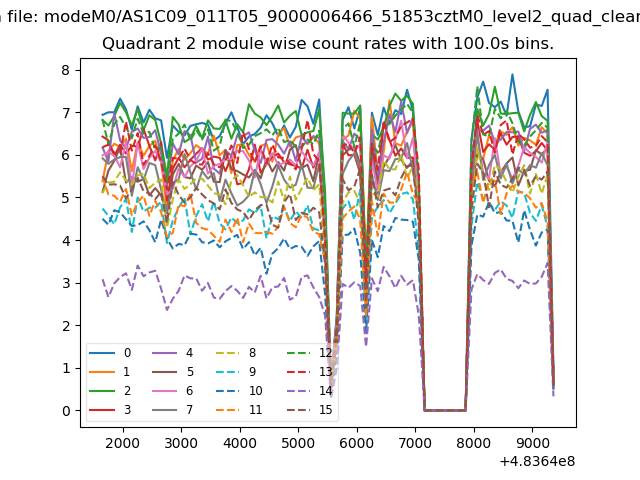
| Module-wise count rates for Quadrant B Data is divided into 100 sec bins |
 |
 |
| Module-wise count rates for Quadrant C Data is divided into 100 sec bins |
 |
 |
| Module-wise count rates for Quadrant D Data is divided into 100 sec bins |
 |
 |
| Parameter | Plot |
|---|---|
| CZT HV Monitor |  |
| D_VDD |  |
| Temperature 1 | 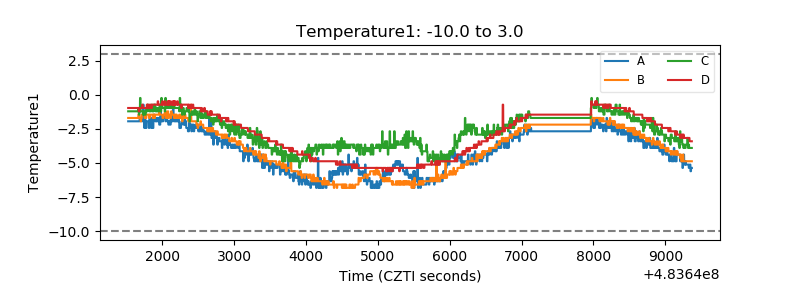 |
| Veto HV Monitor | 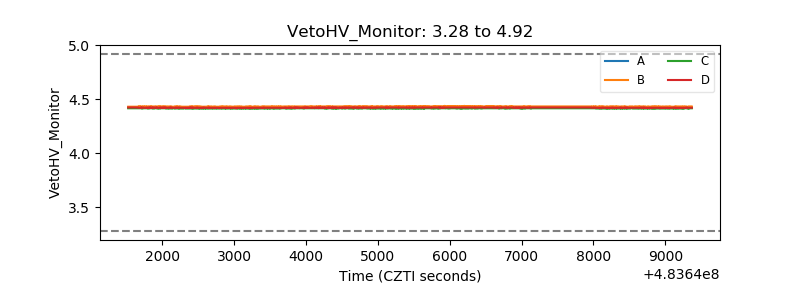 |
| Veto LLD | 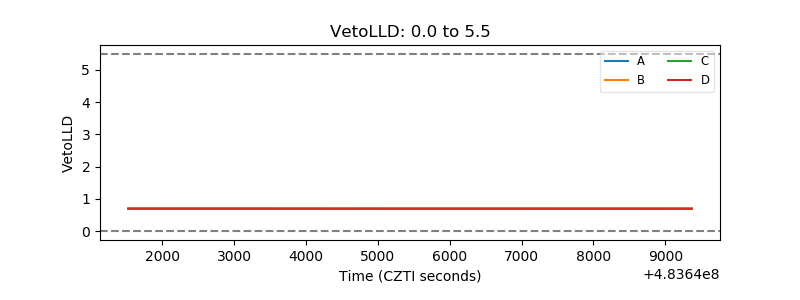 |
| Alpha Counter | 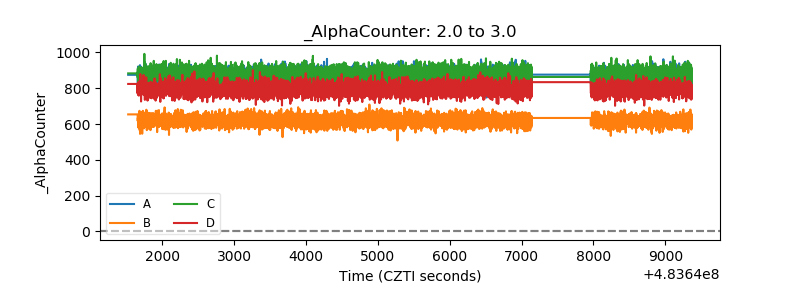 |
| _CPM_Rate | 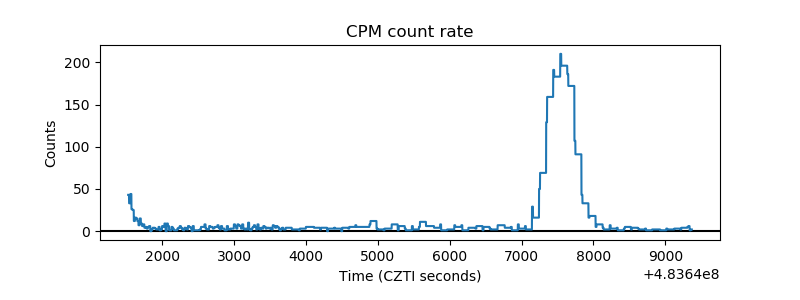 |
| CZT Counter | 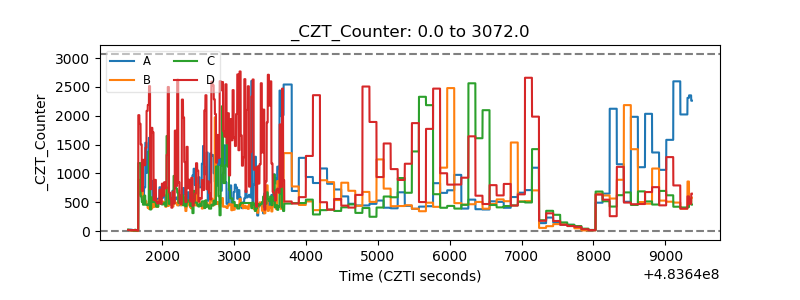 |
| +2.5 Volts monitor | 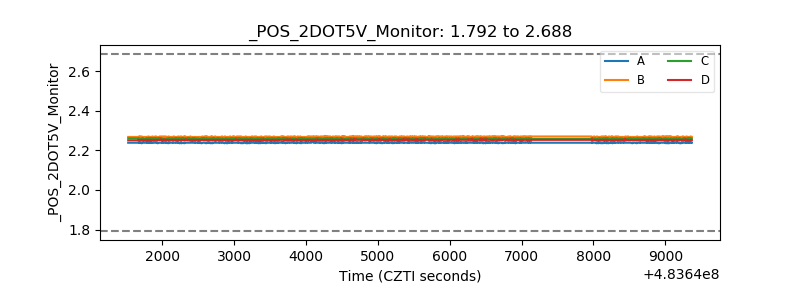 |
| +5 Volts monitor | 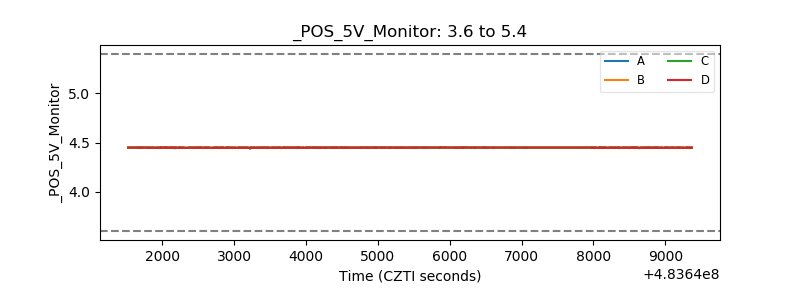 |
| _ROLL_ROT | 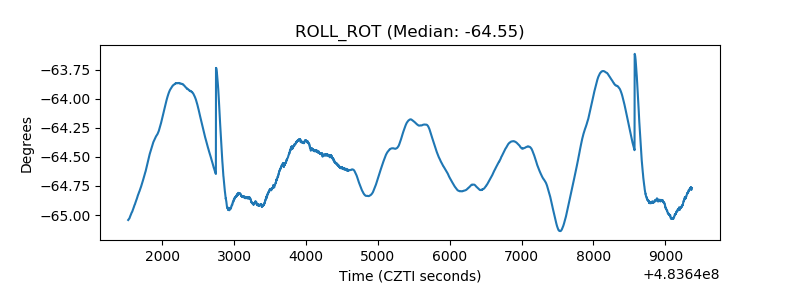 |
| _Roll_DEC | 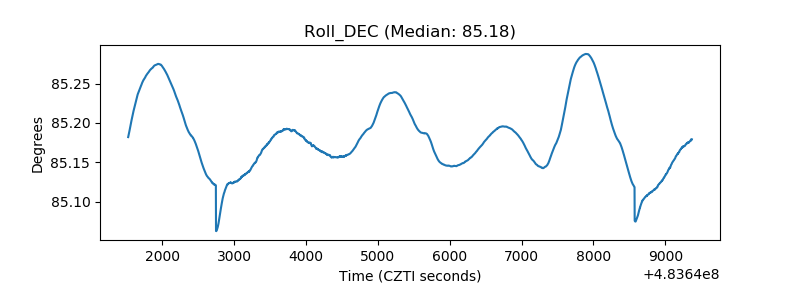 |
| _Roll_RA | 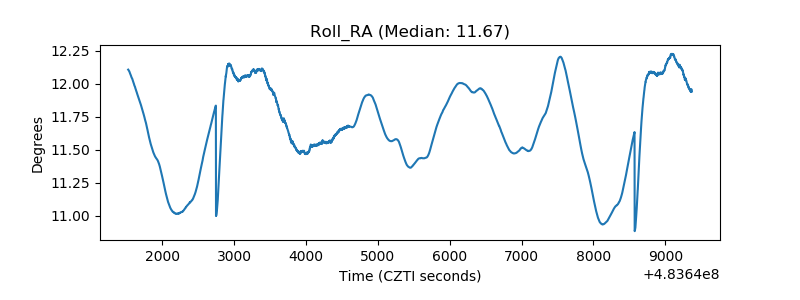 |
| Veto Counter | 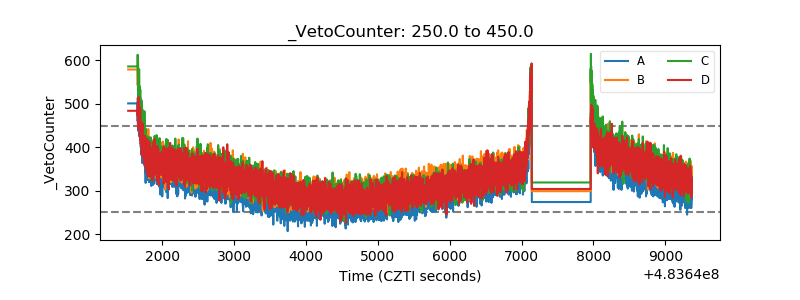 |