| Param | Original file | Final file |
|---|---|---|
| Filename | modeM0/AS1C09_011T05_9000006466_51855cztM0_level2.fits | modeM0/AS1C09_011T05_9000006466_51855cztM0_level2_quad_clean.evt |
| Size (bytes) | 713,926,080 | 81,408,960 |
| Size | 680.9 MB | 77.6 MB |
| Events in quadrant A | 7,578,447 | 511,292 |
| Events in quadrant B | 4,511,277 | 634,562 |
| Events in quadrant C | 3,587,174 | 586,794 |
| Events in quadrant D | 10,250,225 | 282,471 |
| Mode SS | |||
|---|---|---|---|
| Quadrant | BADHDUFLAG | Total packets | Discarded packets |
| A | 0 | 130 | 0 |
| B | 0 | 130 | 0 |
| C | 0 | 130 | 0 |
| D | 0 | 130 | 0 |
| Mode M0 | |||
|---|---|---|---|
| Quadrant | BADHDUFLAG | Total packets | Discarded packets |
| A | 0 | 27019 | 1 |
| B | 0 | 17865 | 1 |
| C | 0 | 15329 | 2 |
| D | 0 | 34927 | 1 |
| Mode M9 | |||
|---|---|---|---|
| Quadrant | BADHDUFLAG | Total packets | Discarded packets |
| A | 0 | 10 | 0 |
| B | 0 | 10 | 0 |
| C | 0 | 10 | 0 |
| D | 0 | 10 | 0 |
| Quadrant | Total seconds | Saturated seconds | Saturation percentage |
|---|---|---|---|
| A | 6447 | 1183 | 18.349620% |
| B | 6448 | 291 | 4.513027% |
| C | 6447 | 122 | 1.892353% |
| D | 6447 | 3376 | 52.365441% |
Noise dominated data is calculated using 1-second bins in cleaned event files. If a bin has >2000 counts, and if more than 50% of those come from <1% of pixels, then it is considered to be noise-dominated and hence unusable.
| Quadrant | # 1 sec bins | Bins with >0 counts | Bins with >2000 counts | High rate bins dominated by noise | Noise dominated (total time) | Noise dominated (detector-on time) | Marked lightcurve |
|---|---|---|---|---|---|---|---|
| A | 7416 | 6447 | 1151 | 1151 | 15.52% | 17.85% | 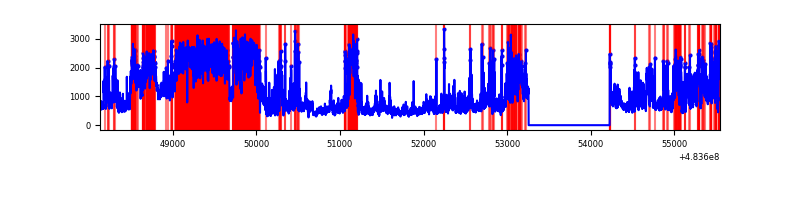 |
| B | 7418 | 6448 | 251 | 251 | 3.38% | 3.89% | 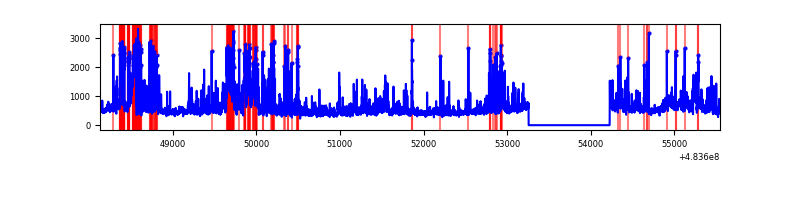 |
| C | 7417 | 6447 | 78 | 78 | 1.05% | 1.21% | 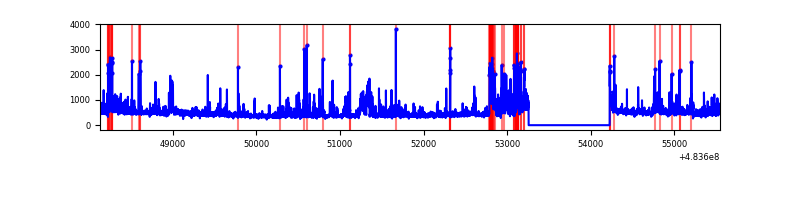 |
| D | 7417 | 6447 | 2737 | 2737 | 36.90% | 42.45% | 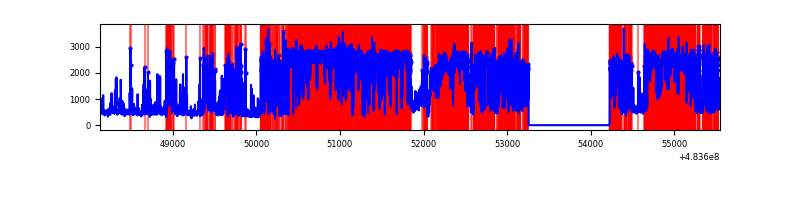 |
Top three noisy pixels from each quadrant. If the there are fewer than three noisy pixels in the level2.evt file, extra rows are filled as -1
| Pixel properties | Quadrant properties | ||||||
|---|---|---|---|---|---|---|---|
| Quadrant | DetID | PixID | Counts | Sigma | Mean | Median | Sigma |
| A | 4 | 249 | 1947994 | 12394.51 | 634 | 618 | 157.1 |
| A | 0 | 228 | 994548 | 6326.09 | 634 | 618 | 157.1 |
| A | 12 | 3 | 872744 | 5550.84 | 634 | 618 | 157.1 |
| B | 1 | 255 | 509469 | 3636.24 | 662 | 639 | 139.9 |
| B | 10 | 44 | 387958 | 2767.89 | 662 | 639 | 139.9 |
| B | 0 | 171 | 152023 | 1081.83 | 662 | 639 | 139.9 |
| C | 15 | 230 | 335727 | 1823.27 | 663 | 659 | 183.8 |
| C | 15 | 192 | 154025 | 834.54 | 663 | 659 | 183.8 |
| C | 13 | 3 | 131902 | 714.16 | 663 | 659 | 183.8 |
| D | 11 | 129 | 7261755 | 59046.66 | 436 | 419 | 123.0 |
| D | 7 | 96 | 734333 | 5967.93 | 436 | 419 | 123.0 |
| D | 6 | 42 | 193050 | 1566.41 | 436 | 419 | 123.0 |
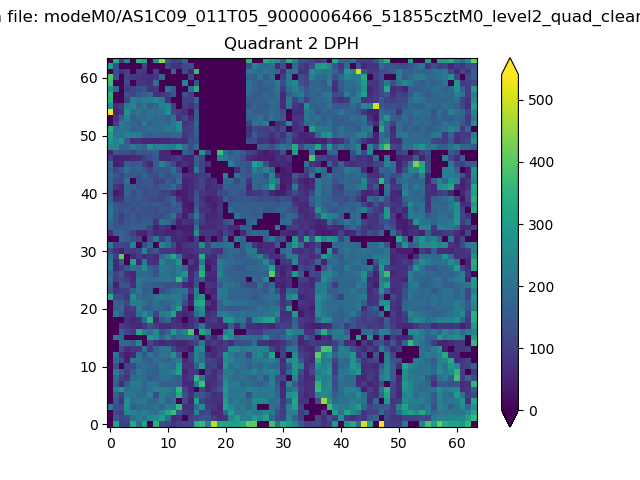
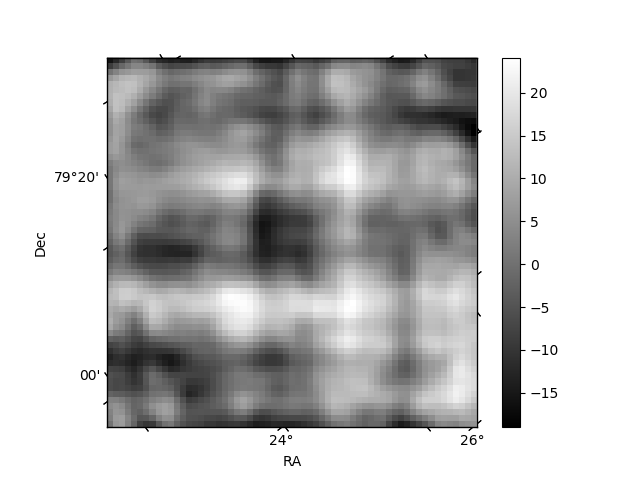
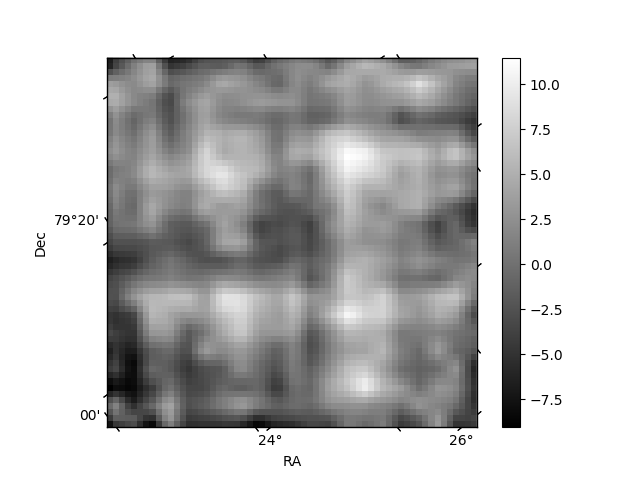
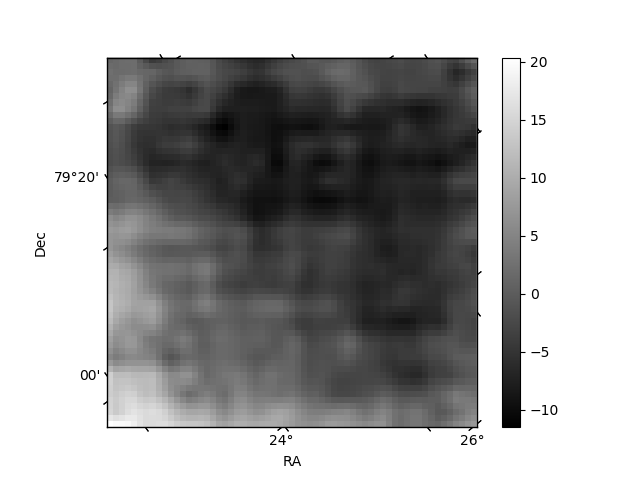
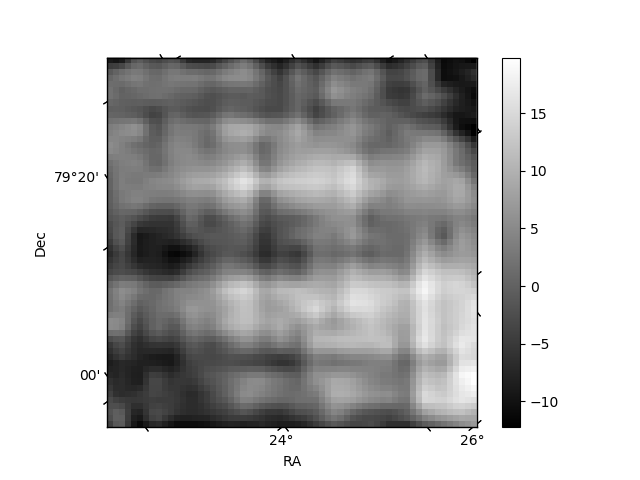
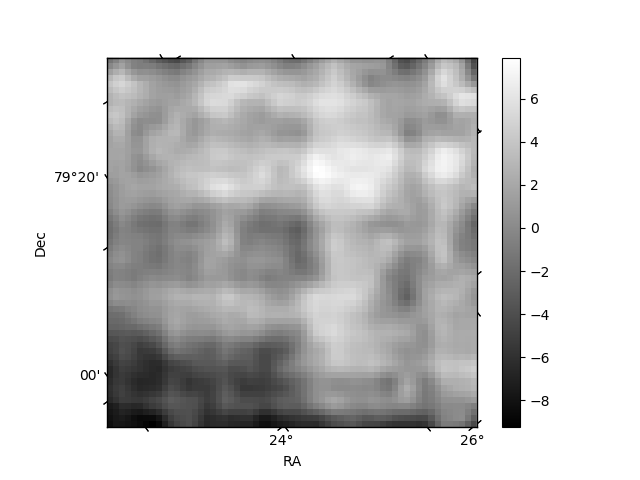
Histogram calculated using DETX and DETY for each event in the final _common_clean file
| Quadrant A | 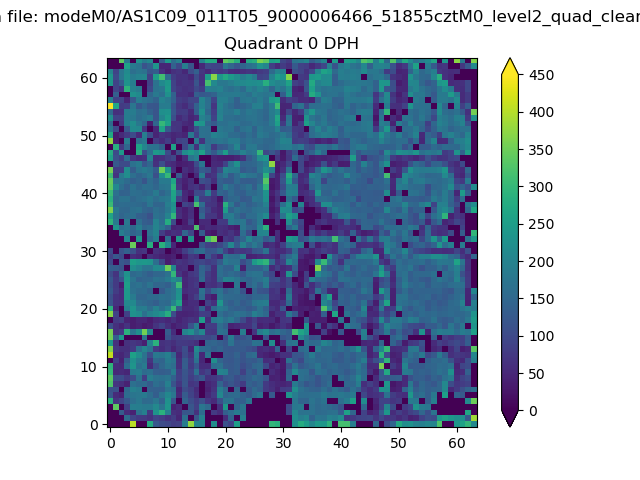 |
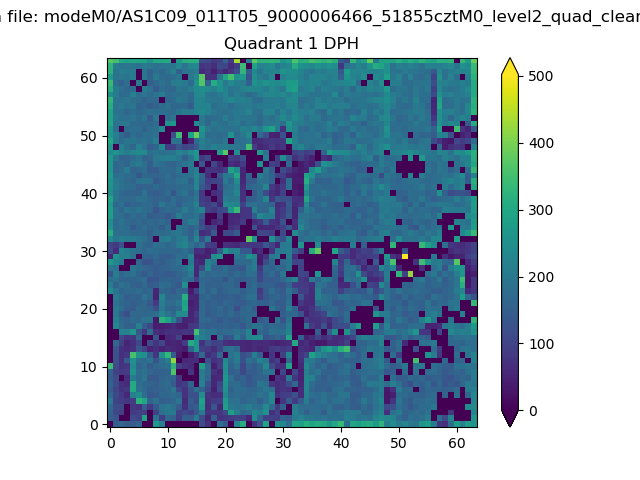 |
Quadrant B |
|---|---|---|---|
| Quadrant D | 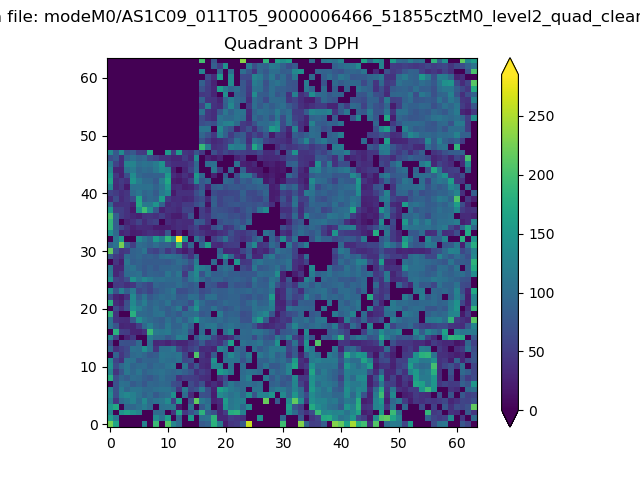 |
 |
Quadrant C |
| Plot type | Count rate plots | Images |
|---|---|---|
| Comparison with Poisson distribution Blue bars denote a histogram of data divided into 1 sec bins. Red curve is a Poisson curve with rate = median count rate of data. |
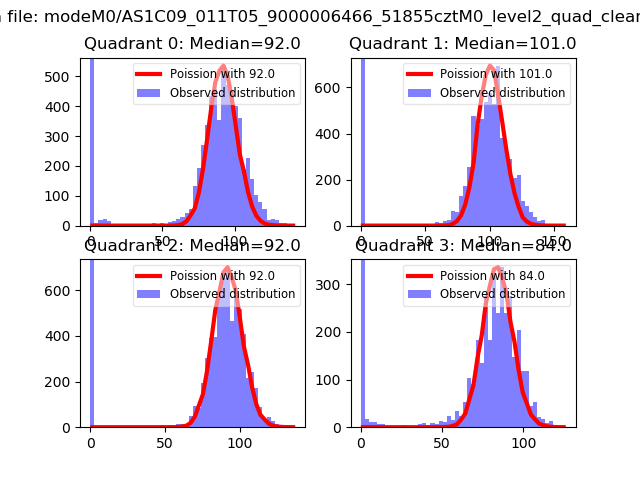 |
 |
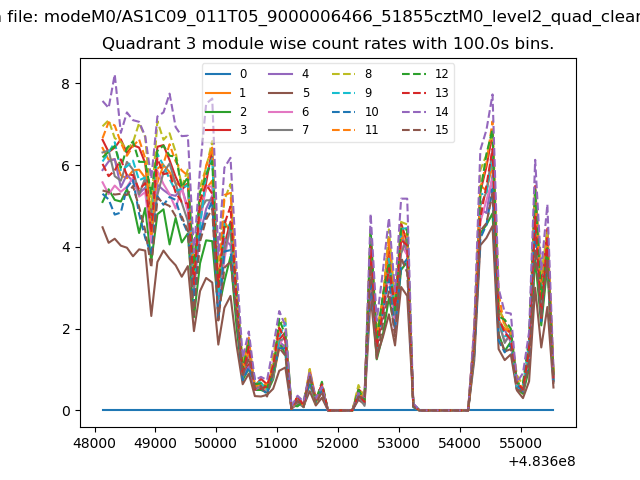
| Quadrant-wise count rates Data is divided into 100 sec bins |
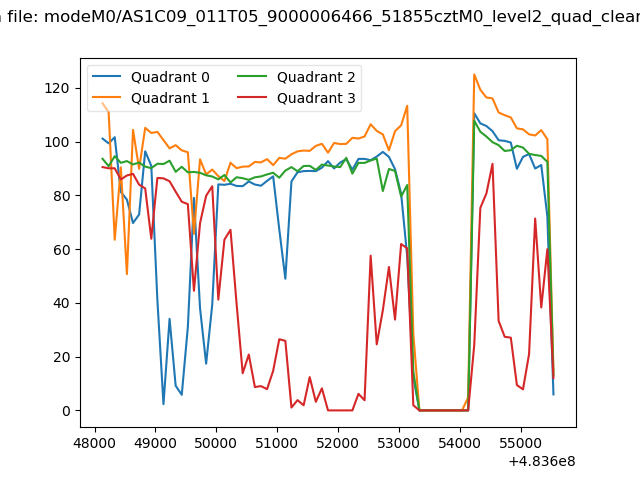 |
|
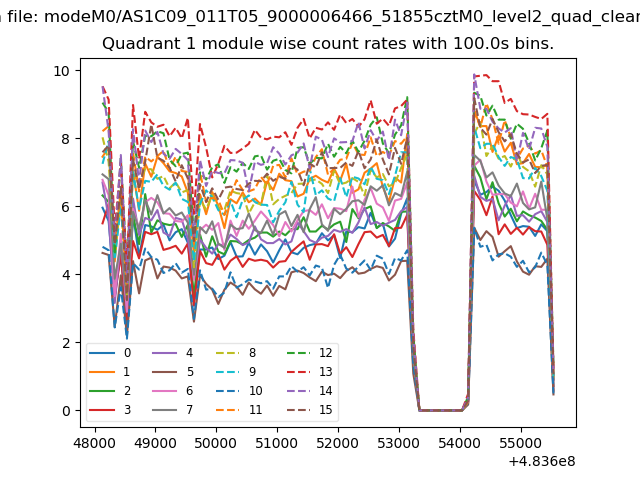
| Module-wise count rates for Quadrant A Data is divided into 100 sec bins |
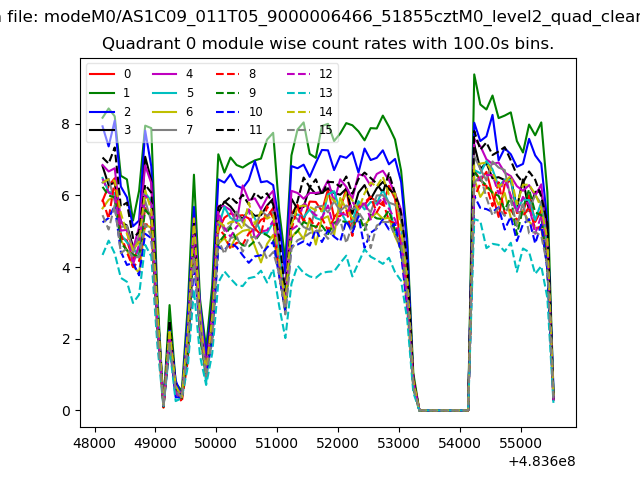 |
 |
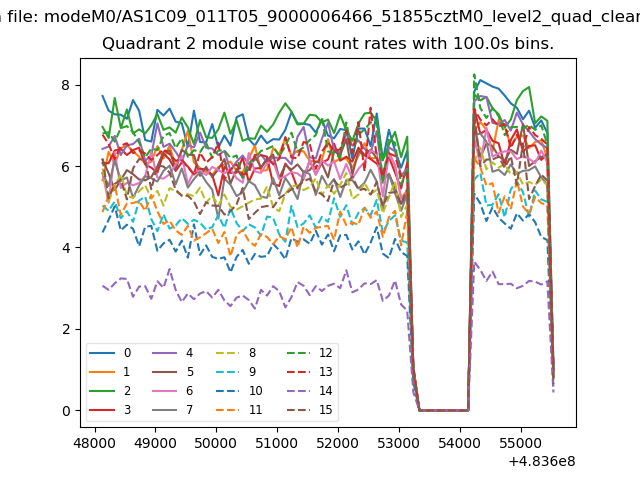
| Module-wise count rates for Quadrant B Data is divided into 100 sec bins |
 |
 |
| Module-wise count rates for Quadrant C Data is divided into 100 sec bins |
 |
 |
| Module-wise count rates for Quadrant D Data is divided into 100 sec bins |
 |
 |
| Parameter | Plot |
|---|---|
| CZT HV Monitor | 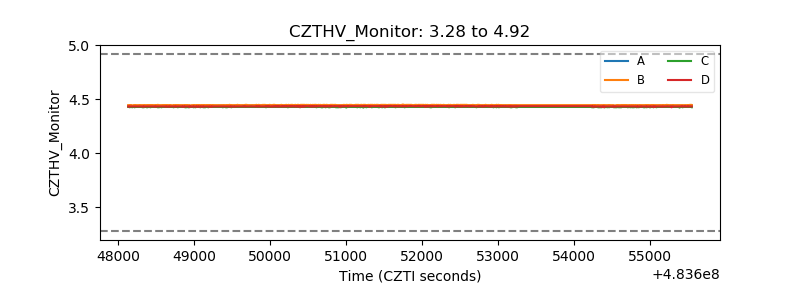 |
| D_VDD | 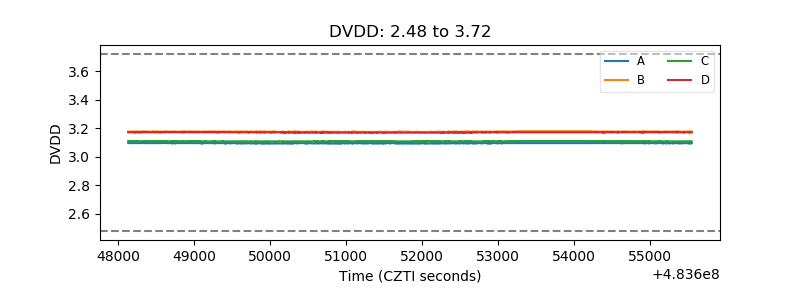 |
| Temperature 1 | 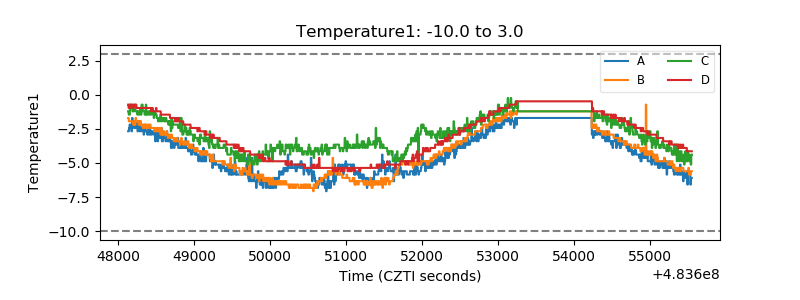 |
| Veto HV Monitor | 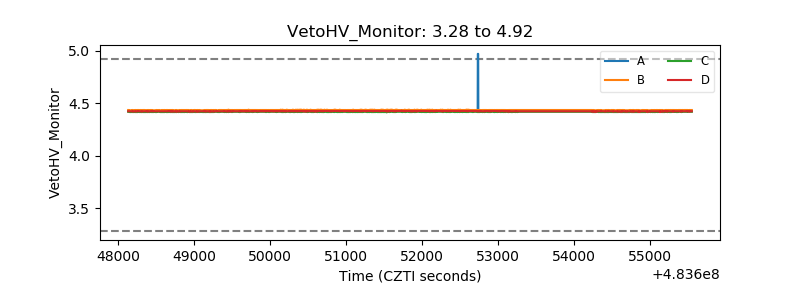 |
| Veto LLD | 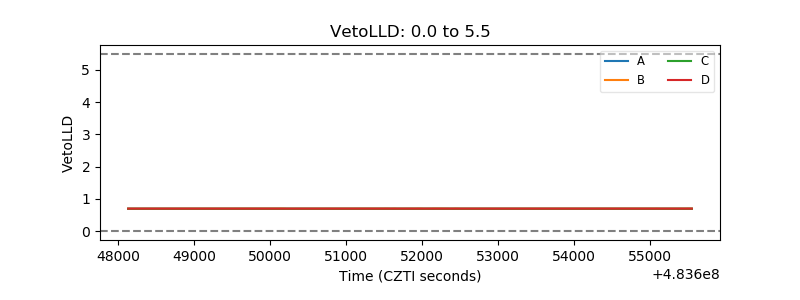 |
| Alpha Counter | 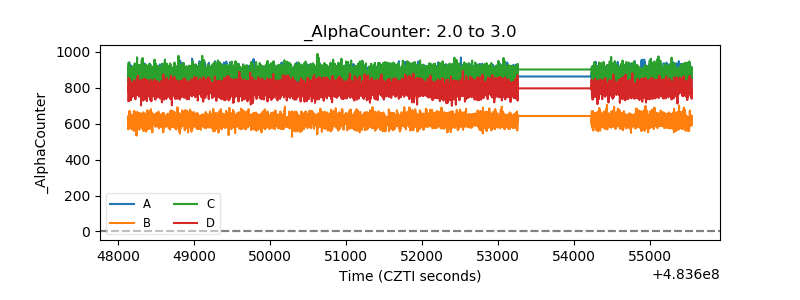 |
| _CPM_Rate | 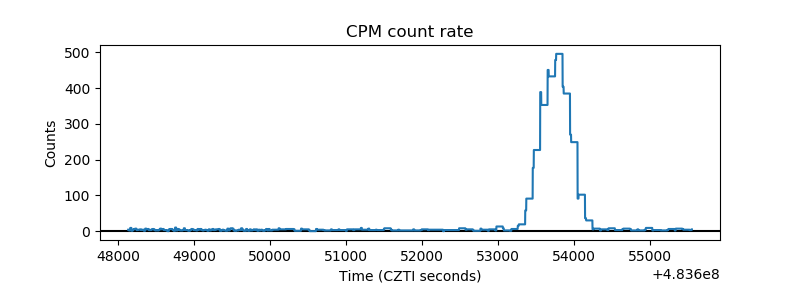 |
| CZT Counter | 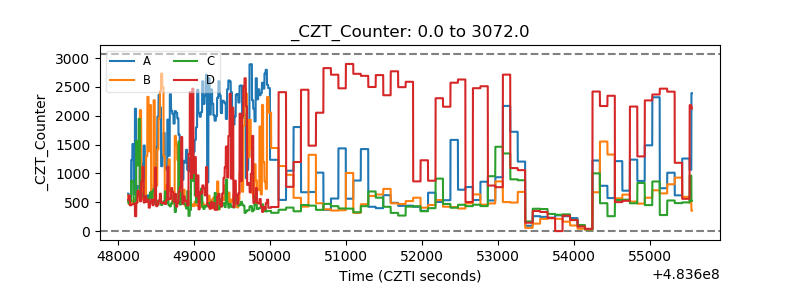 |
| +2.5 Volts monitor | 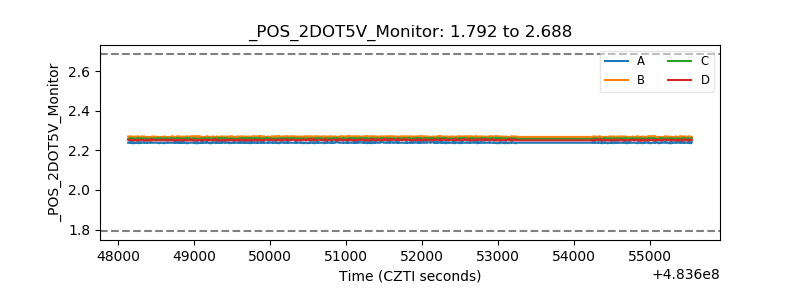 |
| +5 Volts monitor | 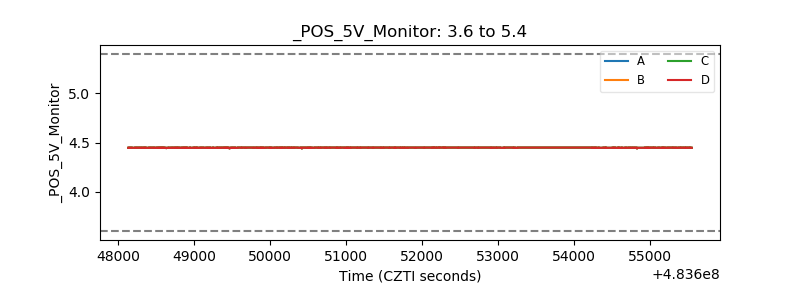 |
| _ROLL_ROT | 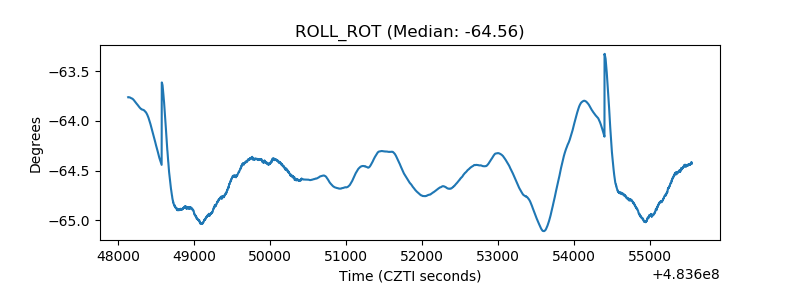 |
| _Roll_DEC | 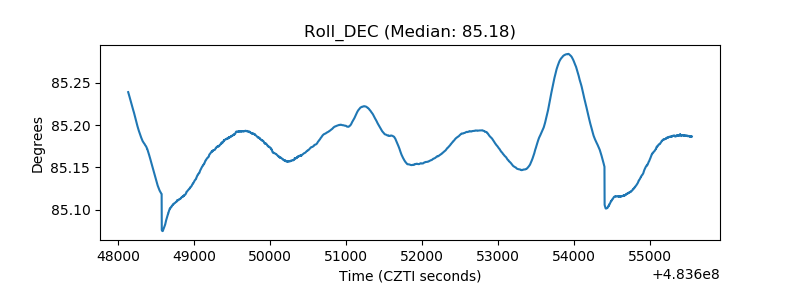 |
| _Roll_RA | 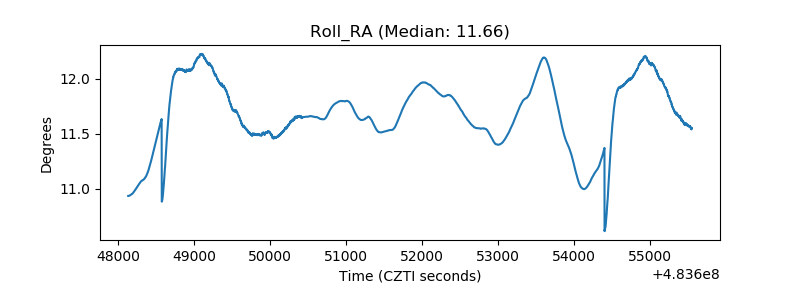 |
| Veto Counter | 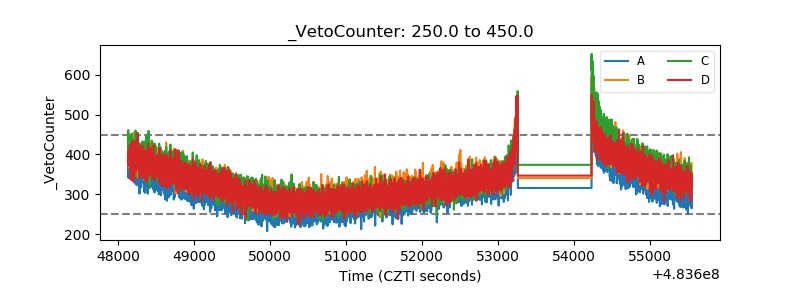 |