| Param | Original file | Final file |
|---|---|---|
| Filename | modeM0/AS1C09_011T05_9000006466_51856cztM0_level2.fits | modeM0/AS1C09_011T05_9000006466_51856cztM0_level2_quad_clean.evt |
| Size (bytes) | 728,965,440 | 87,287,040 |
| Size | 695.2 MB | 83.2 MB |
| Events in quadrant A | 7,493,271 | 567,009 |
| Events in quadrant B | 4,820,645 | 670,987 |
| Events in quadrant C | 3,451,657 | 604,895 |
| Events in quadrant D | 10,715,330 | 346,661 |
| Mode SS | |||
|---|---|---|---|
| Quadrant | BADHDUFLAG | Total packets | Discarded packets |
| A | 0 | 130 | 0 |
| B | 0 | 130 | 0 |
| C | 0 | 130 | 0 |
| D | 0 | 130 | 0 |
| Mode M0 | |||
|---|---|---|---|
| Quadrant | BADHDUFLAG | Total packets | Discarded packets |
| A | 0 | 26893 | 4 |
| B | 0 | 18698 | 2 |
| C | 0 | 14946 | 2 |
| D | 0 | 36360 | 2 |
| Mode M9 | |||
|---|---|---|---|
| Quadrant | BADHDUFLAG | Total packets | Discarded packets |
| A | 0 | 18 | 0 |
| B | 0 | 19 | 0 |
| C | 0 | 19 | 0 |
| D | 0 | 19 | 0 |
| Quadrant | Total seconds | Saturated seconds | Saturation percentage |
|---|---|---|---|
| A | 6502 | 690 | 10.612119% |
| B | 6502 | 150 | 2.306982% |
| C | 6502 | 76 | 1.168871% |
| D | 6502 | 2855 | 43.909566% |
Noise dominated data is calculated using 1-second bins in cleaned event files. If a bin has >2000 counts, and if more than 50% of those come from <1% of pixels, then it is considered to be noise-dominated and hence unusable.
| Quadrant | # 1 sec bins | Bins with >0 counts | Bins with >2000 counts | High rate bins dominated by noise | Noise dominated (total time) | Noise dominated (detector-on time) | Marked lightcurve |
|---|---|---|---|---|---|---|---|
| A | 7583 | 6504 | 654 | 654 | 8.62% | 10.06% | 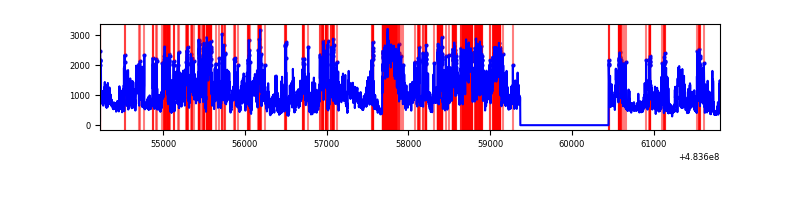 |
| B | 7583 | 6504 | 102 | 102 | 1.35% | 1.57% | 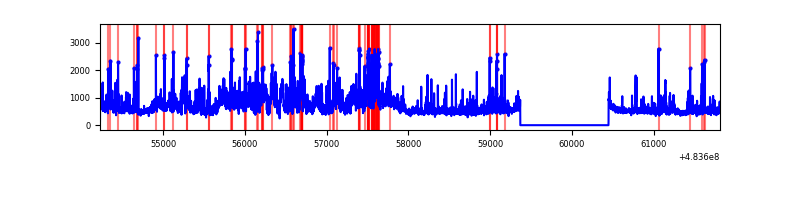 |
| C | 7583 | 6504 | 47 | 47 | 0.62% | 0.72% | 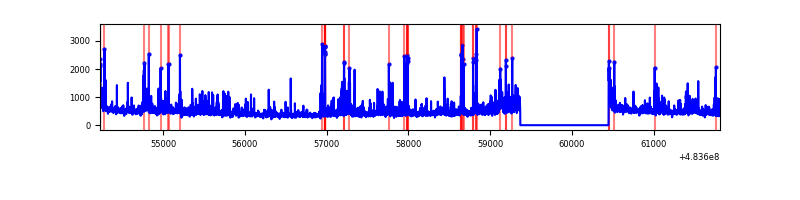 |
| D | 7583 | 6504 | 2736 | 2736 | 36.08% | 42.07% | 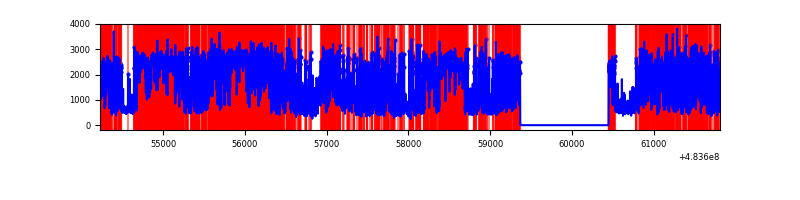 |
Top three noisy pixels from each quadrant. If the there are fewer than three noisy pixels in the level2.evt file, extra rows are filled as -1
| Pixel properties | Quadrant properties | ||||||
|---|---|---|---|---|---|---|---|
| Quadrant | DetID | PixID | Counts | Sigma | Mean | Median | Sigma |
| A | 12 | 3 | 2051393 | 12487.85 | 656 | 640 | 164.2 |
| A | 0 | 228 | 1321803 | 8045.09 | 656 | 640 | 164.2 |
| A | 3 | 63 | 466930 | 2839.43 | 656 | 640 | 164.2 |
| B | 10 | 254 | 671791 | 4677.26 | 679 | 657 | 143.5 |
| B | 10 | 44 | 434740 | 3025.21 | 679 | 657 | 143.5 |
| B | 1 | 255 | 205695 | 1428.95 | 679 | 657 | 143.5 |
| C | 13 | 3 | 198485 | 1054.98 | 674 | 668 | 187.5 |
| C | 15 | 192 | 128560 | 682.06 | 674 | 668 | 187.5 |
| C | 15 | 224 | 106765 | 565.83 | 674 | 668 | 187.5 |
| D | 11 | 129 | 7481459 | 52869.42 | 506 | 487 | 141.5 |
| D | 0 | 18 | 655283 | 4627.57 | 506 | 487 | 141.5 |
| D | 9 | 49 | 87809 | 617.12 | 506 | 487 | 141.5 |
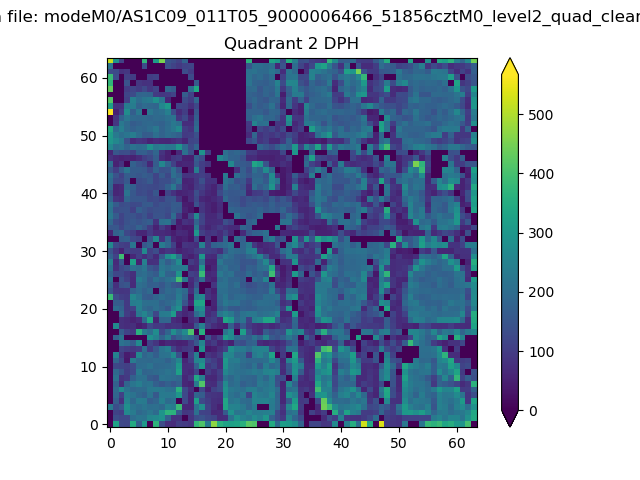
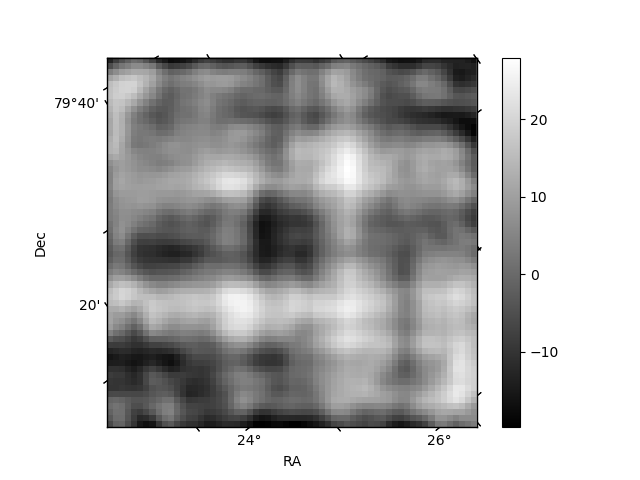
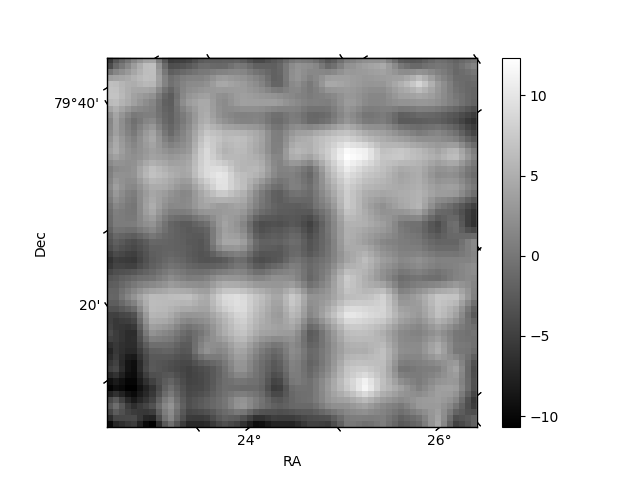
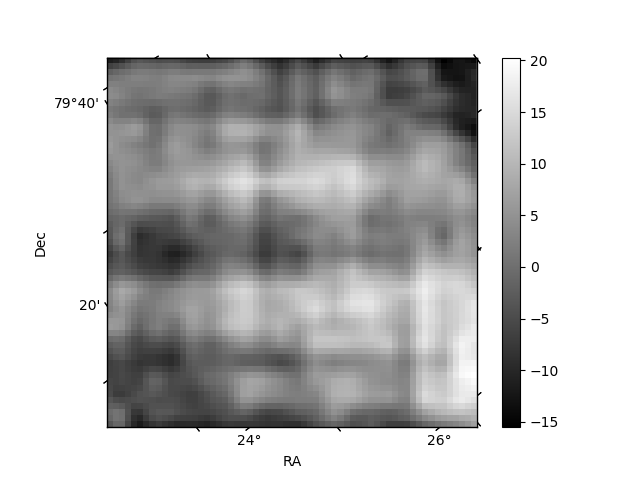
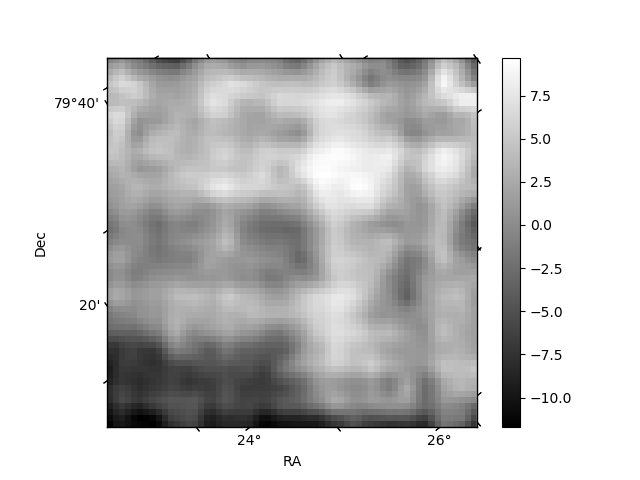
Histogram calculated using DETX and DETY for each event in the final _common_clean file
| Quadrant A | 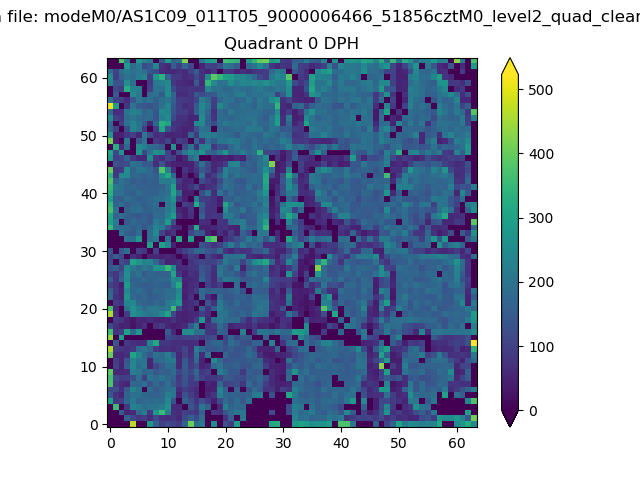 |
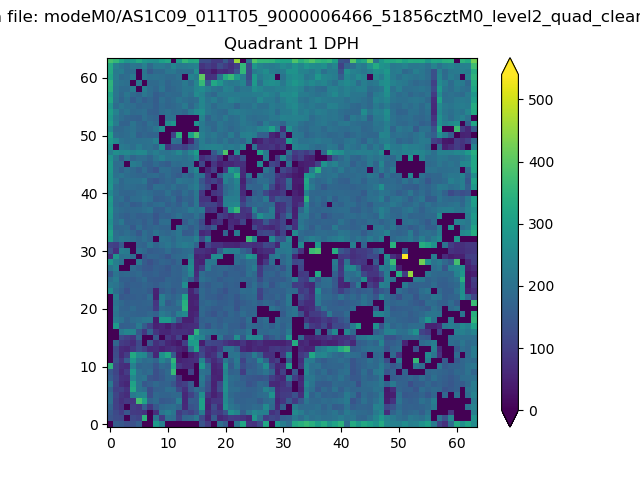 |
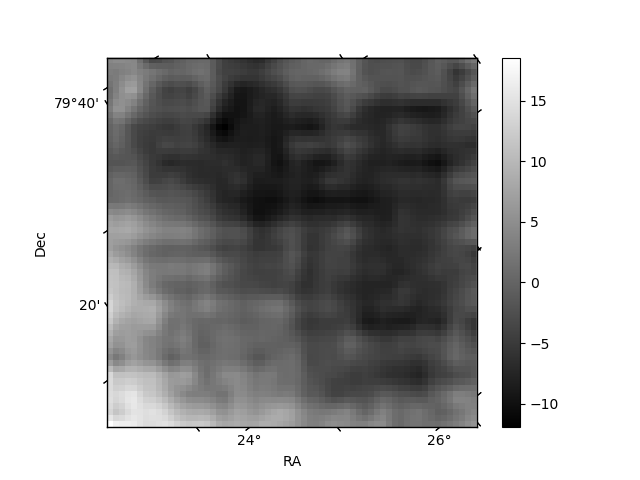
Quadrant B |
|---|---|---|---|
| Quadrant D | 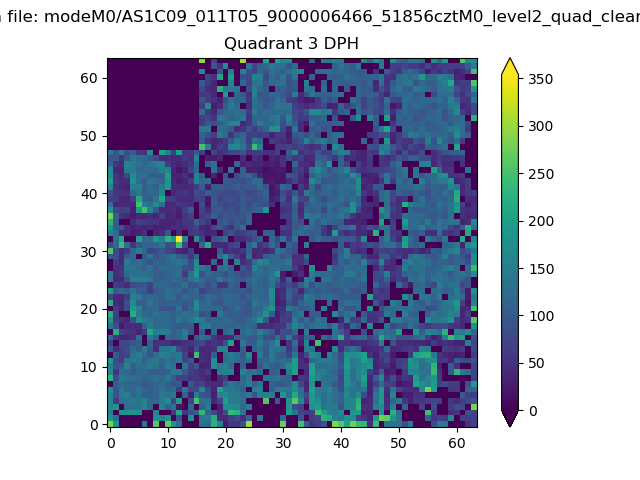 |
 |
Quadrant C |
| Plot type | Count rate plots | Images |
|---|---|---|
| Comparison with Poisson distribution Blue bars denote a histogram of data divided into 1 sec bins. Red curve is a Poisson curve with rate = median count rate of data. |
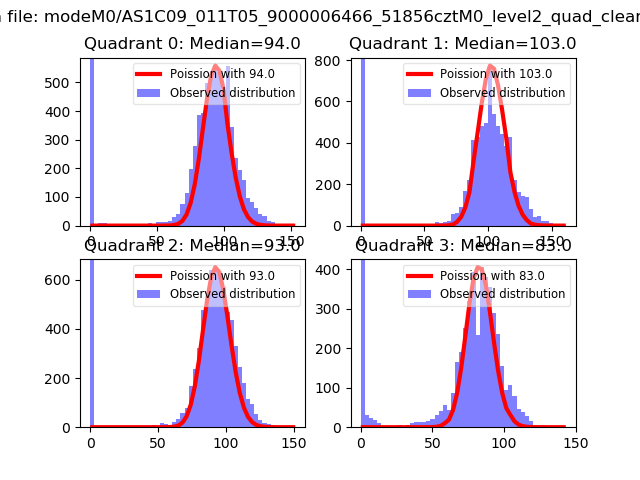 |
 |
| Quadrant-wise count rates Data is divided into 100 sec bins |
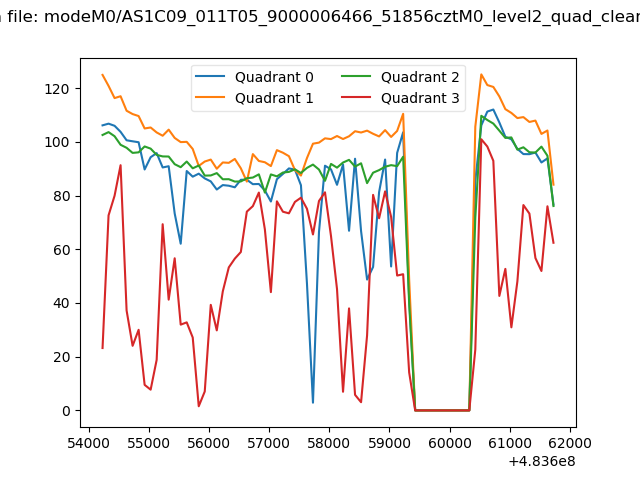 |
|
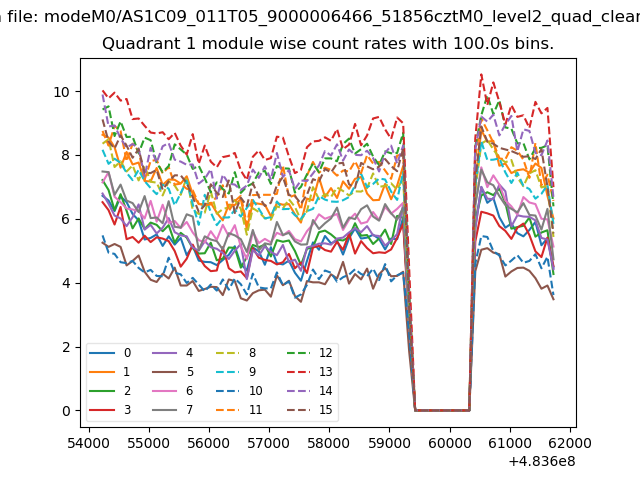
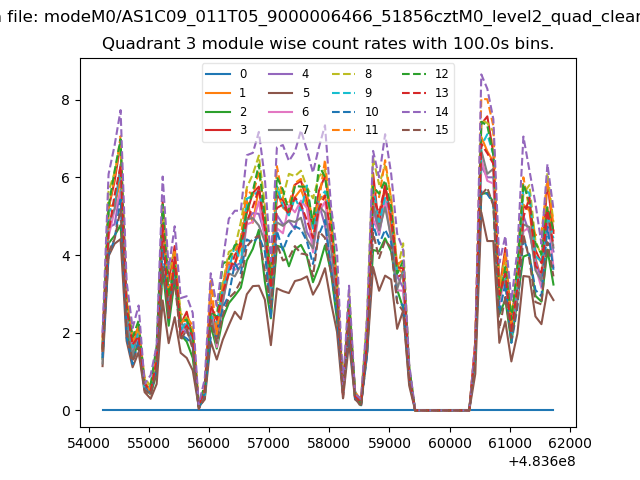
| Module-wise count rates for Quadrant A Data is divided into 100 sec bins |
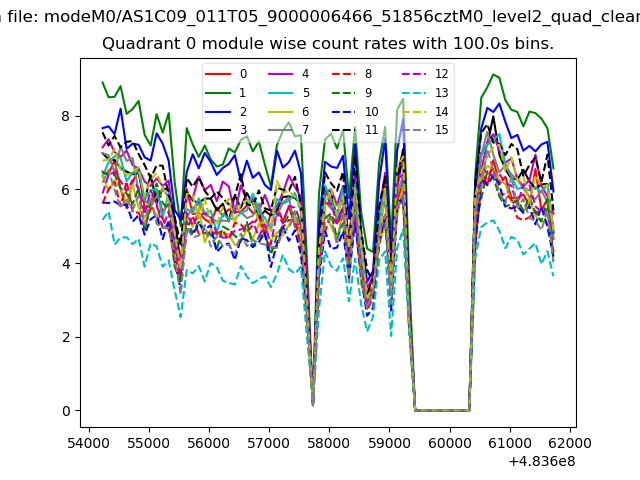 |
 |
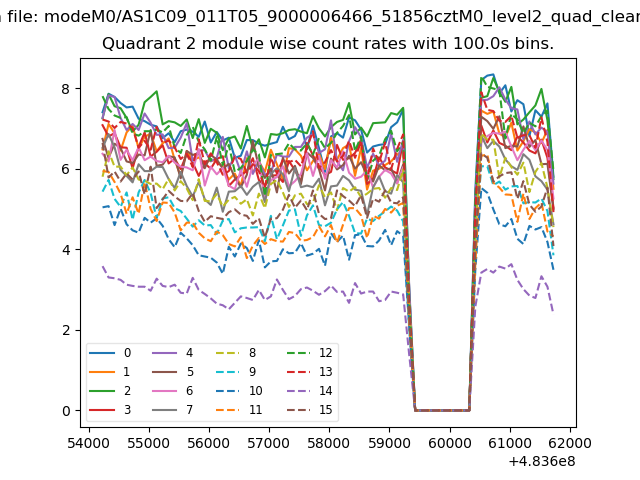
| Module-wise count rates for Quadrant B Data is divided into 100 sec bins |
 |
 |
| Module-wise count rates for Quadrant C Data is divided into 100 sec bins |
 |
 |
| Module-wise count rates for Quadrant D Data is divided into 100 sec bins |
 |
 |
| Parameter | Plot |
|---|---|
| CZT HV Monitor | 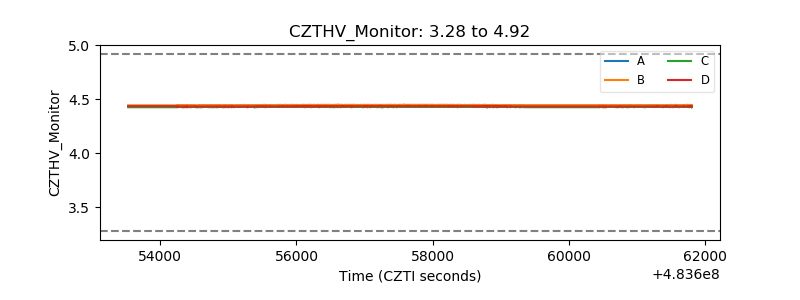 |
| D_VDD | 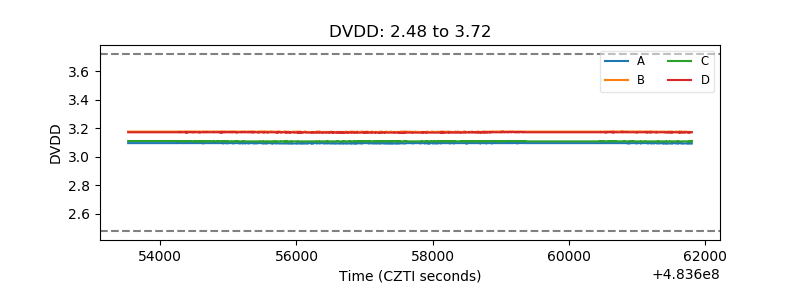 |
| Temperature 1 | 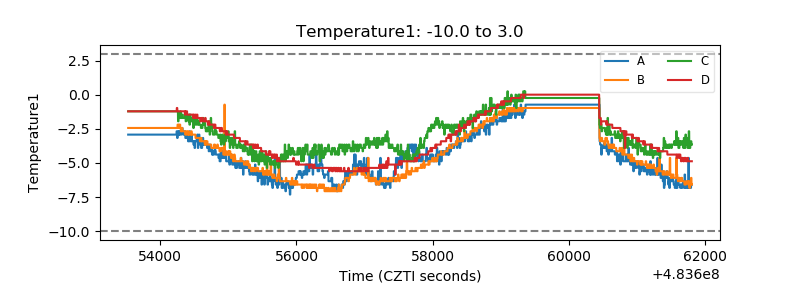 |
| Veto HV Monitor | 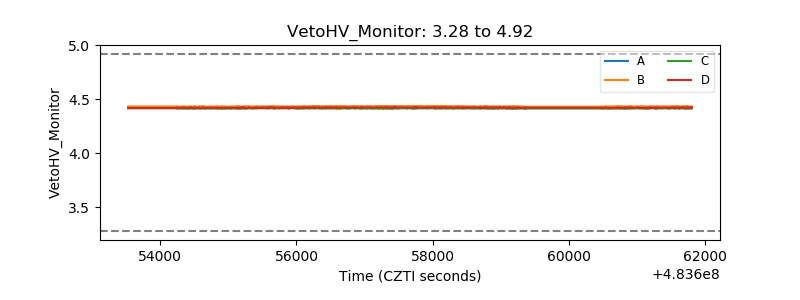 |
| Veto LLD | 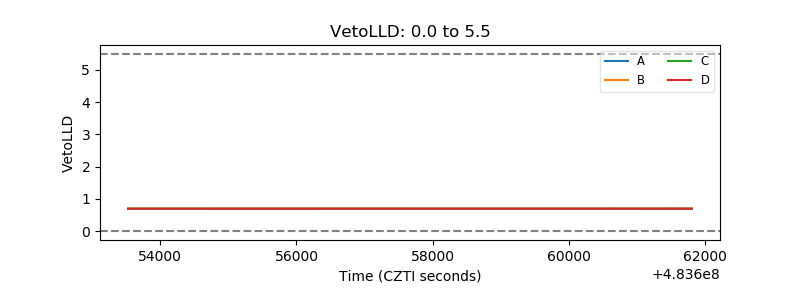 |
| Alpha Counter | 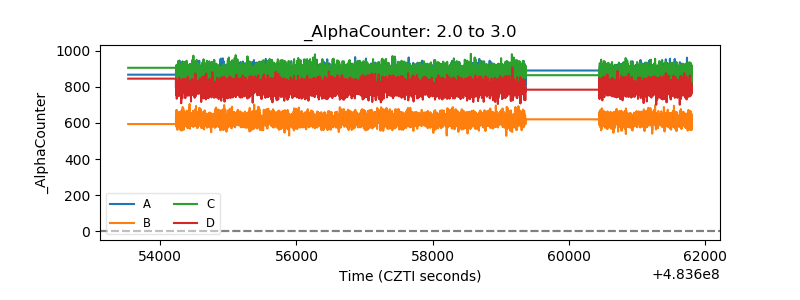 |
| _CPM_Rate | 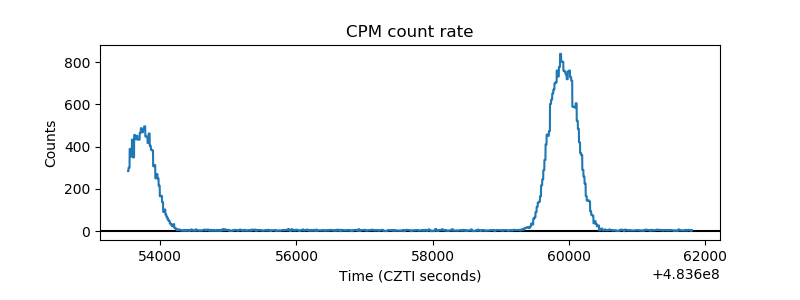 |
| CZT Counter | 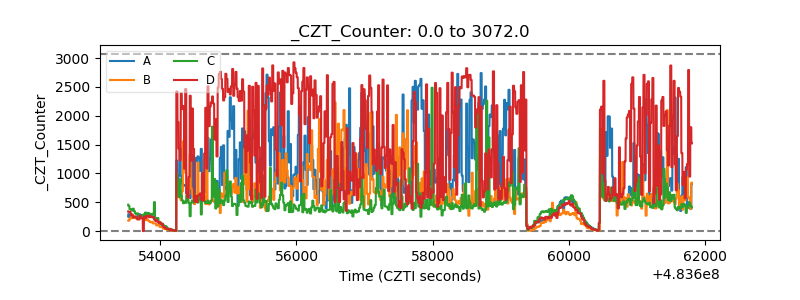 |
| +2.5 Volts monitor | 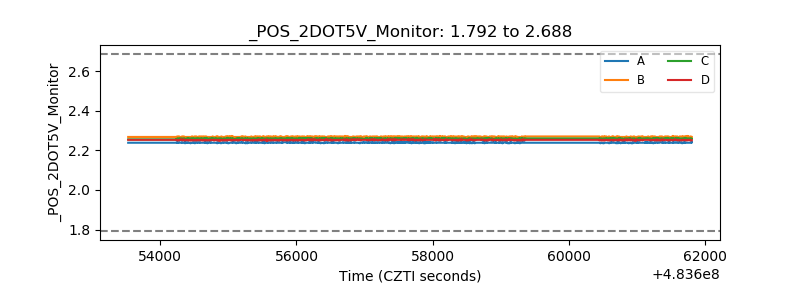 |
| +5 Volts monitor | 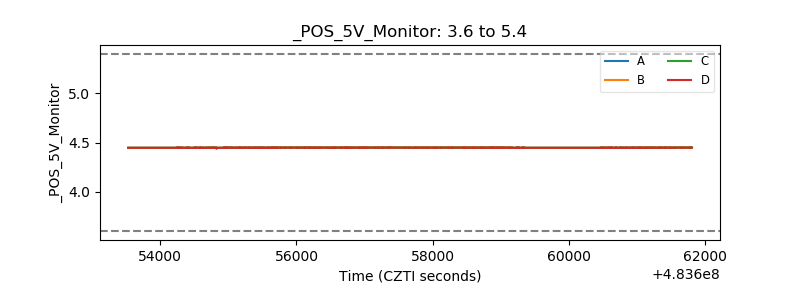 |
| _ROLL_ROT | 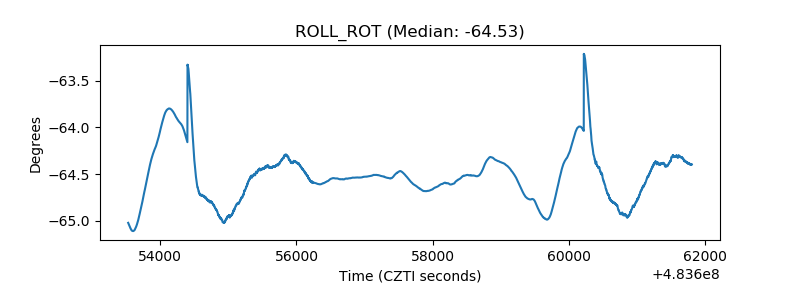 |
| _Roll_DEC | 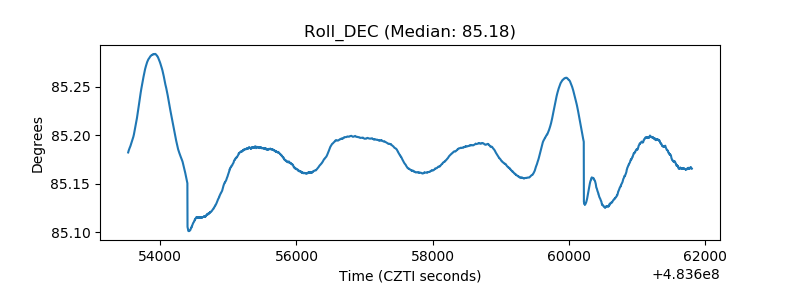 |
| _Roll_RA | 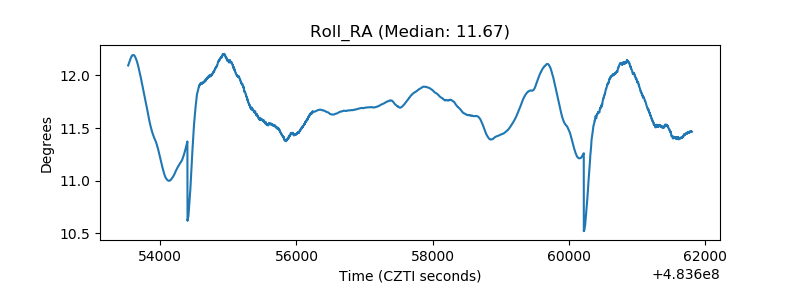 |
| Veto Counter | 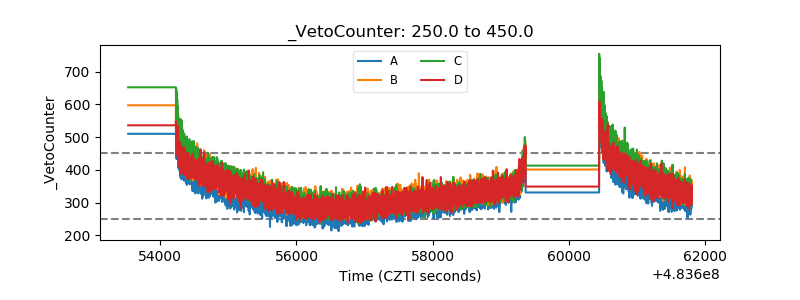 |