| Param | Original file | Final file |
|---|---|---|
| Filename | modeM0/AS1C09_011T05_9000006466_51857cztM0_level2.fits | modeM0/AS1C09_011T05_9000006466_51857cztM0_level2_quad_clean.evt |
| Size (bytes) | 650,949,120 | 93,496,320 |
| Size | 620.8 MB | 89.2 MB |
| Events in quadrant A | 5,917,262 | 615,622 |
| Events in quadrant B | 4,248,194 | 705,665 |
| Events in quadrant C | 3,498,583 | 638,722 |
| Events in quadrant D | 9,908,167 | 399,651 |
| Mode SS | |||
|---|---|---|---|
| Quadrant | BADHDUFLAG | Total packets | Discarded packets |
| A | 0 | 138 | 0 |
| B | 0 | 138 | 0 |
| C | 0 | 138 | 0 |
| D | 0 | 138 | 0 |
| Mode M0 | |||
|---|---|---|---|
| Quadrant | BADHDUFLAG | Total packets | Discarded packets |
| A | 0 | 22319 | 2 |
| B | 0 | 17231 | 2 |
| C | 0 | 15378 | 2 |
| D | 0 | 34159 | 3 |
| Mode M9 | |||
|---|---|---|---|
| Quadrant | BADHDUFLAG | Total packets | Discarded packets |
| A | 0 | 17 | 0 |
| B | 0 | 18 | 0 |
| C | 0 | 18 | 0 |
| D | 0 | 18 | 0 |
| Quadrant | Total seconds | Saturated seconds | Saturation percentage |
|---|---|---|---|
| A | 6756 | 443 | 6.557134% |
| B | 6756 | 145 | 2.146240% |
| C | 6756 | 91 | 1.346951% |
| D | 6755 | 2492 | 36.891192% |
Noise dominated data is calculated using 1-second bins in cleaned event files. If a bin has >2000 counts, and if more than 50% of those come from <1% of pixels, then it is considered to be noise-dominated and hence unusable.
| Quadrant | # 1 sec bins | Bins with >0 counts | Bins with >2000 counts | High rate bins dominated by noise | Noise dominated (total time) | Noise dominated (detector-on time) | Marked lightcurve |
|---|---|---|---|---|---|---|---|
| A | 7912 | 6758 | 334 | 334 | 4.22% | 4.94% | 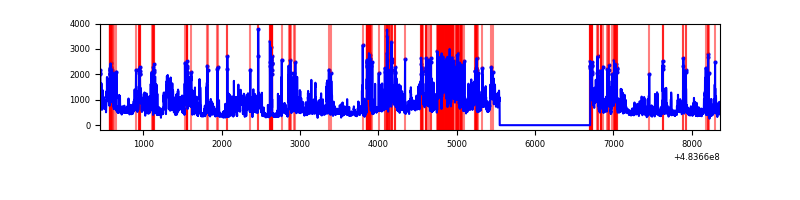 |
| B | 7912 | 6758 | 75 | 75 | 0.95% | 1.11% | 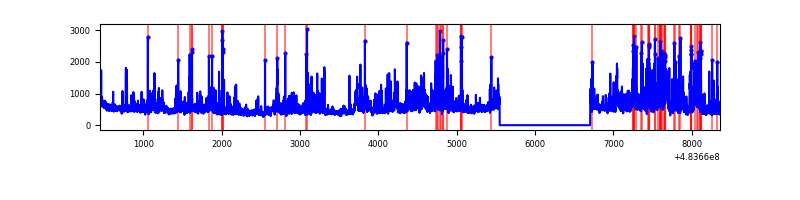 |
| C | 7912 | 6758 | 58 | 58 | 0.73% | 0.86% | 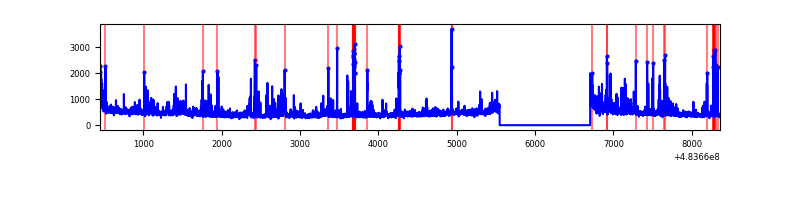 |
| D | 7911 | 6756 | 2389 | 2389 | 30.20% | 35.36% |  |
Top three noisy pixels from each quadrant. If the there are fewer than three noisy pixels in the level2.evt file, extra rows are filled as -1
| Pixel properties | Quadrant properties | ||||||
|---|---|---|---|---|---|---|---|
| Quadrant | DetID | PixID | Counts | Sigma | Mean | Median | Sigma |
| A | 0 | 228 | 920214 | 5262.85 | 692 | 676 | 174.7 |
| A | 12 | 3 | 913224 | 5222.84 | 692 | 676 | 174.7 |
| A | 5 | 240 | 325967 | 1861.76 | 692 | 676 | 174.7 |
| B | 10 | 44 | 206287 | 1381.8 | 708 | 684 | 148.8 |
| B | 0 | 171 | 156855 | 1049.58 | 708 | 684 | 148.8 |
| B | 4 | 81 | 146288 | 978.57 | 708 | 684 | 148.8 |
| C | 13 | 3 | 279392 | 1446.79 | 698 | 691 | 192.6 |
| C | 15 | 224 | 103087 | 531.56 | 698 | 691 | 192.6 |
| C | 10 | 22 | 72486 | 372.7 | 698 | 691 | 192.6 |
| D | 11 | 129 | 6647421 | 43923.74 | 535 | 515 | 151.3 |
| D | 3 | 12 | 240462 | 1585.61 | 535 | 515 | 151.3 |
| D | 7 | 96 | 208292 | 1373.02 | 535 | 515 | 151.3 |
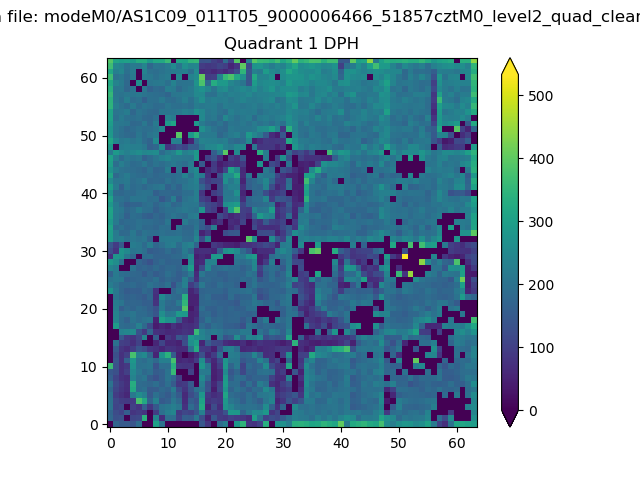
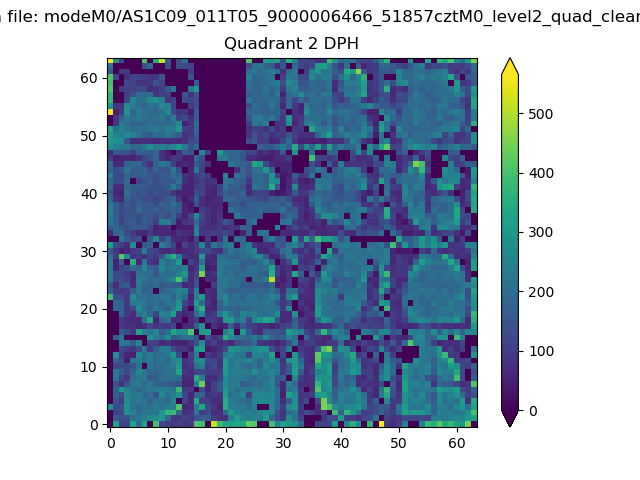
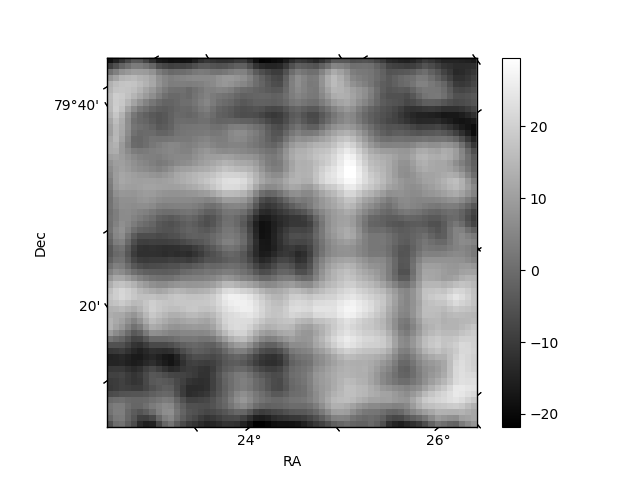
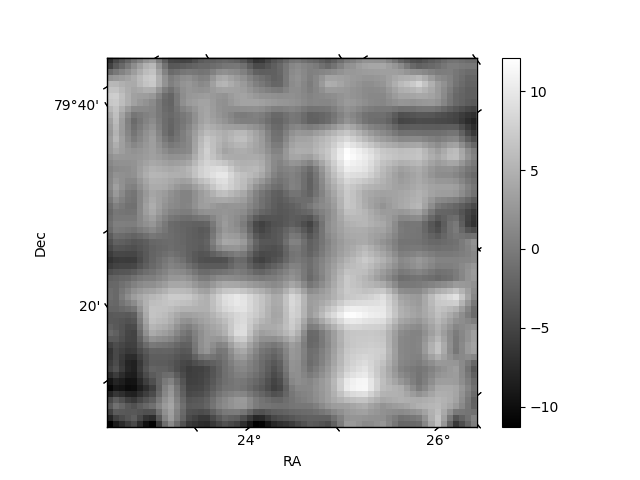
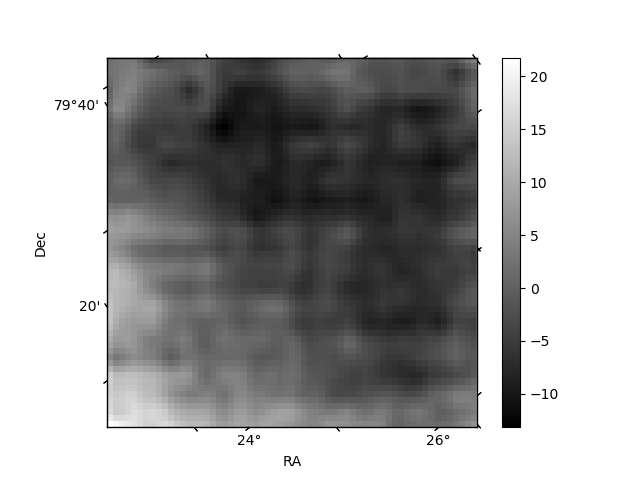
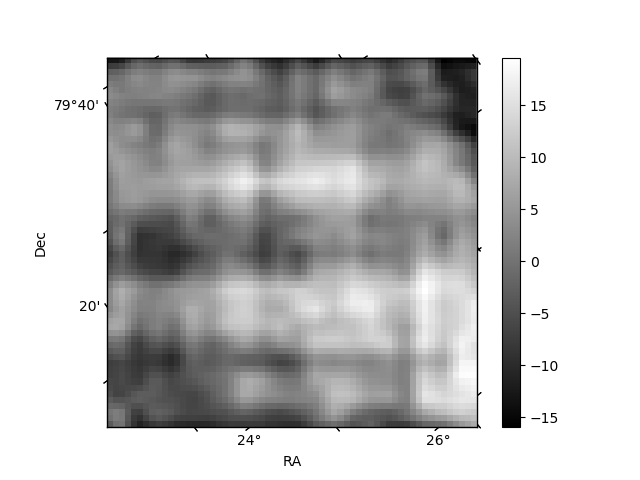
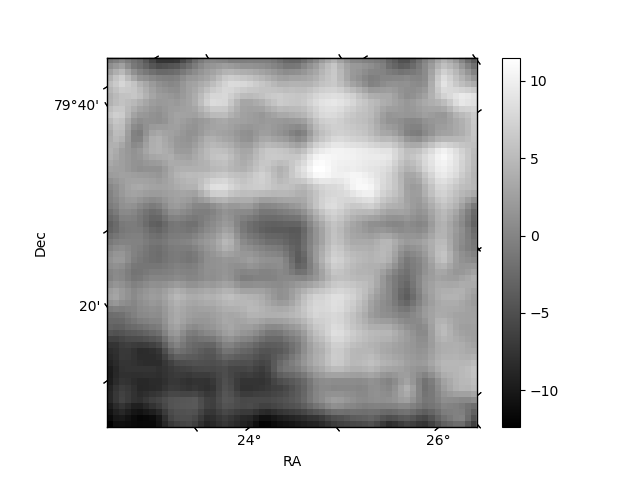
Histogram calculated using DETX and DETY for each event in the final _common_clean file
| Quadrant A | 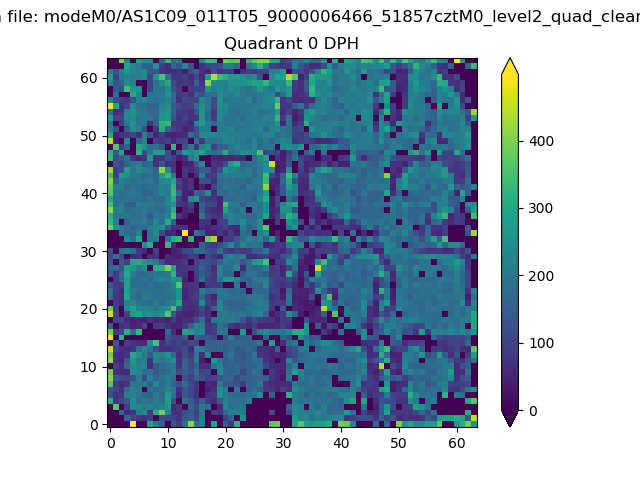 |
 |
Quadrant B |
|---|---|---|---|
| Quadrant D | 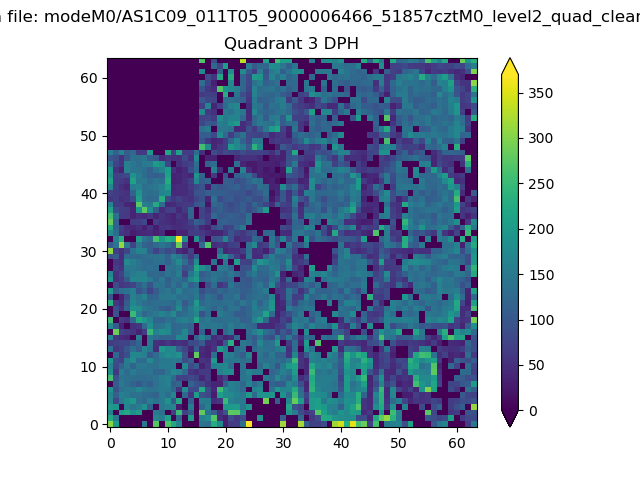 |
 |
Quadrant C |
| Plot type | Count rate plots | Images |
|---|---|---|
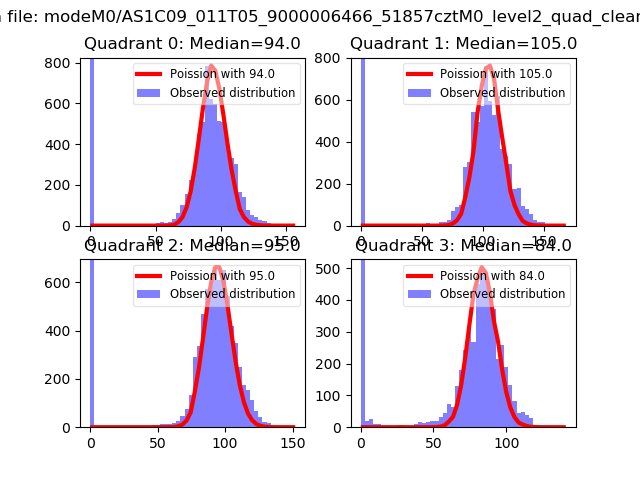
| Comparison with Poisson distribution Blue bars denote a histogram of data divided into 1 sec bins. Red curve is a Poisson curve with rate = median count rate of data. |
 |
 |
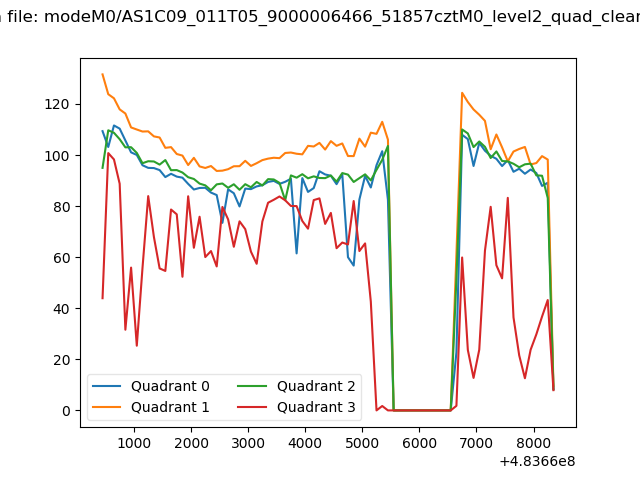
| Quadrant-wise count rates Data is divided into 100 sec bins |
 |
|
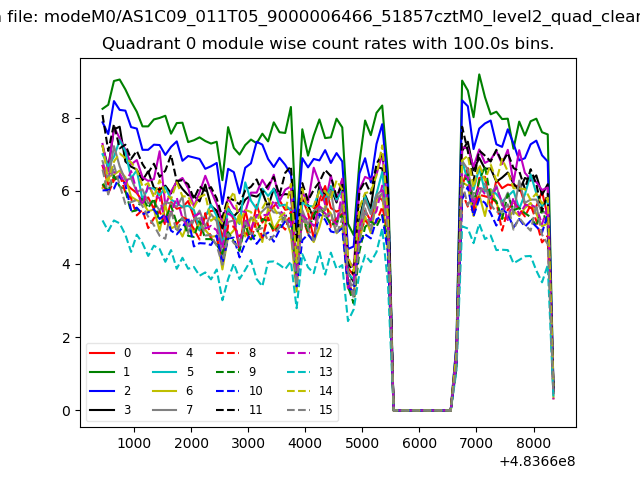
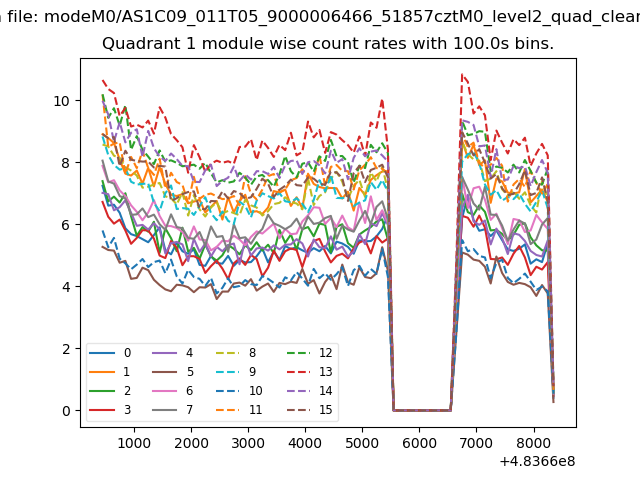
| Module-wise count rates for Quadrant A Data is divided into 100 sec bins |
 |
 |
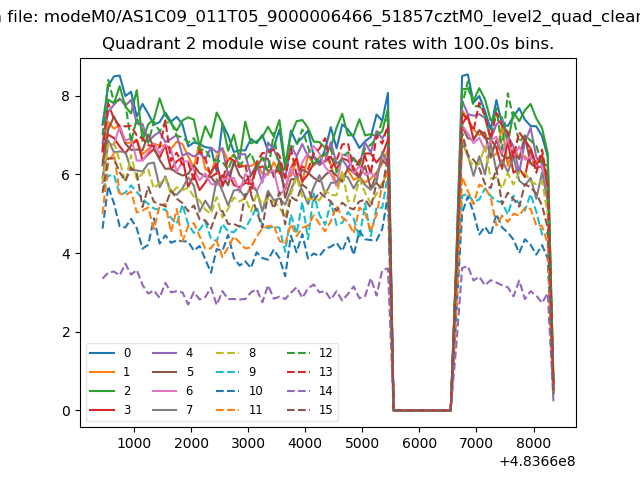
| Module-wise count rates for Quadrant B Data is divided into 100 sec bins |
 |
 |
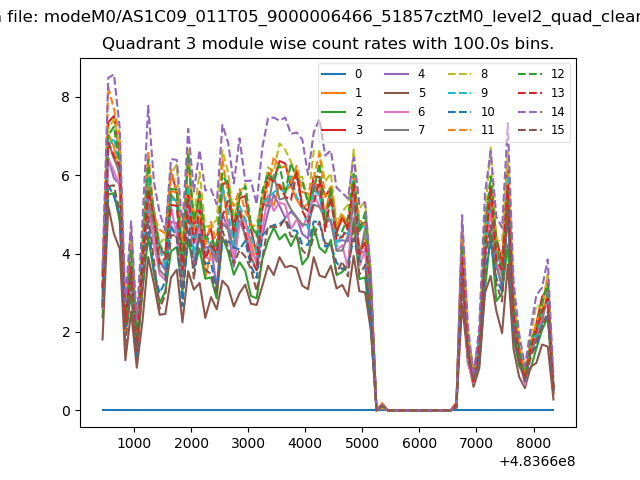
| Module-wise count rates for Quadrant C Data is divided into 100 sec bins |
 |
 |
| Module-wise count rates for Quadrant D Data is divided into 100 sec bins |
 |
 |
| Parameter | Plot |
|---|---|
| CZT HV Monitor | 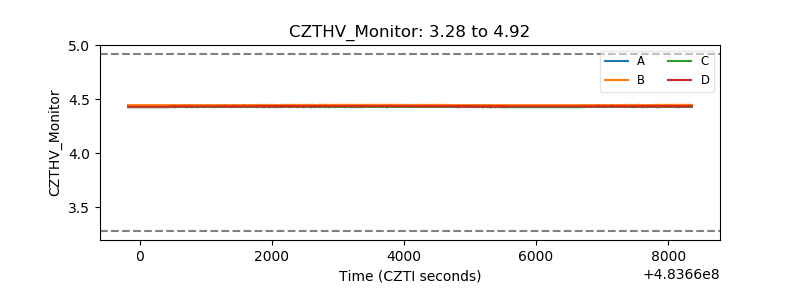 |
| D_VDD | 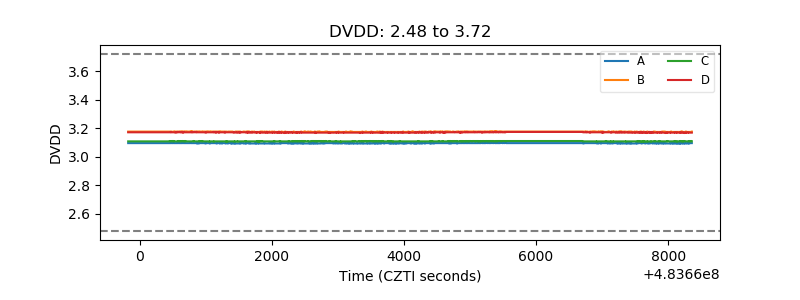 |
| Temperature 1 | 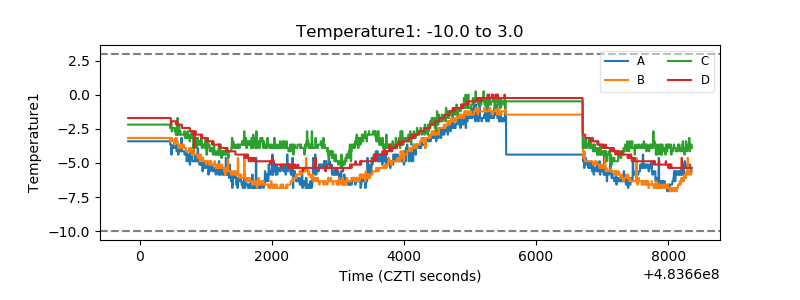 |
| Veto HV Monitor | 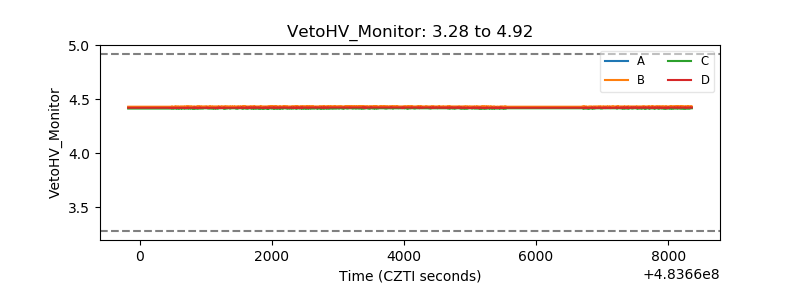 |
| Veto LLD | 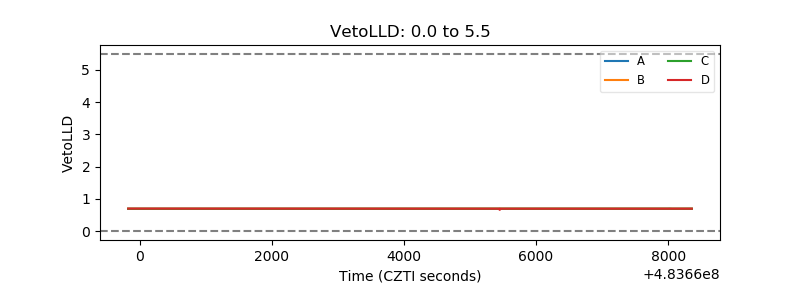 |
| Alpha Counter | 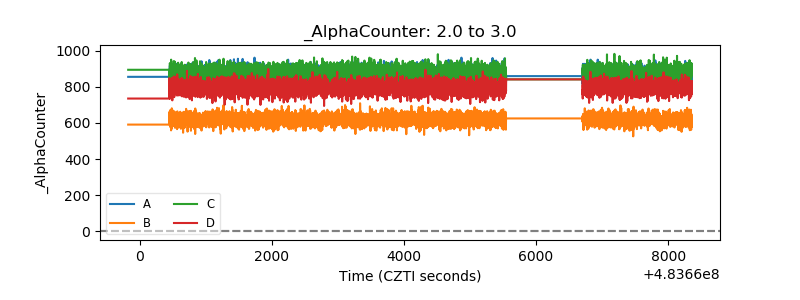 |
| _CPM_Rate | 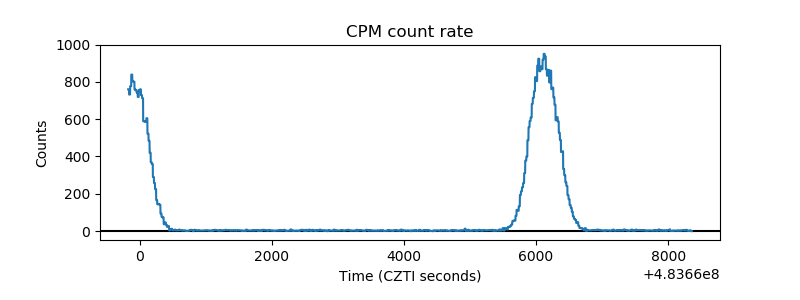 |
| CZT Counter | 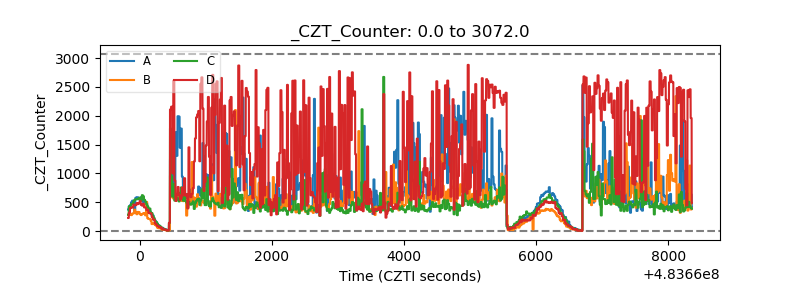 |
| +2.5 Volts monitor | 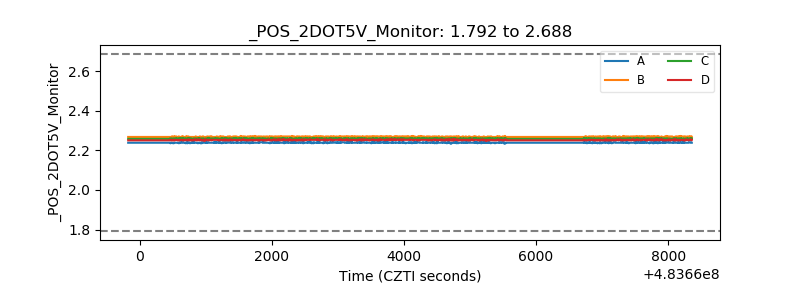 |
| +5 Volts monitor |  |
| _ROLL_ROT | 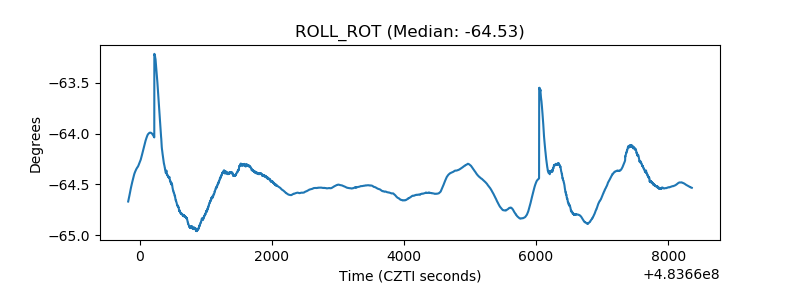 |
| _Roll_DEC | 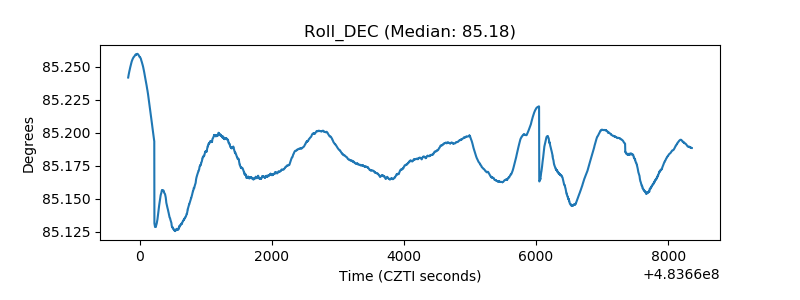 |
| _Roll_RA | 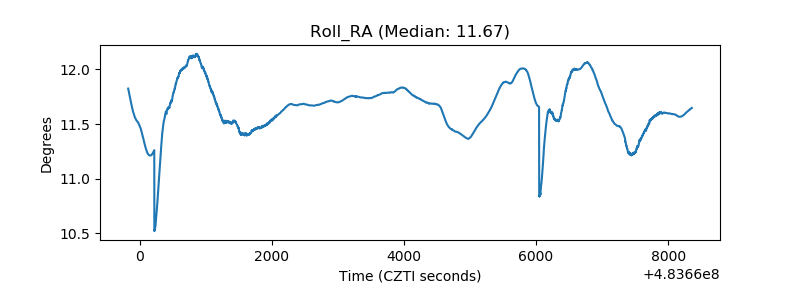 |
| Veto Counter | 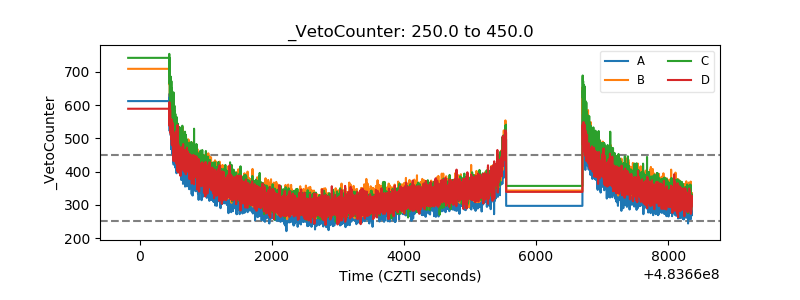 |