| Param | Original file | Final file |
|---|---|---|
| Filename | modeM0/AS1C09_011T05_9000006466_51859cztM0_level2.fits | modeM0/AS1C09_011T05_9000006466_51859cztM0_level2_quad_clean.evt |
| Size (bytes) | 607,366,080 | 93,015,360 |
| Size | 579.2 MB | 88.7 MB |
| Events in quadrant A | 4,852,229 | 626,098 |
| Events in quadrant B | 3,729,314 | 699,485 |
| Events in quadrant C | 3,644,138 | 623,634 |
| Events in quadrant D | 9,735,430 | 398,085 |
| Mode SS | |||
|---|---|---|---|
| Quadrant | BADHDUFLAG | Total packets | Discarded packets |
| A | 0 | 138 | 0 |
| B | 0 | 138 | 0 |
| C | 0 | 138 | 0 |
| D | 0 | 138 | 0 |
| Mode M0 | |||
|---|---|---|---|
| Quadrant | BADHDUFLAG | Total packets | Discarded packets |
| A | 0 | 19105 | 2 |
| B | 0 | 15875 | 2 |
| C | 0 | 15852 | 2 |
| D | 0 | 33649 | 2 |
| Mode M9 | |||
|---|---|---|---|
| Quadrant | BADHDUFLAG | Total packets | Discarded packets |
| A | 0 | 17 | 0 |
| B | 0 | 17 | 0 |
| C | 0 | 17 | 0 |
| D | 0 | 18 | 0 |
| Quadrant | Total seconds | Saturated seconds | Saturation percentage |
|---|---|---|---|
| A | 6724 | 167 | 2.483641% |
| B | 6724 | 115 | 1.710291% |
| C | 6723 | 103 | 1.532054% |
| D | 6723 | 2393 | 35.594229% |
Noise dominated data is calculated using 1-second bins in cleaned event files. If a bin has >2000 counts, and if more than 50% of those come from <1% of pixels, then it is considered to be noise-dominated and hence unusable.
| Quadrant | # 1 sec bins | Bins with >0 counts | Bins with >2000 counts | High rate bins dominated by noise | Noise dominated (total time) | Noise dominated (detector-on time) | Marked lightcurve |
|---|---|---|---|---|---|---|---|
| A | 7816 | 6726 | 121 | 121 | 1.55% | 1.80% | 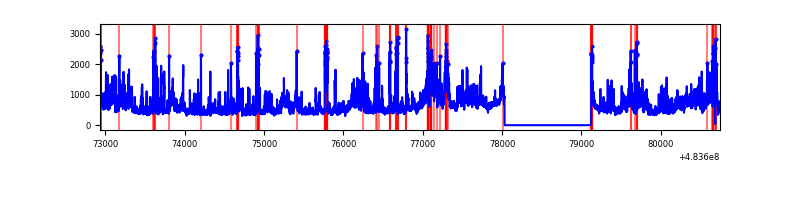 |
| B | 7816 | 6725 | 56 | 56 | 0.72% | 0.83% | 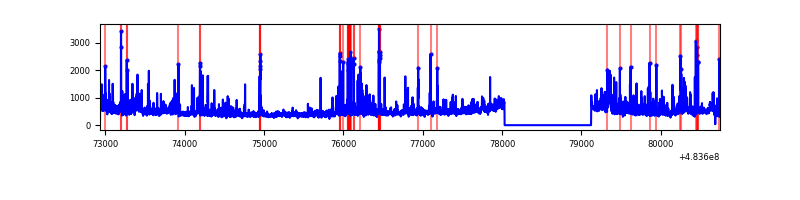 |
| C | 7815 | 6724 | 60 | 60 | 0.77% | 0.89% | 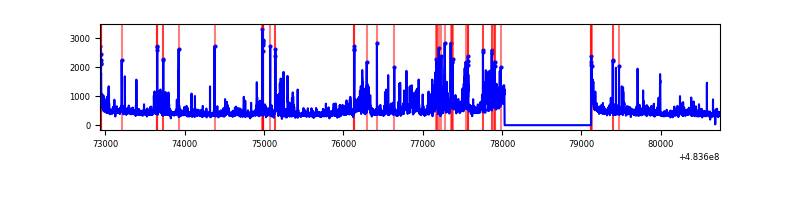 |
| D | 7815 | 6725 | 2322 | 2322 | 29.71% | 34.53% | 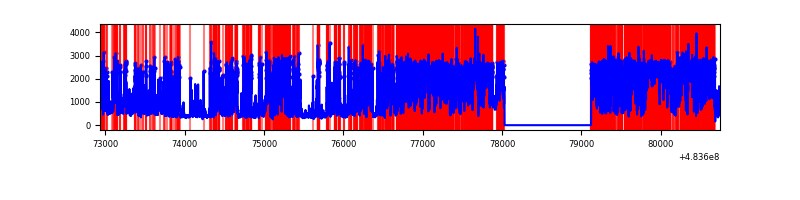 |
Top three noisy pixels from each quadrant. If the there are fewer than three noisy pixels in the level2.evt file, extra rows are filled as -1
| Pixel properties | Quadrant properties | ||||||
|---|---|---|---|---|---|---|---|
| Quadrant | DetID | PixID | Counts | Sigma | Mean | Median | Sigma |
| A | 12 | 3 | 689090 | 3977.78 | 692 | 674 | 173.1 |
| A | 0 | 228 | 309166 | 1782.52 | 692 | 674 | 173.1 |
| A | 4 | 3 | 187808 | 1081.29 | 692 | 674 | 173.1 |
| B | 5 | 185 | 219207 | 1481.51 | 697 | 672 | 147.5 |
| B | 0 | 171 | 103067 | 694.16 | 697 | 672 | 147.5 |
| B | 0 | 213 | 95349 | 641.84 | 697 | 672 | 147.5 |
| C | 12 | 252 | 195165 | 1038.89 | 678 | 674 | 187.2 |
| C | 10 | 22 | 158548 | 843.3 | 678 | 674 | 187.2 |
| C | 13 | 3 | 155388 | 826.42 | 678 | 674 | 187.2 |
| D | 11 | 129 | 6456235 | 41832.22 | 544 | 524 | 154.3 |
| D | 8 | 176 | 418927 | 2711.2 | 544 | 524 | 154.3 |
| D | 3 | 12 | 188238 | 1216.36 | 544 | 524 | 154.3 |
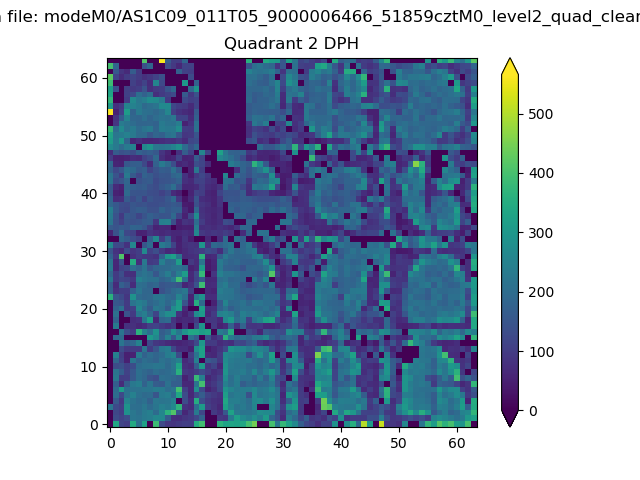
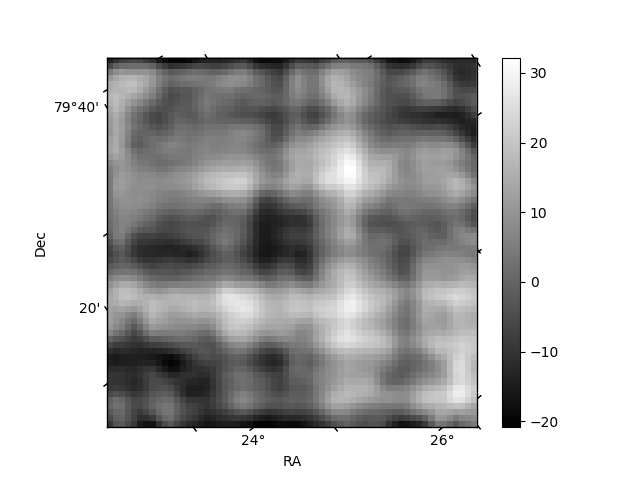
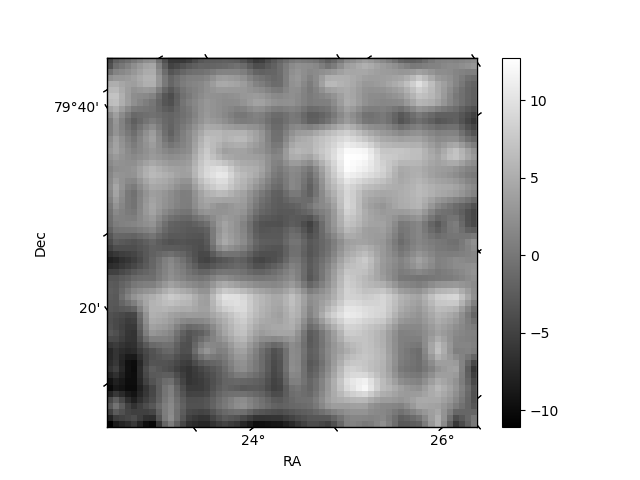
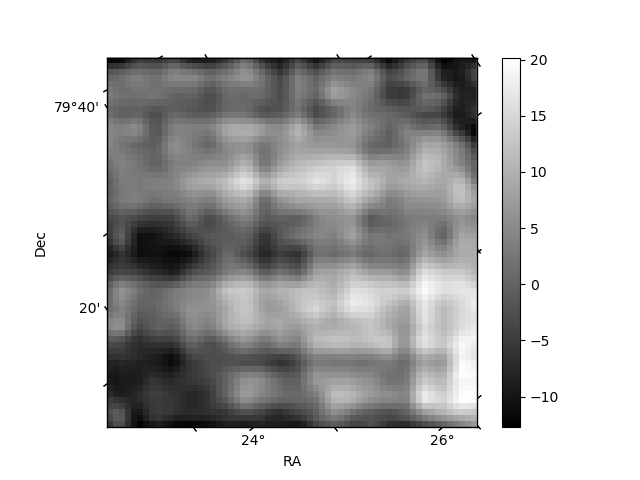
Histogram calculated using DETX and DETY for each event in the final _common_clean file
| Quadrant A | 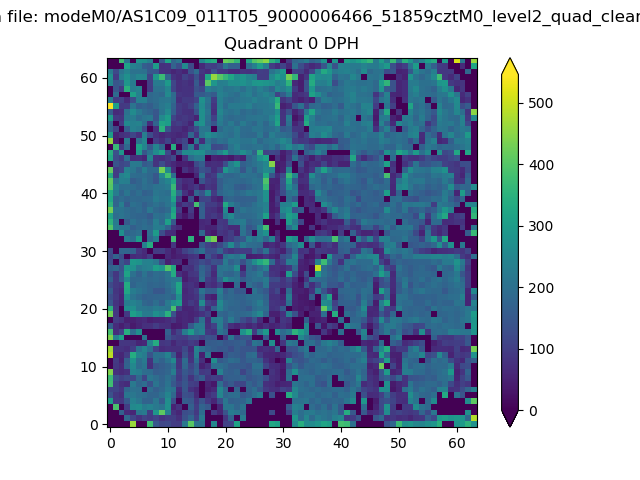 |
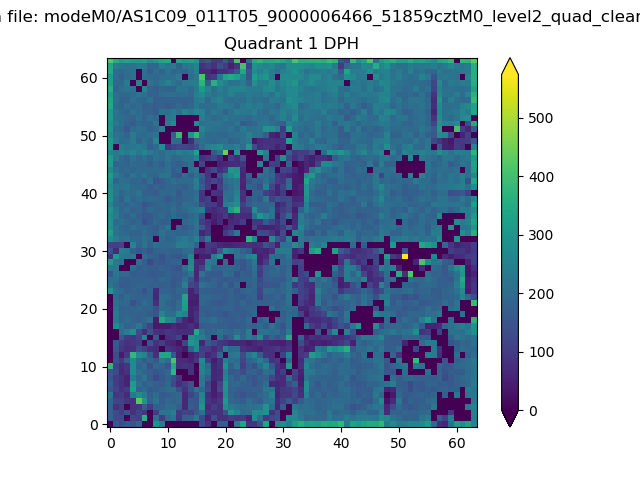 |
Quadrant B |
|---|---|---|---|
| Quadrant D | 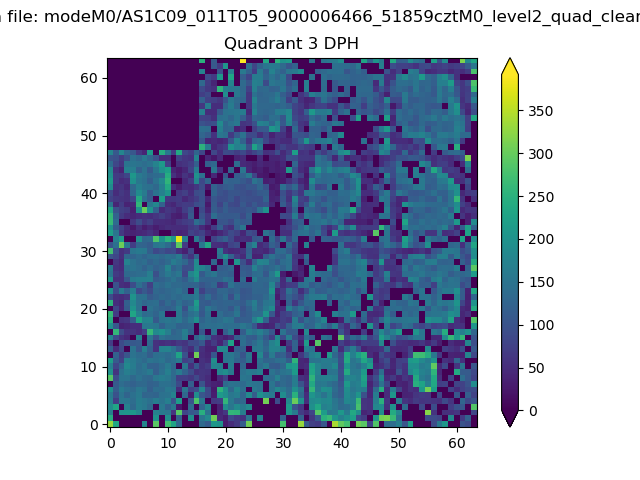 |
 |
Quadrant C |
| Plot type | Count rate plots | Images |
|---|---|---|
| Comparison with Poisson distribution Blue bars denote a histogram of data divided into 1 sec bins. Red curve is a Poisson curve with rate = median count rate of data. |
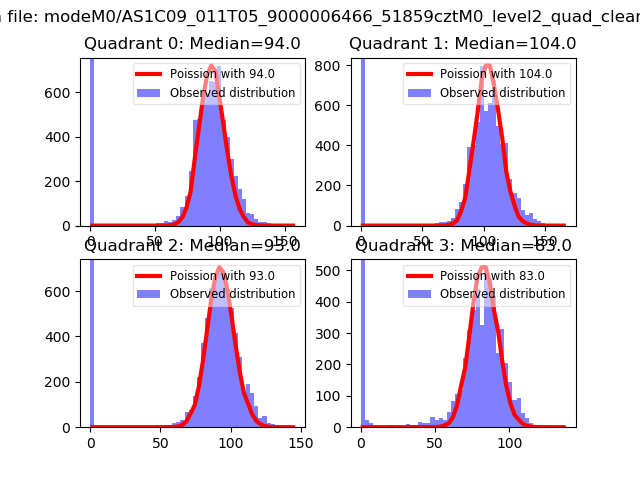 |
 |
| Quadrant-wise count rates Data is divided into 100 sec bins |
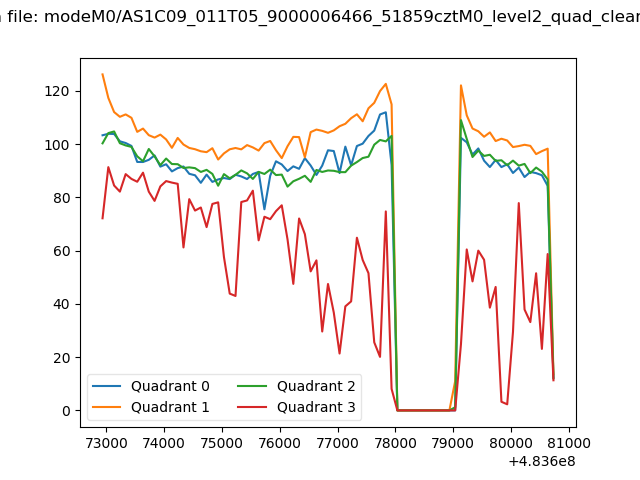 |
|
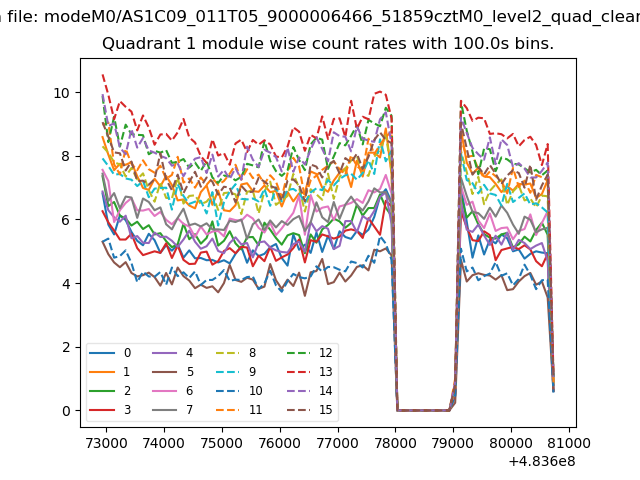
| Module-wise count rates for Quadrant A Data is divided into 100 sec bins |
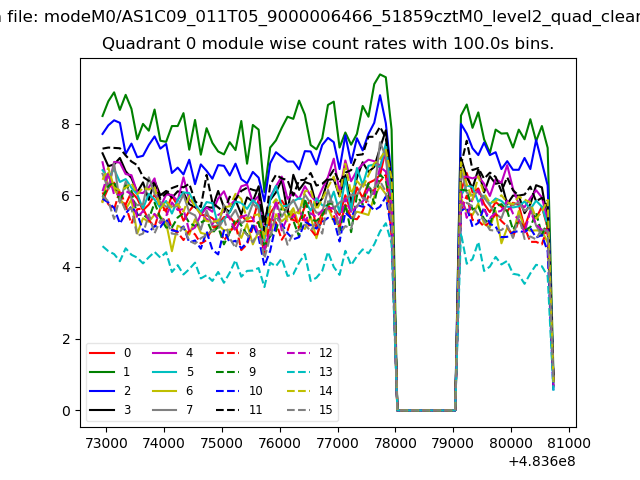 |
 |
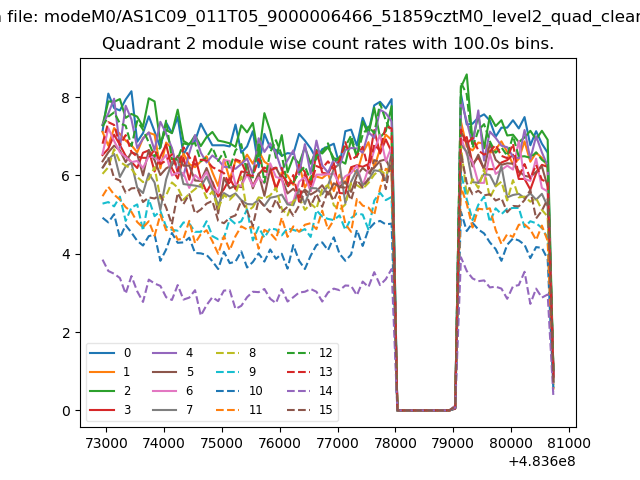
| Module-wise count rates for Quadrant B Data is divided into 100 sec bins |
 |
 |
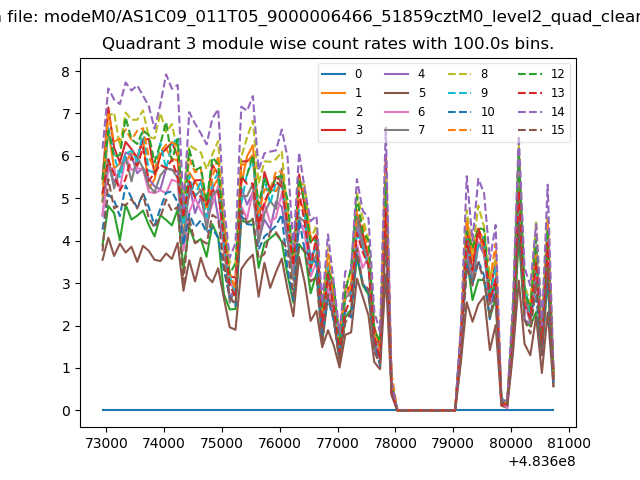
| Module-wise count rates for Quadrant C Data is divided into 100 sec bins |
 |
 |
| Module-wise count rates for Quadrant D Data is divided into 100 sec bins |
 |
 |
| Parameter | Plot |
|---|---|
| CZT HV Monitor | 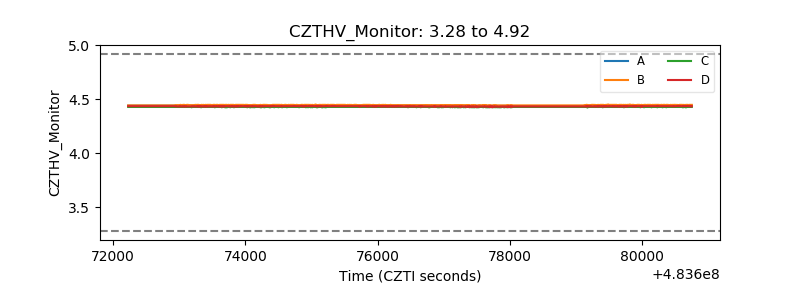 |
| D_VDD | 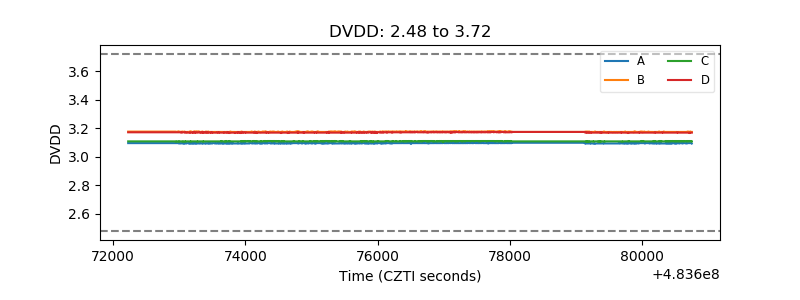 |
| Temperature 1 | 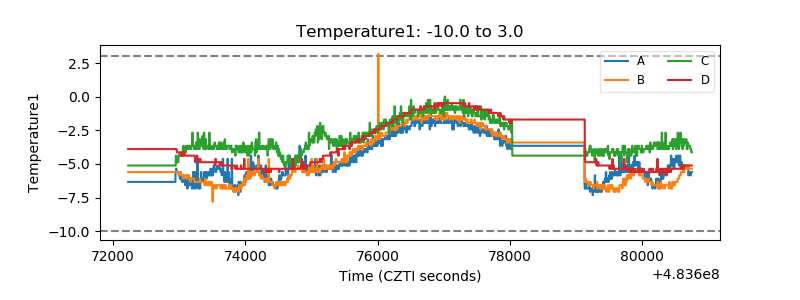 |
| Veto HV Monitor | 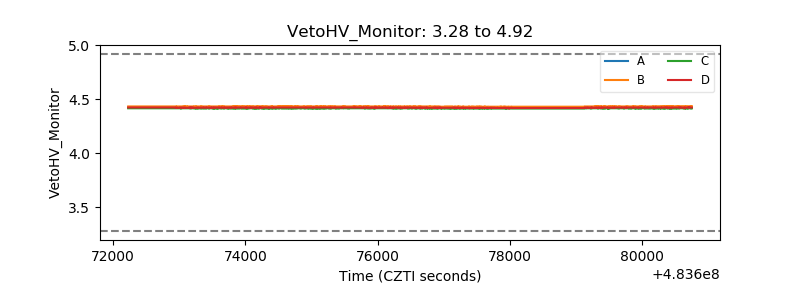 |
| Veto LLD | 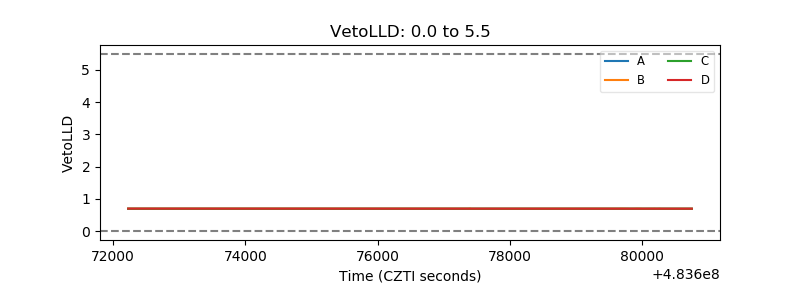 |
| Alpha Counter | 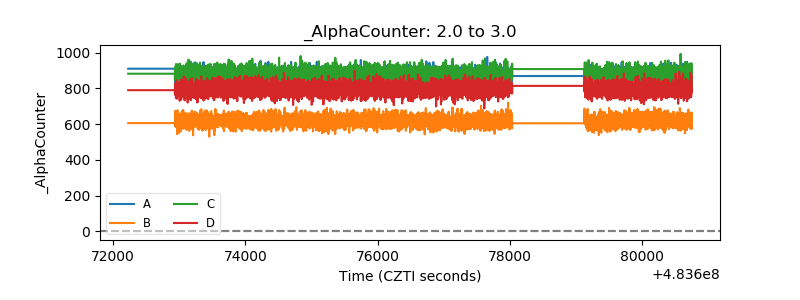 |
| _CPM_Rate | 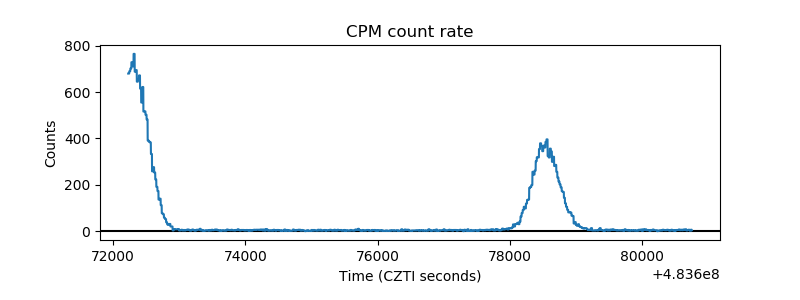 |
| CZT Counter | 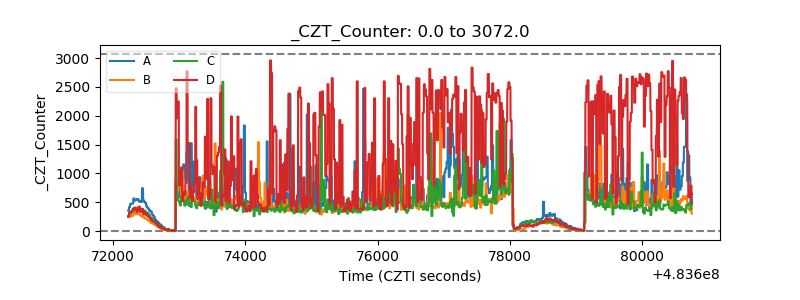 |
| +2.5 Volts monitor | 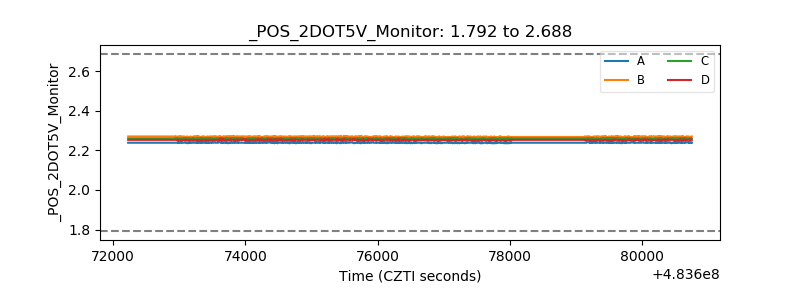 |
| +5 Volts monitor |  |
| _ROLL_ROT | 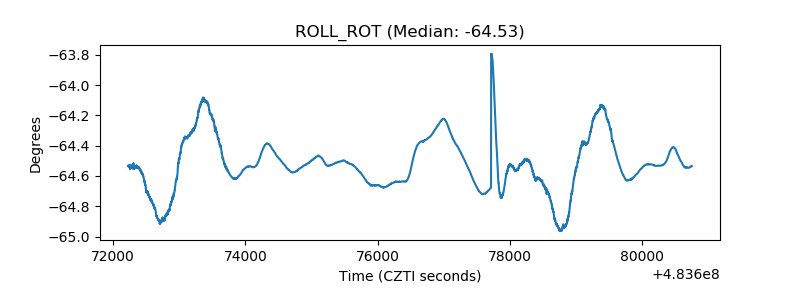 |
| _Roll_DEC | 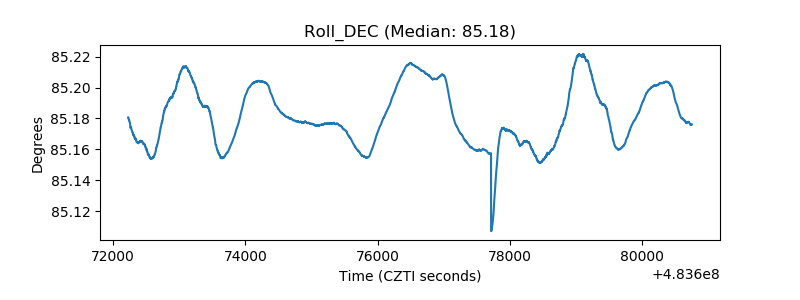 |
| _Roll_RA | 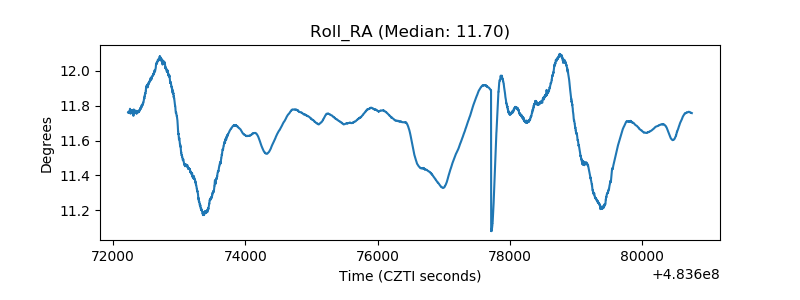 |
| Veto Counter | 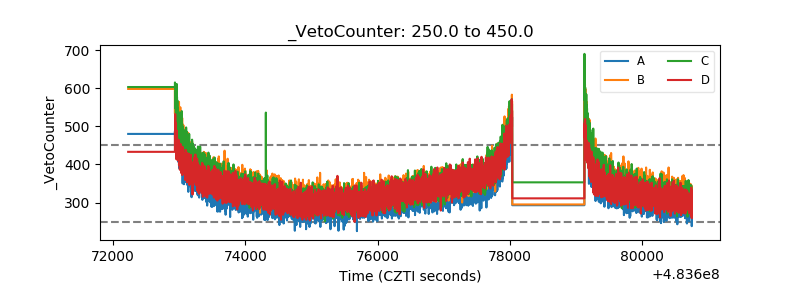 |