| Param | Original file | Final file |
|---|---|---|
| Filename | modeM0/AS1C09_011T05_9000006466_51860cztM0_level2.fits | modeM0/AS1C09_011T05_9000006466_51860cztM0_level2_quad_clean.evt |
| Size (bytes) | 626,503,680 | 81,103,680 |
| Size | 597.5 MB | 77.3 MB |
| Events in quadrant A | 4,880,306 | 563,483 |
| Events in quadrant B | 3,303,198 | 631,605 |
| Events in quadrant C | 3,691,302 | 540,749 |
| Events in quadrant D | 10,834,534 | 286,312 |
| Mode SS | |||
|---|---|---|---|
| Quadrant | BADHDUFLAG | Total packets | Discarded packets |
| A | 0 | 126 | 0 |
| B | 0 | 126 | 0 |
| C | 0 | 126 | 0 |
| D | 0 | 126 | 0 |
| Mode M0 | |||
|---|---|---|---|
| Quadrant | BADHDUFLAG | Total packets | Discarded packets |
| A | 0 | 18781 | 1 |
| B | 0 | 14198 | 1 |
| C | 0 | 15719 | 1 |
| D | 0 | 36482 | 1 |
| Mode M9 | |||
|---|---|---|---|
| Quadrant | BADHDUFLAG | Total packets | Discarded packets |
| A | 0 | 9 | 0 |
| B | 0 | 9 | 0 |
| C | 0 | 9 | 0 |
| D | 0 | 9 | 0 |
| Quadrant | Total seconds | Saturated seconds | Saturation percentage |
|---|---|---|---|
| A | 6210 | 187 | 3.011272% |
| B | 6210 | 75 | 1.207729% |
| C | 6211 | 297 | 4.781839% |
| D | 6211 | 3137 | 50.507165% |
Noise dominated data is calculated using 1-second bins in cleaned event files. If a bin has >2000 counts, and if more than 50% of those come from <1% of pixels, then it is considered to be noise-dominated and hence unusable.
| Quadrant | # 1 sec bins | Bins with >0 counts | Bins with >2000 counts | High rate bins dominated by noise | Noise dominated (total time) | Noise dominated (detector-on time) | Marked lightcurve |
|---|---|---|---|---|---|---|---|
| A | 7132 | 6212 | 103 | 103 | 1.44% | 1.66% | 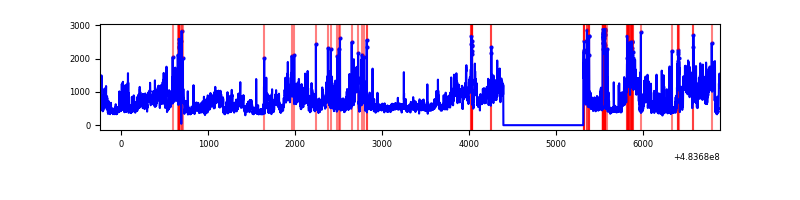 |
| B | 7132 | 6213 | 25 | 25 | 0.35% | 0.40% | 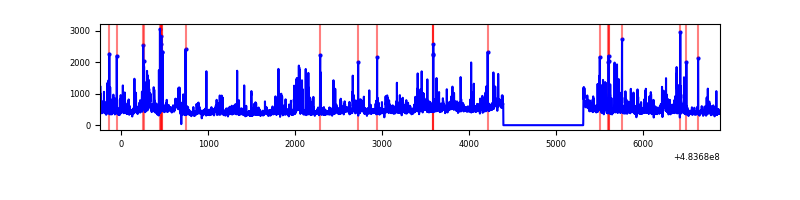 |
| C | 7133 | 6213 | 178 | 178 | 2.50% | 2.86% | 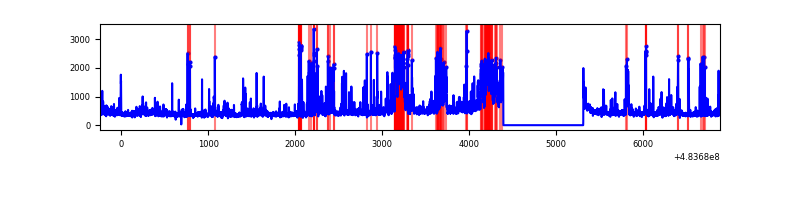 |
| D | 7133 | 6213 | 2970 | 2970 | 41.64% | 47.80% | 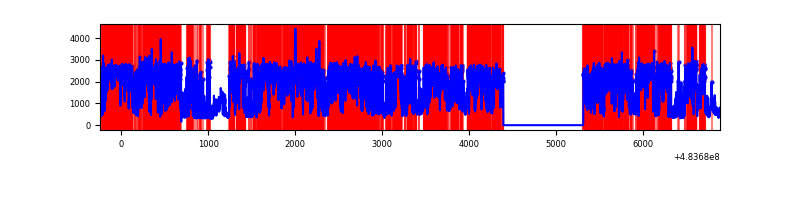 |
Top three noisy pixels from each quadrant. If the there are fewer than three noisy pixels in the level2.evt file, extra rows are filled as -1
| Pixel properties | Quadrant properties | ||||||
|---|---|---|---|---|---|---|---|
| Quadrant | DetID | PixID | Counts | Sigma | Mean | Median | Sigma |
| A | 12 | 3 | 1336764 | 8584.91 | 627 | 613 | 155.6 |
| A | 12 | 194 | 159842 | 1023.06 | 627 | 613 | 155.6 |
| A | 4 | 3 | 151832 | 971.6 | 627 | 613 | 155.6 |
| B | 5 | 185 | 120360 | 895.33 | 634 | 612 | 133.7 |
| B | 0 | 171 | 91831 | 682.03 | 634 | 612 | 133.7 |
| B | 4 | 81 | 86389 | 641.34 | 634 | 612 | 133.7 |
| C | 15 | 158 | 427591 | 2506.33 | 608 | 603 | 170.4 |
| C | 13 | 3 | 212924 | 1246.28 | 608 | 603 | 170.4 |
| C | 0 | 193 | 204097 | 1194.47 | 608 | 603 | 170.4 |
| D | 11 | 129 | 6870240 | 55011.14 | 441 | 425 | 124.9 |
| D | 8 | 176 | 1632563 | 13069.61 | 441 | 425 | 124.9 |
| D | 3 | 12 | 337115 | 2696.1 | 441 | 425 | 124.9 |
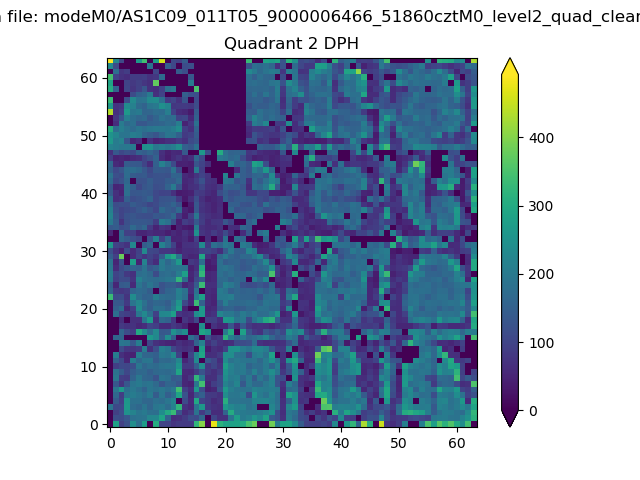
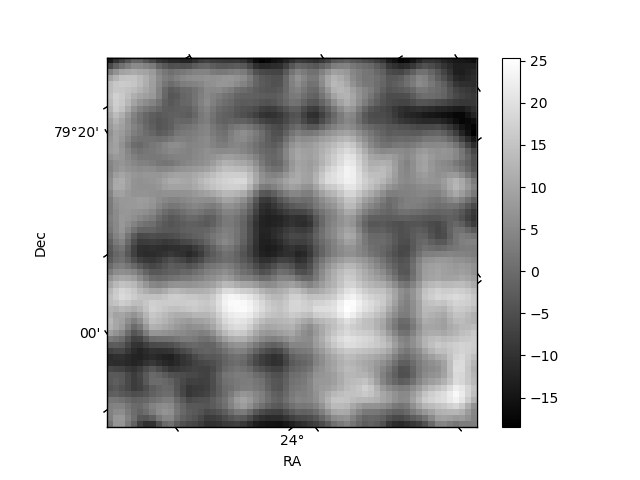
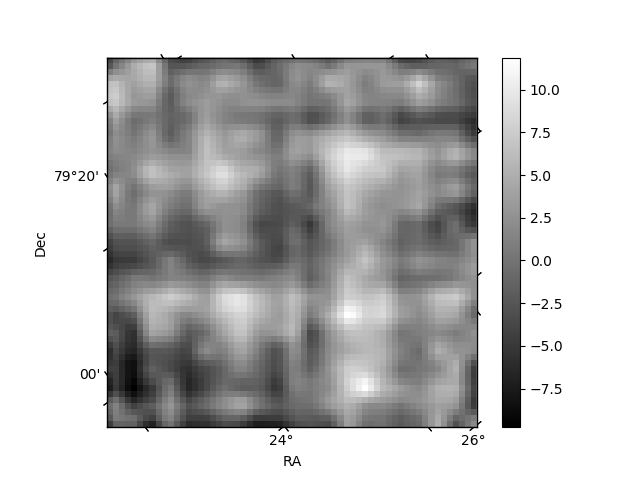
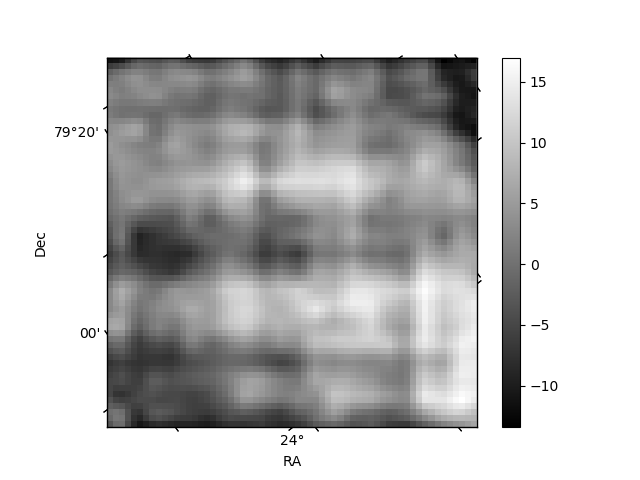
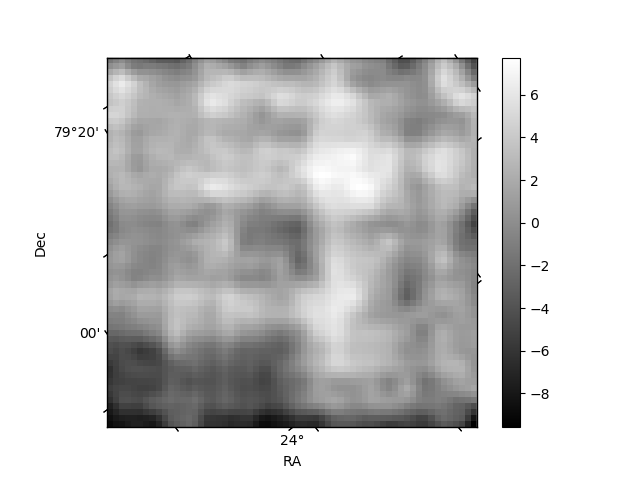
Histogram calculated using DETX and DETY for each event in the final _common_clean file
| Quadrant A | 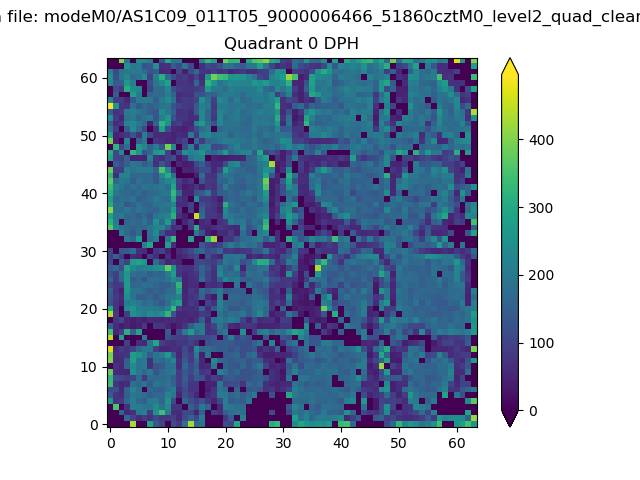 |
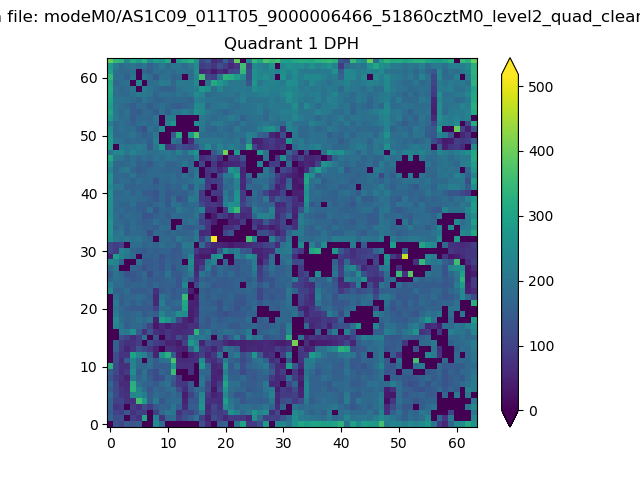 |
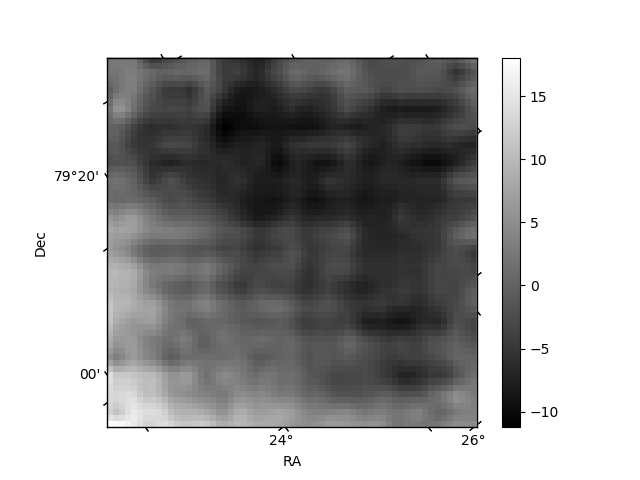
Quadrant B |
|---|---|---|---|
| Quadrant D | 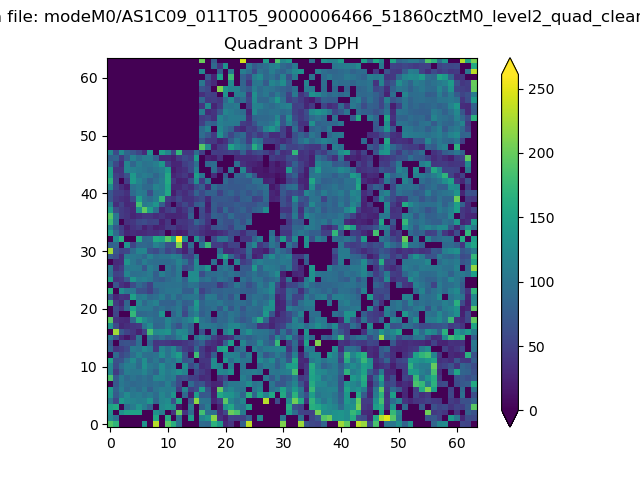 |
 |
Quadrant C |
| Plot type | Count rate plots | Images |
|---|---|---|
| Comparison with Poisson distribution Blue bars denote a histogram of data divided into 1 sec bins. Red curve is a Poisson curve with rate = median count rate of data. |
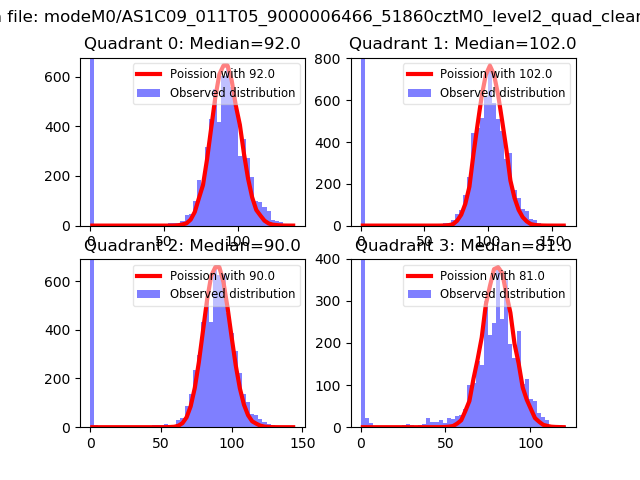 |
 |
| Quadrant-wise count rates Data is divided into 100 sec bins |
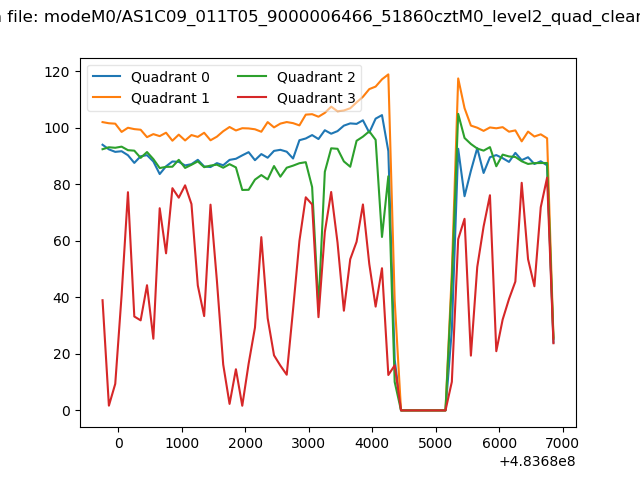 |
|
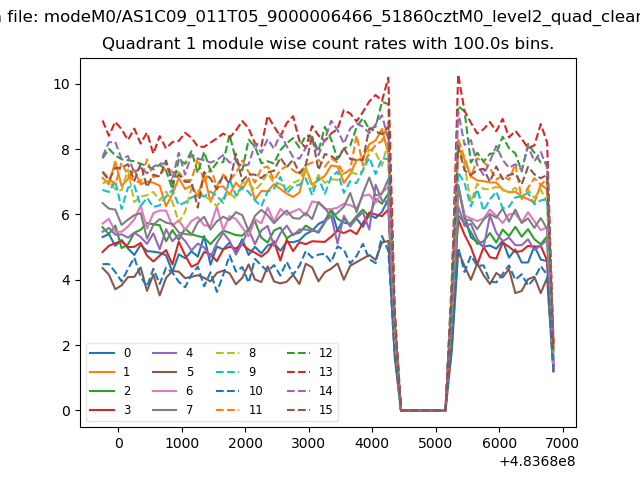
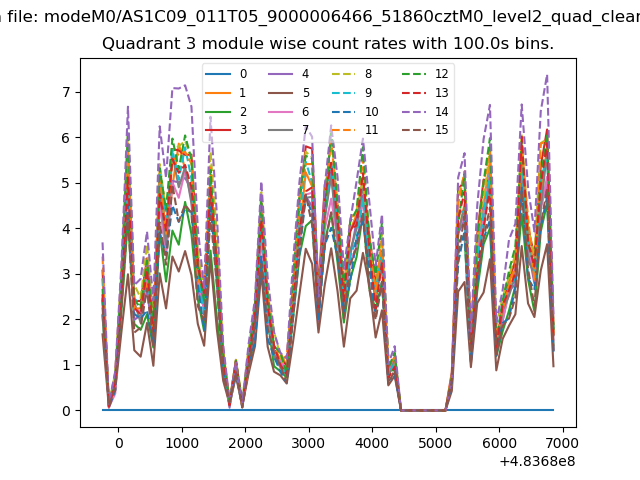
| Module-wise count rates for Quadrant A Data is divided into 100 sec bins |
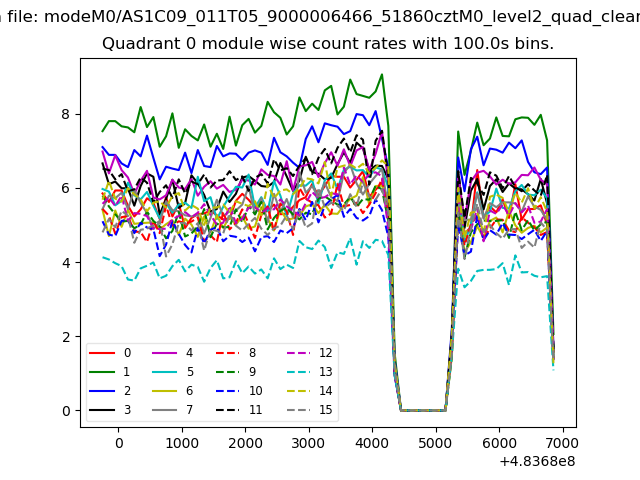 |
 |
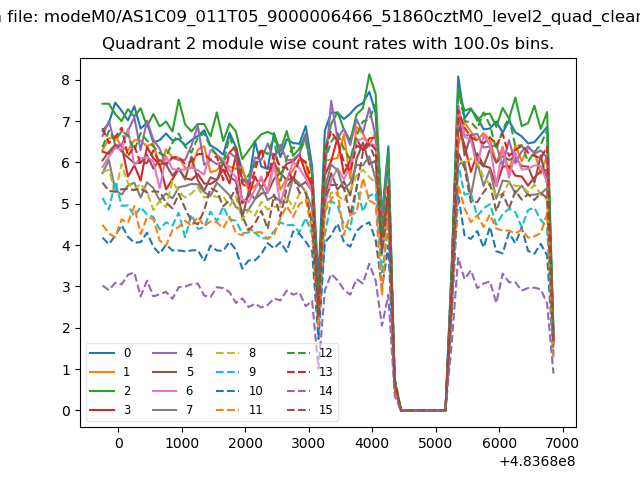
| Module-wise count rates for Quadrant B Data is divided into 100 sec bins |
 |
 |
| Module-wise count rates for Quadrant C Data is divided into 100 sec bins |
 |
 |
| Module-wise count rates for Quadrant D Data is divided into 100 sec bins |
 |
 |
| Parameter | Plot |
|---|---|
| CZT HV Monitor | 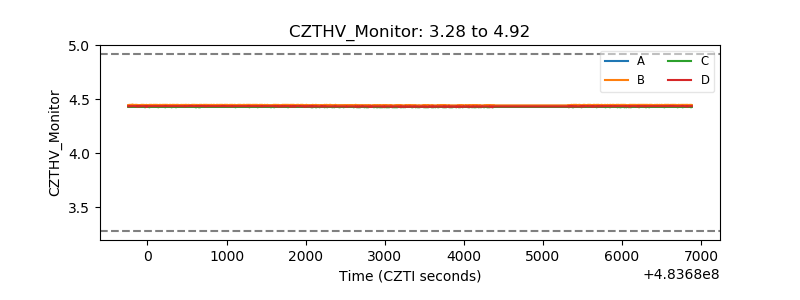 |
| D_VDD | 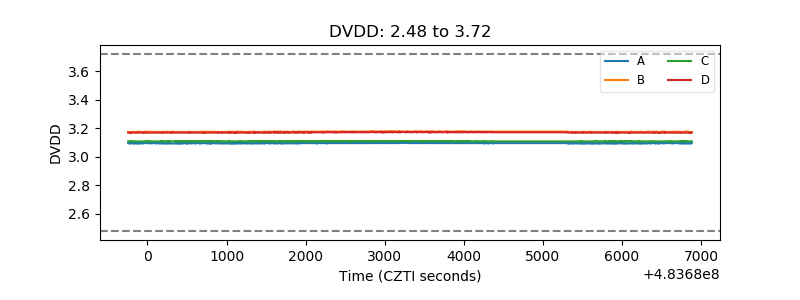 |
| Temperature 1 | 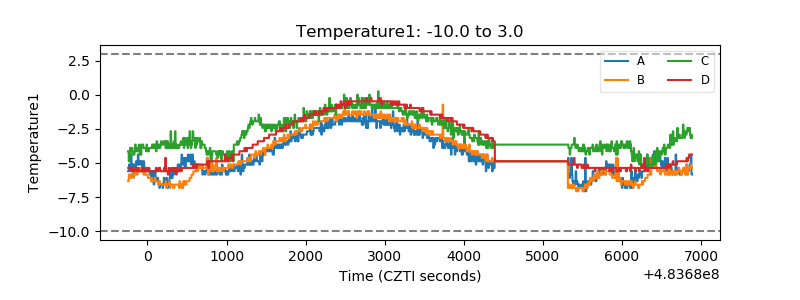 |
| Veto HV Monitor | 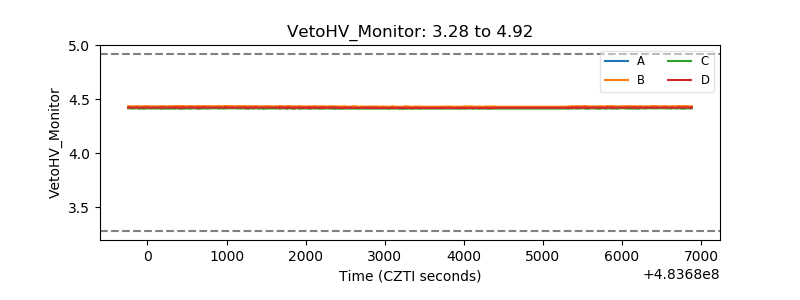 |
| Veto LLD | 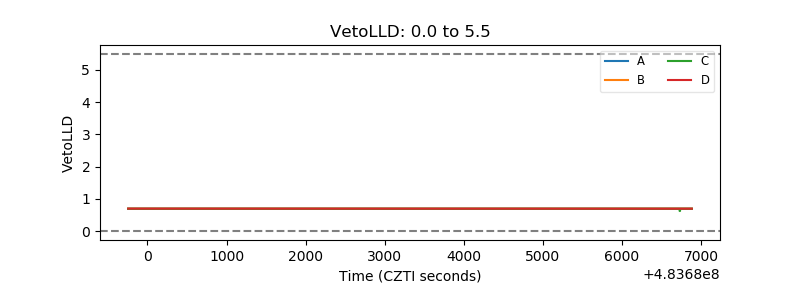 |
| Alpha Counter | 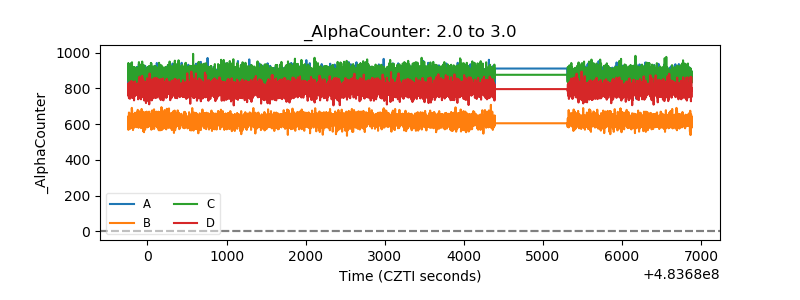 |
| _CPM_Rate | 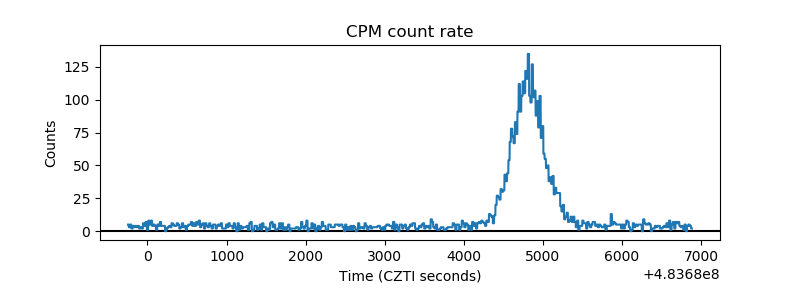 |
| CZT Counter | 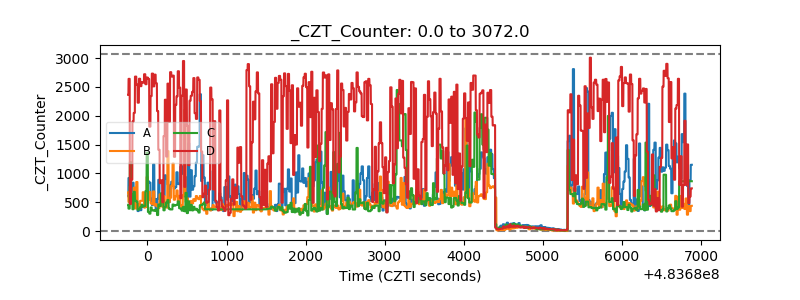 |
| +2.5 Volts monitor |  |
| +5 Volts monitor |  |
| _ROLL_ROT | 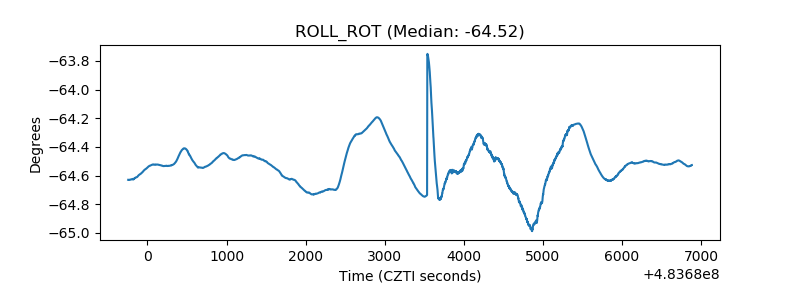 |
| _Roll_DEC | 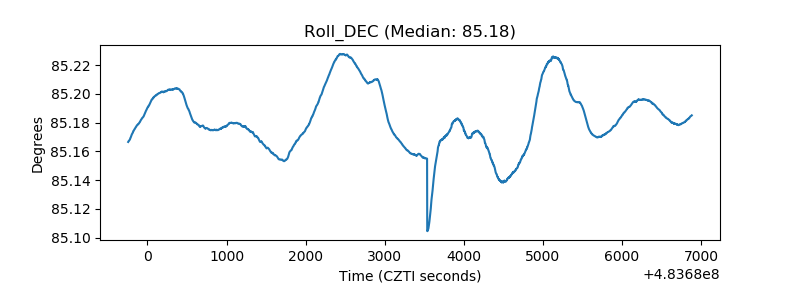 |
| _Roll_RA | 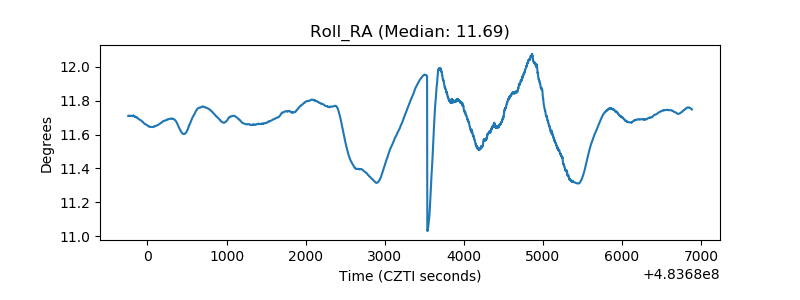 |
| Veto Counter | 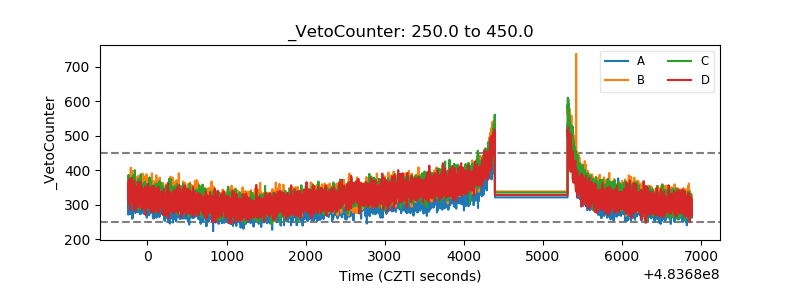 |