| Param | Original file | Final file |
|---|---|---|
| Filename | modeM0/AS1C09_011T05_9000006466_51861cztM0_level2.fits | modeM0/AS1C09_011T05_9000006466_51861cztM0_level2_quad_clean.evt |
| Size (bytes) | 656,884,800 | 82,405,440 |
| Size | 626.5 MB | 78.6 MB |
| Events in quadrant A | 6,330,600 | 563,296 |
| Events in quadrant B | 3,404,462 | 629,254 |
| Events in quadrant C | 3,327,387 | 565,781 |
| Events in quadrant D | 10,762,448 | 294,832 |
| Mode SS | |||
|---|---|---|---|
| Quadrant | BADHDUFLAG | Total packets | Discarded packets |
| A | 0 | 128 | 0 |
| B | 0 | 128 | 0 |
| C | 0 | 128 | 0 |
| D | 0 | 128 | 0 |
| Mode M0 | |||
|---|---|---|---|
| Quadrant | BADHDUFLAG | Total packets | Discarded packets |
| A | 0 | 23203 | 1 |
| B | 0 | 14631 | 1 |
| C | 0 | 14582 | 1 |
| D | 0 | 36359 | 3 |
| Mode M9 | |||
|---|---|---|---|
| Quadrant | BADHDUFLAG | Total packets | Discarded packets |
| A | 0 | 6 | 0 |
| B | 0 | 6 | 0 |
| C | 0 | 6 | 0 |
| D | 0 | 6 | 0 |
| Quadrant | Total seconds | Saturated seconds | Saturation percentage |
|---|---|---|---|
| A | 6330 | 345 | 5.450237% |
| B | 6331 | 150 | 2.369294% |
| C | 6331 | 85 | 1.342600% |
| D | 6330 | 3109 | 49.115324% |
Noise dominated data is calculated using 1-second bins in cleaned event files. If a bin has >2000 counts, and if more than 50% of those come from <1% of pixels, then it is considered to be noise-dominated and hence unusable.
| Quadrant | # 1 sec bins | Bins with >0 counts | Bins with >2000 counts | High rate bins dominated by noise | Noise dominated (total time) | Noise dominated (detector-on time) | Marked lightcurve |
|---|---|---|---|---|---|---|---|
| A | 6902 | 6333 | 220 | 220 | 3.19% | 3.47% | 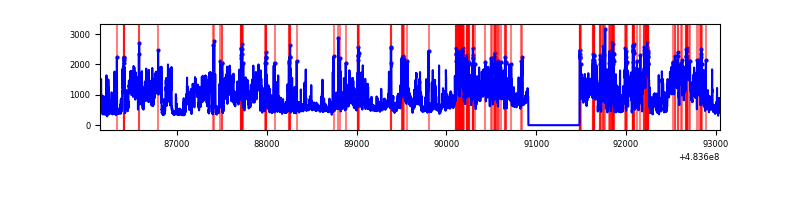 |
| B | 6903 | 6334 | 63 | 63 | 0.91% | 0.99% | 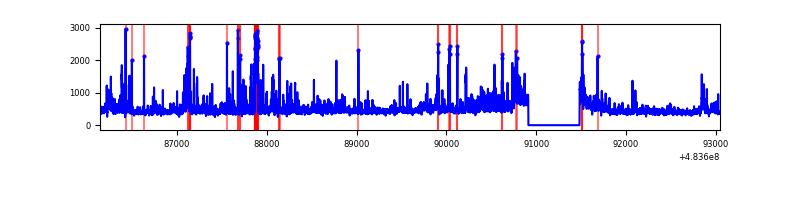 |
| C | 6903 | 6334 | 70 | 70 | 1.01% | 1.11% | 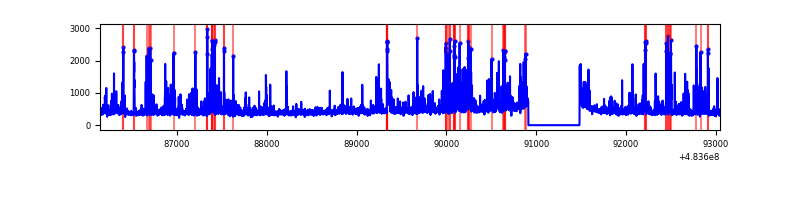 |
| D | 6903 | 6334 | 2924 | 2924 | 42.36% | 46.16% | 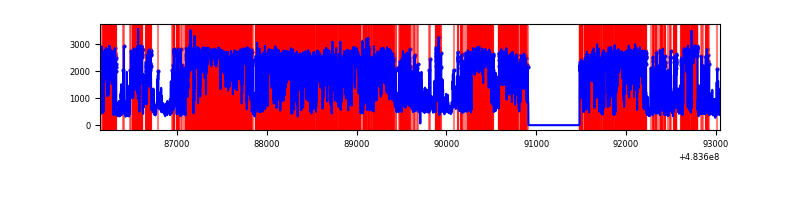 |
Top three noisy pixels from each quadrant. If the there are fewer than three noisy pixels in the level2.evt file, extra rows are filled as -1
| Pixel properties | Quadrant properties | ||||||
|---|---|---|---|---|---|---|---|
| Quadrant | DetID | PixID | Counts | Sigma | Mean | Median | Sigma |
| A | 12 | 3 | 2222303 | 13638.62 | 643 | 628 | 162.9 |
| A | 11 | 3 | 383838 | 2352.48 | 643 | 628 | 162.9 |
| A | 12 | 194 | 260733 | 1596.76 | 643 | 628 | 162.9 |
| B | 5 | 185 | 178634 | 1288.85 | 647 | 625 | 138.1 |
| B | 0 | 171 | 141190 | 1017.74 | 647 | 625 | 138.1 |
| B | 4 | 81 | 100449 | 722.76 | 647 | 625 | 138.1 |
| C | 13 | 3 | 385452 | 2205.4 | 630 | 623 | 174.5 |
| C | 12 | 252 | 75178 | 427.26 | 630 | 623 | 174.5 |
| C | 15 | 230 | 63542 | 360.58 | 630 | 623 | 174.5 |
| D | 11 | 129 | 6713083 | 53262.88 | 448 | 431 | 126.0 |
| D | 8 | 176 | 1668915 | 13238.92 | 448 | 431 | 126.0 |
| D | 0 | 18 | 146690 | 1160.52 | 448 | 431 | 126.0 |
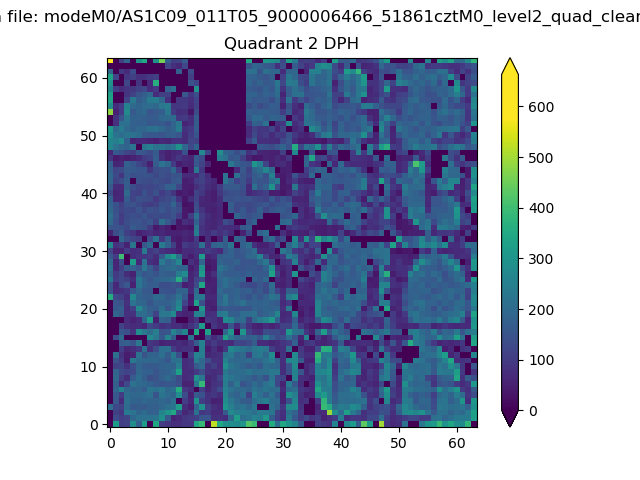
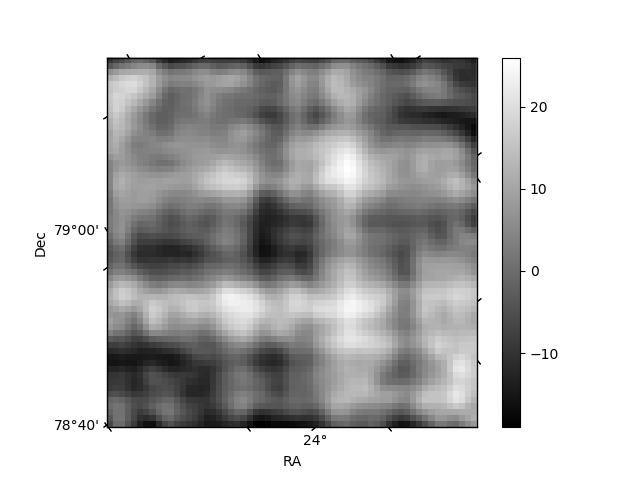
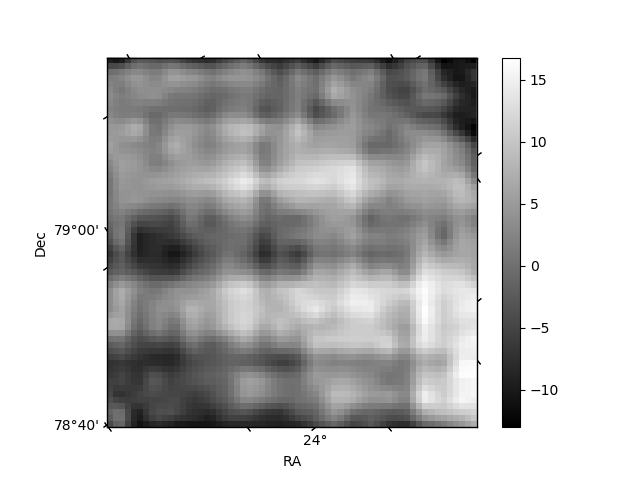
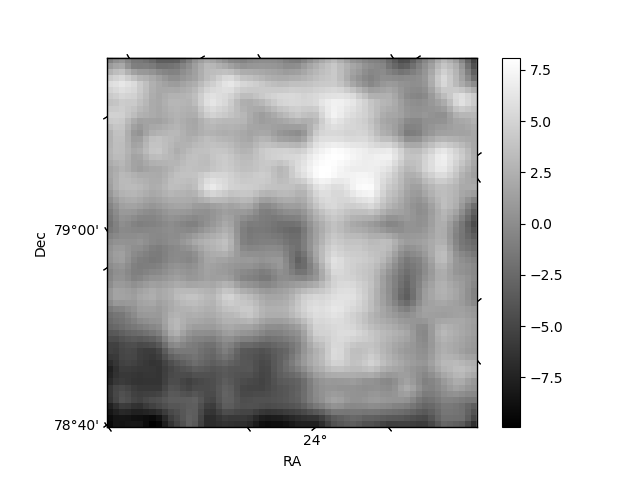
Histogram calculated using DETX and DETY for each event in the final _common_clean file
| Quadrant A | 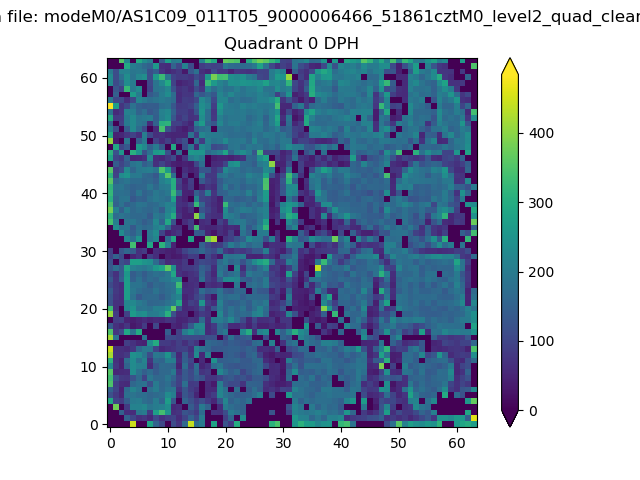 |
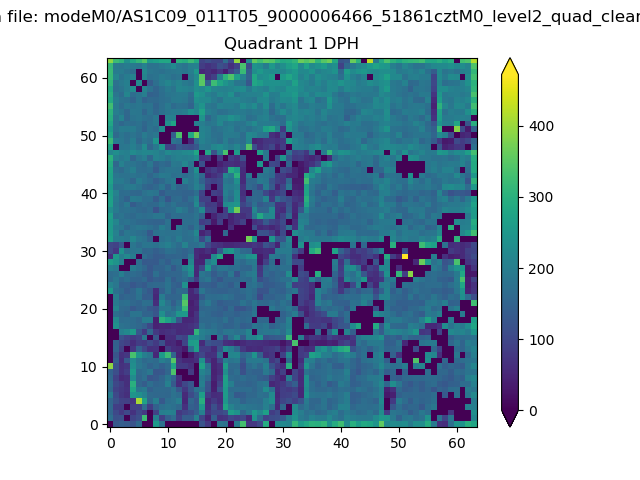 |
Quadrant B |
|---|---|---|---|
| Quadrant D | 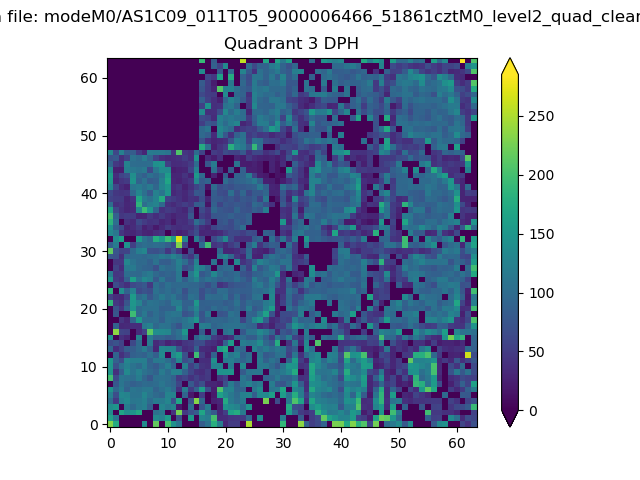 |
 |
Quadrant C |
| Plot type | Count rate plots | Images |
|---|---|---|
| Comparison with Poisson distribution Blue bars denote a histogram of data divided into 1 sec bins. Red curve is a Poisson curve with rate = median count rate of data. |
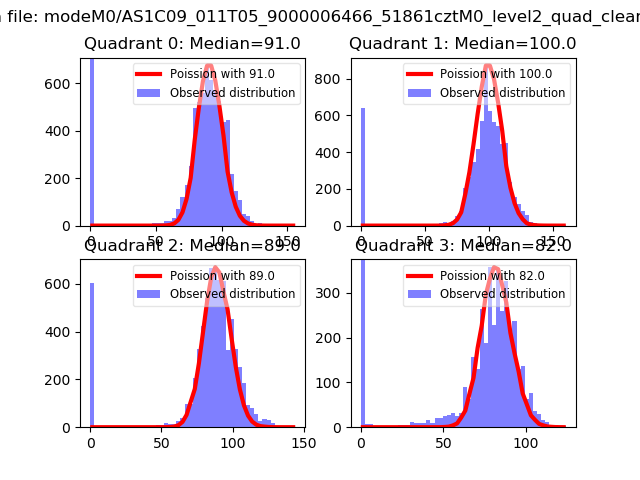 |
 |
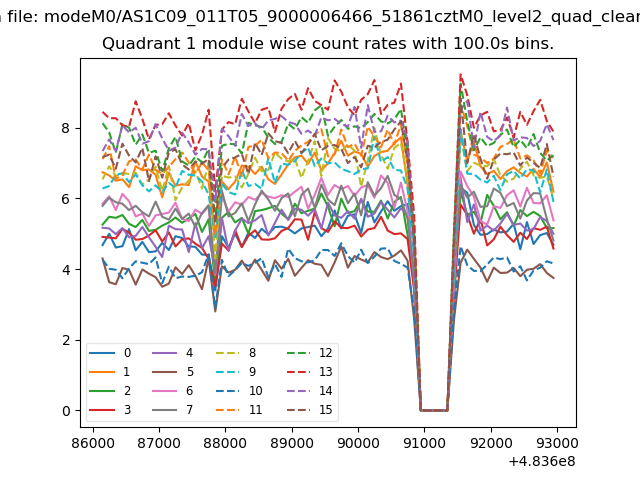
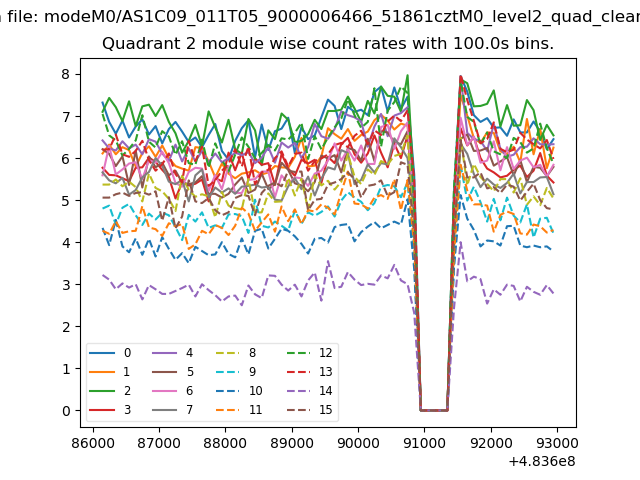
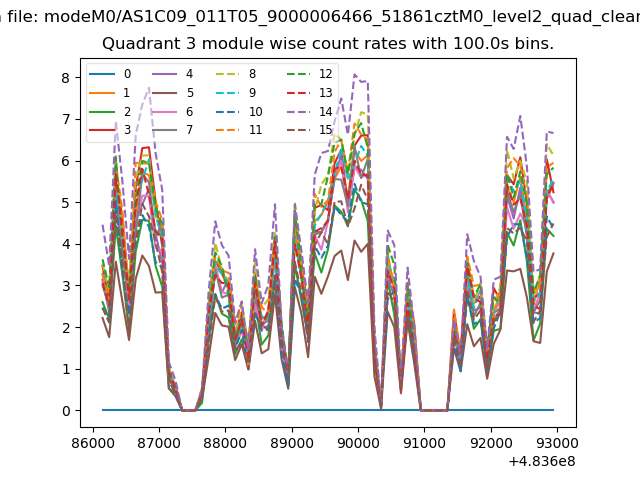
| Quadrant-wise count rates Data is divided into 100 sec bins |
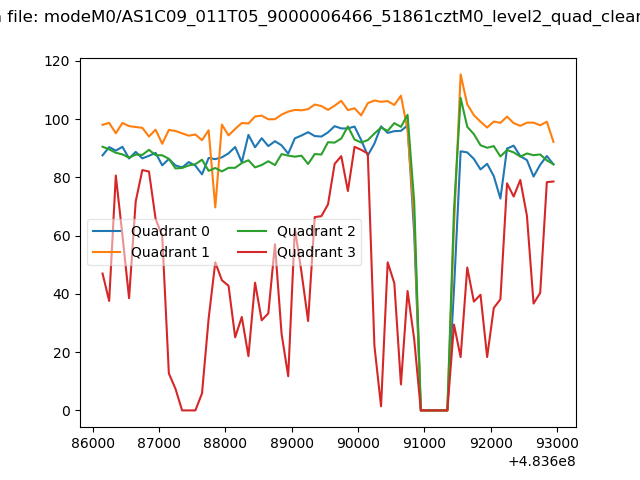 |
|
| Module-wise count rates for Quadrant A Data is divided into 100 sec bins |
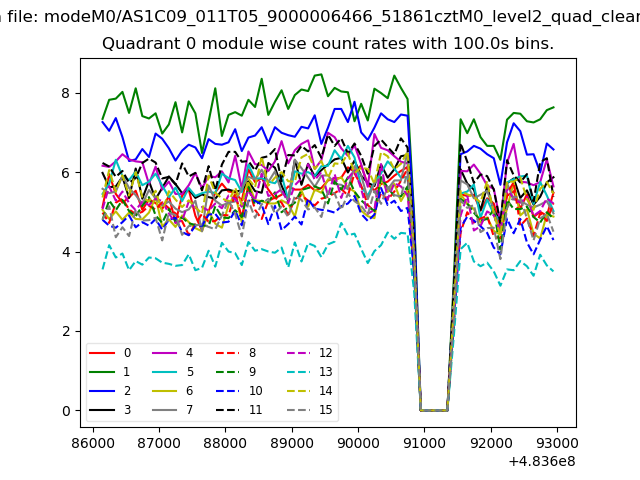 |
 |
| Module-wise count rates for Quadrant B Data is divided into 100 sec bins |
 |
 |
| Module-wise count rates for Quadrant C Data is divided into 100 sec bins |
 |
 |
| Module-wise count rates for Quadrant D Data is divided into 100 sec bins |
 |
 |
| Parameter | Plot |
|---|---|
| CZT HV Monitor | 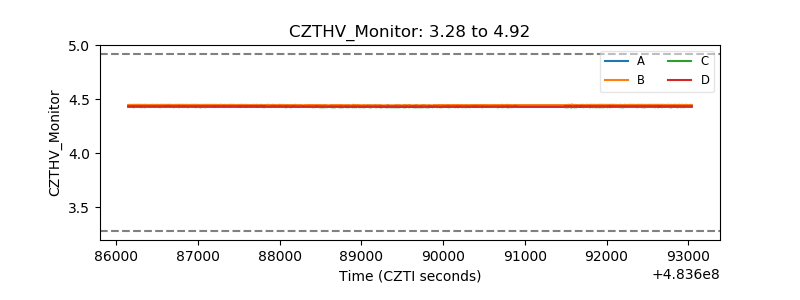 |
| D_VDD | 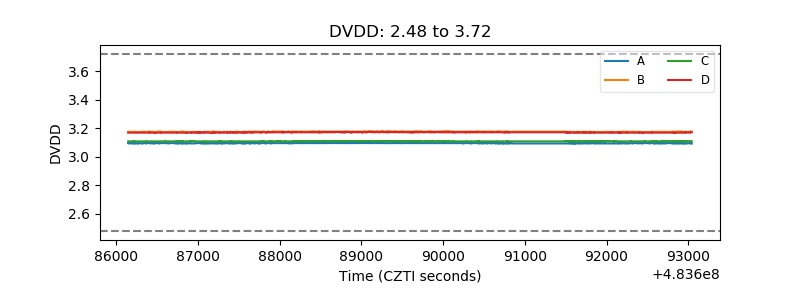 |
| Temperature 1 | 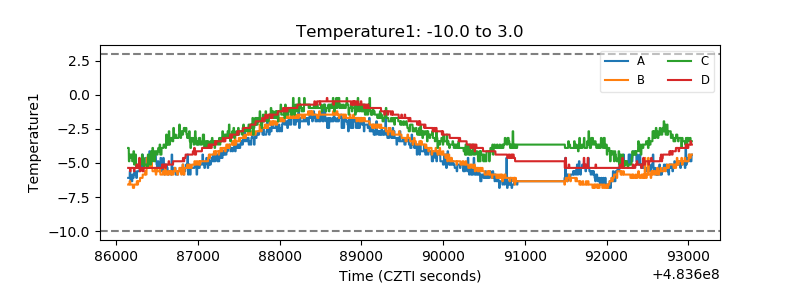 |
| Veto HV Monitor | 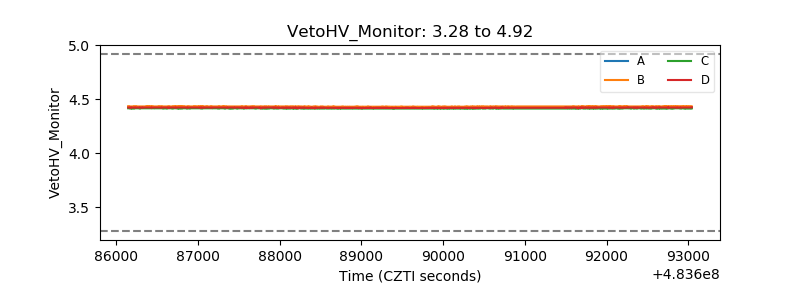 |
| Veto LLD | 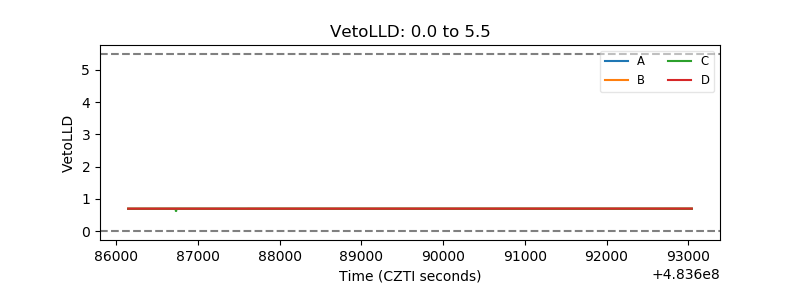 |
| Alpha Counter | 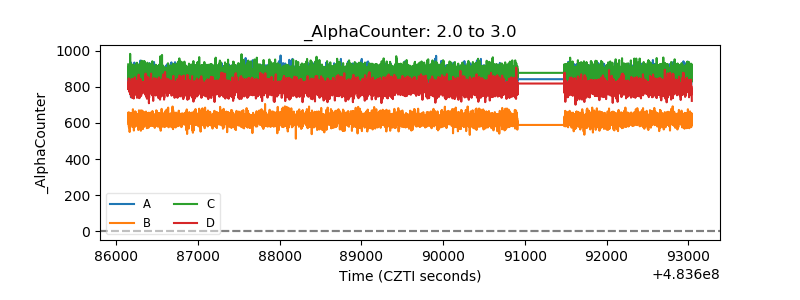 |
| _CPM_Rate | 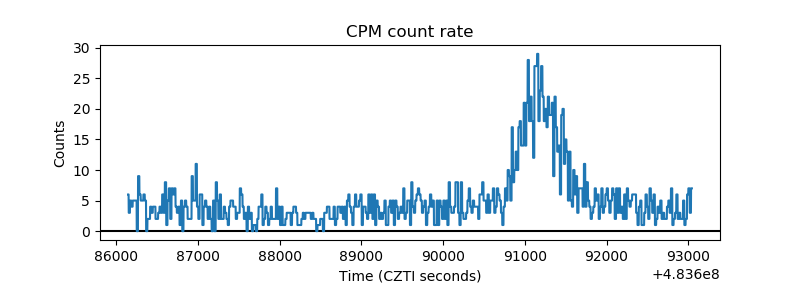 |
| CZT Counter | 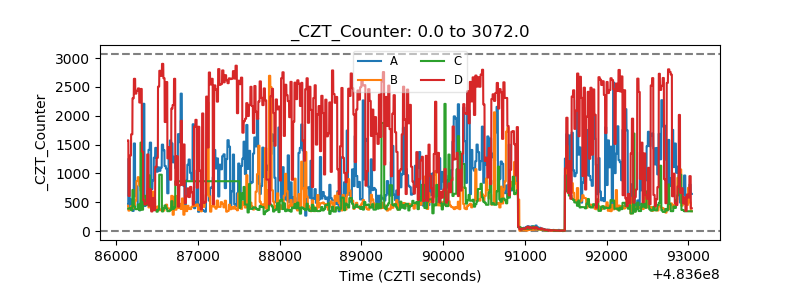 |
| +2.5 Volts monitor | 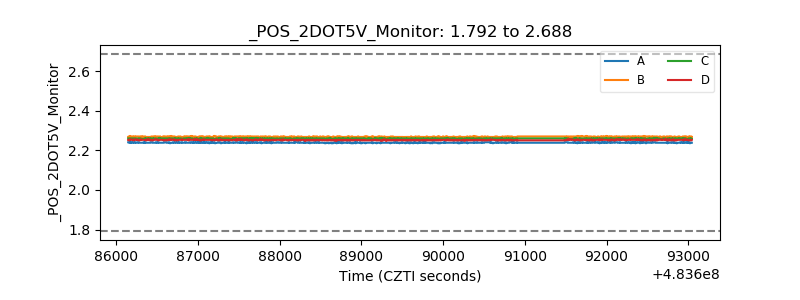 |
| +5 Volts monitor | 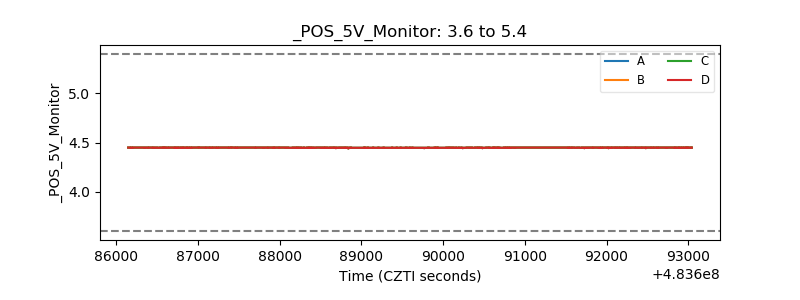 |
| _ROLL_ROT | 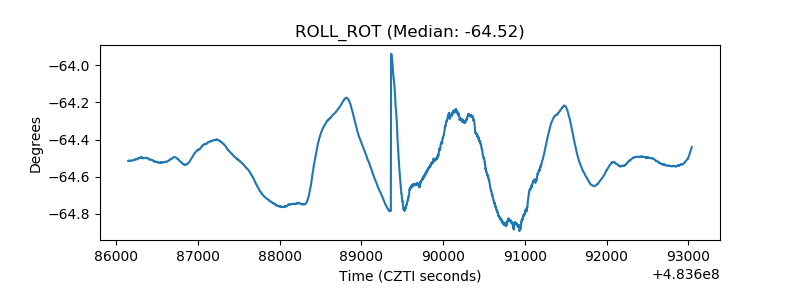 |
| _Roll_DEC |  |
| _Roll_RA | 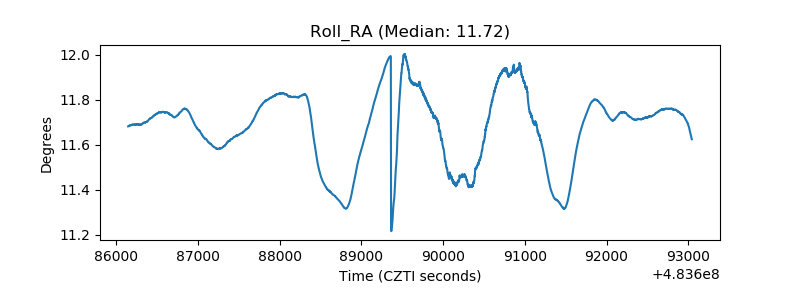 |
| Veto Counter | 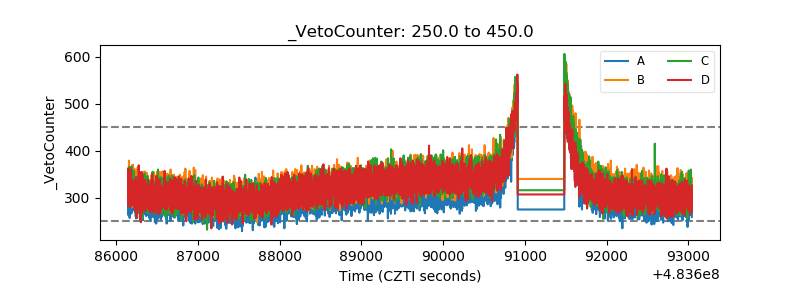 |