| Param | Original file | Final file |
|---|---|---|
| Filename | modeM0/AS1C09_011T05_9000006466_51862cztM0_level2.fits | modeM0/AS1C09_011T05_9000006466_51862cztM0_level2_quad_clean.evt |
| Size (bytes) | 752,947,200 | 99,737,280 |
| Size | 718.1 MB | 95.1 MB |
| Events in quadrant A | 5,911,491 | 692,724 |
| Events in quadrant B | 5,290,982 | 729,154 |
| Events in quadrant C | 4,597,340 | 669,535 |
| Events in quadrant D | 11,481,578 | 398,073 |
| Mode SS | |||
|---|---|---|---|
| Quadrant | BADHDUFLAG | Total packets | Discarded packets |
| A | 0 | 152 | 0 |
| B | 0 | 152 | 0 |
| C | 0 | 152 | 0 |
| D | 0 | 152 | 0 |
| Mode M0 | |||
|---|---|---|---|
| Quadrant | BADHDUFLAG | Total packets | Discarded packets |
| A | 0 | 22930 | 53 |
| B | 0 | 21086 | 19 |
| C | 0 | 19138 | 19 |
| D | 0 | 39503 | 155 |
| Quadrant | Total seconds | Saturated seconds | Saturation percentage |
|---|---|---|---|
| A | 7621 | 192 | 2.519354% |
| B | 7625 | 425 | 5.573770% |
| C | 7625 | 228 | 2.990164% |
| D | 7613 | 3049 | 40.049915% |
Noise dominated data is calculated using 1-second bins in cleaned event files. If a bin has >2000 counts, and if more than 50% of those come from <1% of pixels, then it is considered to be noise-dominated and hence unusable.
| Quadrant | # 1 sec bins | Bins with >0 counts | Bins with >2000 counts | High rate bins dominated by noise | Noise dominated (total time) | Noise dominated (detector-on time) | Marked lightcurve |
|---|---|---|---|---|---|---|---|
| A | 7633 | 7630 | 138 | 138 | 1.81% | 1.81% | 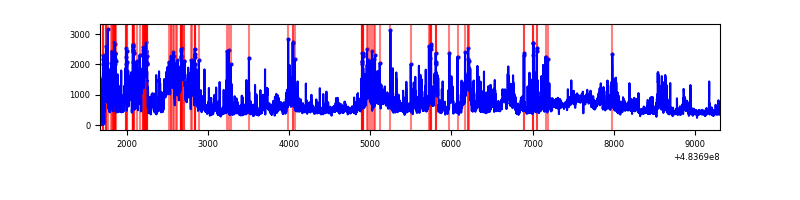 |
| B | 7633 | 7631 | 310 | 310 | 4.06% | 4.06% | 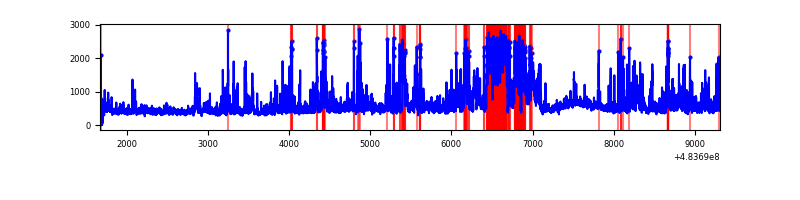 |
| C | 7634 | 7634 | 217 | 217 | 2.84% | 2.84% |  |
| D | 7625 | 7616 | 2882 | 2882 | 37.80% | 37.84% | 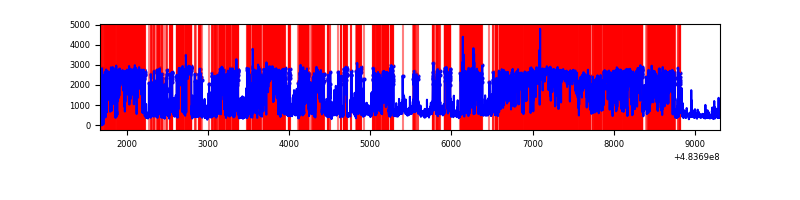 |
Top three noisy pixels from each quadrant. If the there are fewer than three noisy pixels in the level2.evt file, extra rows are filled as -1
| Pixel properties | Quadrant properties | ||||||
|---|---|---|---|---|---|---|---|
| Quadrant | DetID | PixID | Counts | Sigma | Mean | Median | Sigma |
| A | 12 | 3 | 1095955 | 5522.03 | 792 | 771 | 198.3 |
| A | 4 | 175 | 335628 | 1688.38 | 792 | 771 | 198.3 |
| A | 11 | 3 | 331467 | 1667.4 | 792 | 771 | 198.3 |
| B | 10 | 44 | 1337995 | 8050.91 | 782 | 755 | 166.1 |
| B | 0 | 171 | 160493 | 961.71 | 782 | 755 | 166.1 |
| B | 0 | 213 | 115930 | 693.42 | 782 | 755 | 166.1 |
| C | 0 | 193 | 356468 | 1708.06 | 760 | 752 | 208.3 |
| C | 13 | 3 | 344103 | 1648.68 | 760 | 752 | 208.3 |
| C | 15 | 230 | 181100 | 865.98 | 760 | 752 | 208.3 |
| D | 11 | 129 | 6779498 | 42004.15 | 575 | 554 | 161.4 |
| D | 8 | 176 | 1164975 | 7215.06 | 575 | 554 | 161.4 |
| D | 6 | 42 | 530094 | 3281.17 | 575 | 554 | 161.4 |
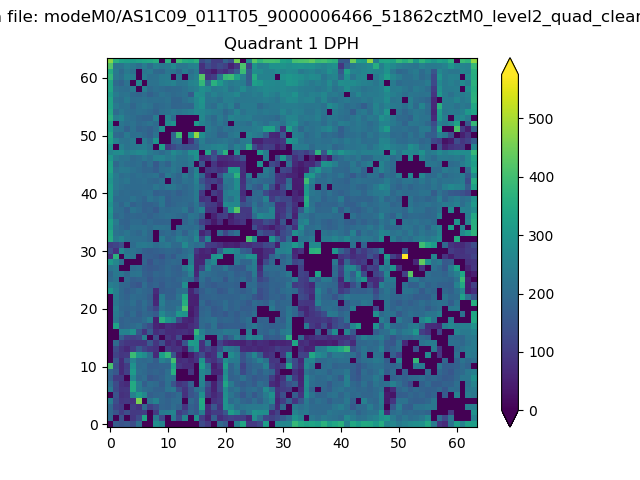
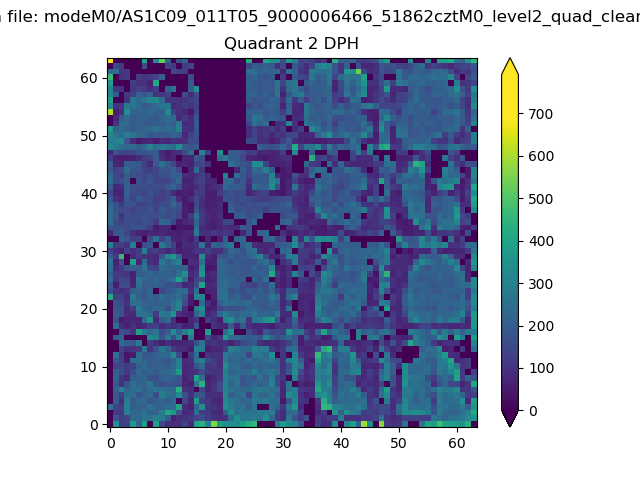
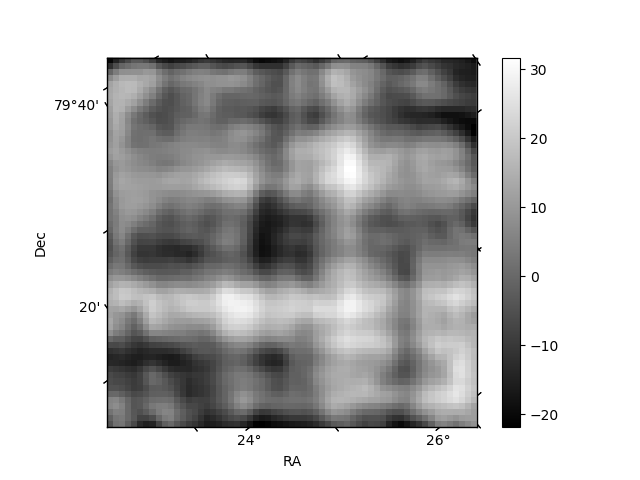
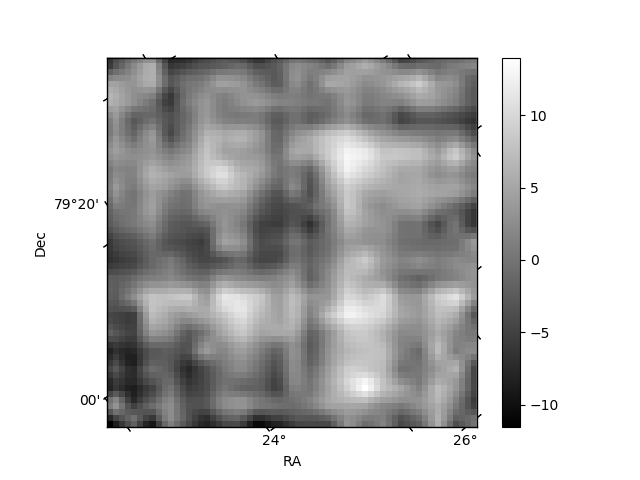
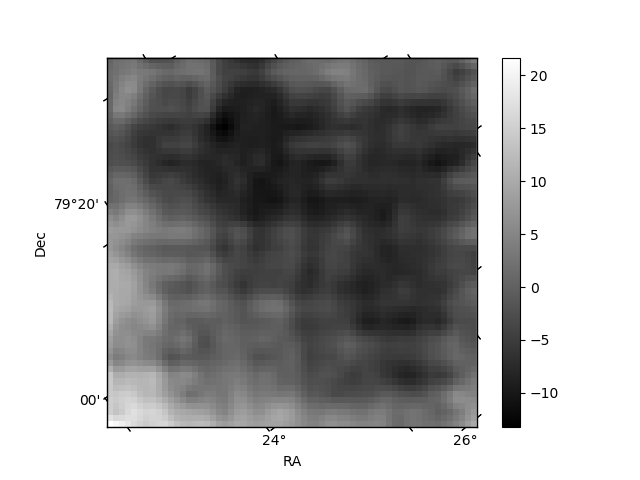
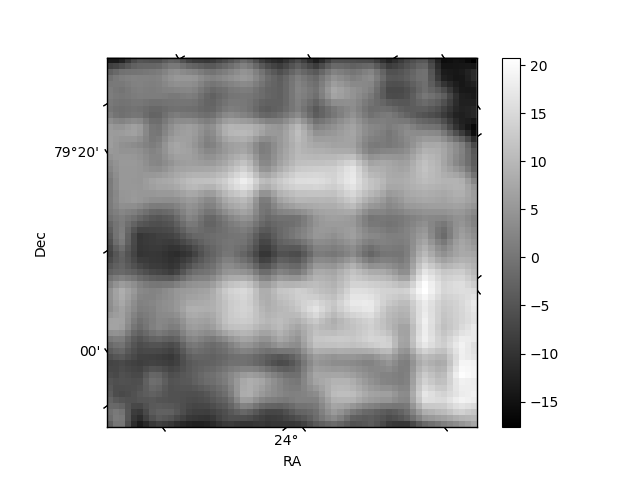
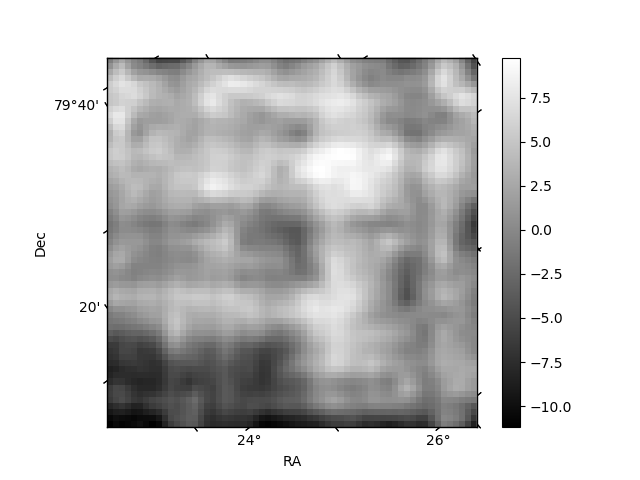
Histogram calculated using DETX and DETY for each event in the final _common_clean file
| Quadrant A | 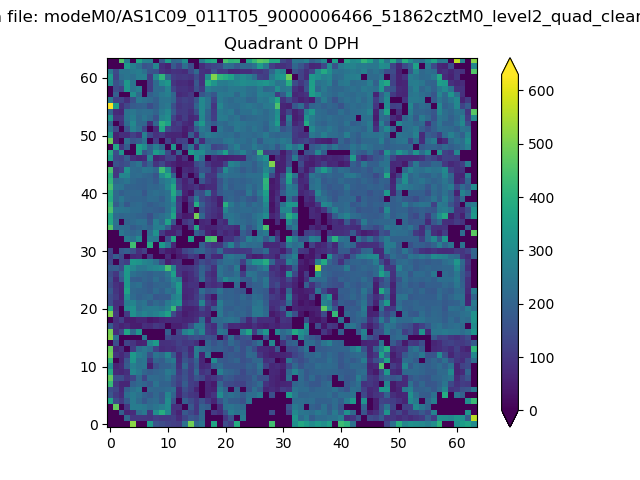 |
 |
Quadrant B |
|---|---|---|---|
| Quadrant D | 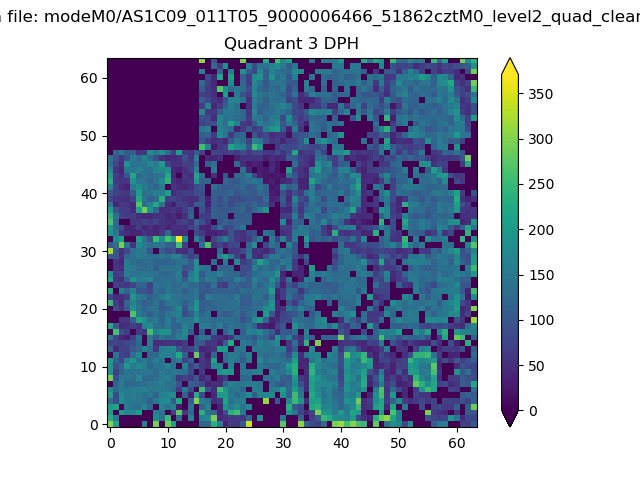 |
 |
Quadrant C |
| Plot type | Count rate plots | Images |
|---|---|---|
| Comparison with Poisson distribution Blue bars denote a histogram of data divided into 1 sec bins. Red curve is a Poisson curve with rate = median count rate of data. |
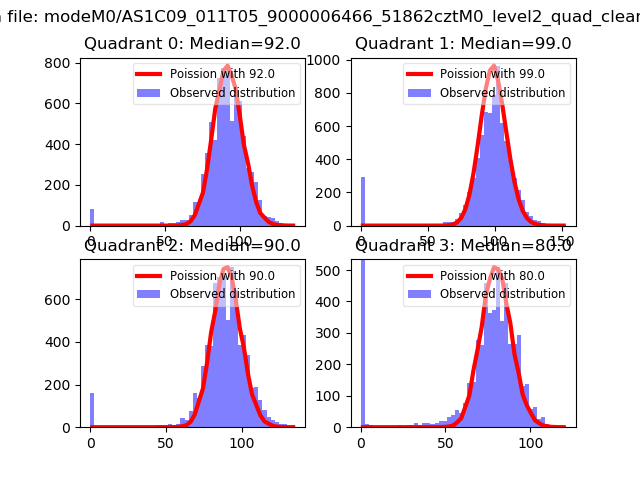 |
 |
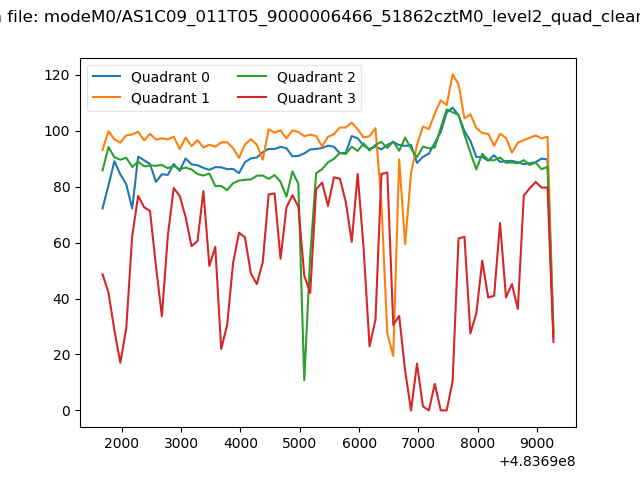
| Quadrant-wise count rates Data is divided into 100 sec bins |
 |
|
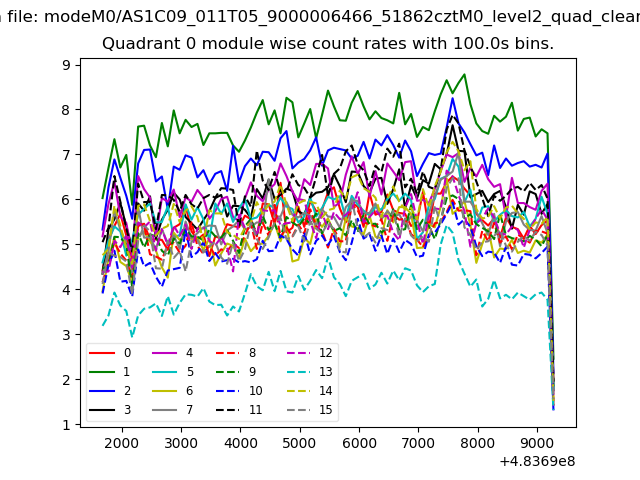
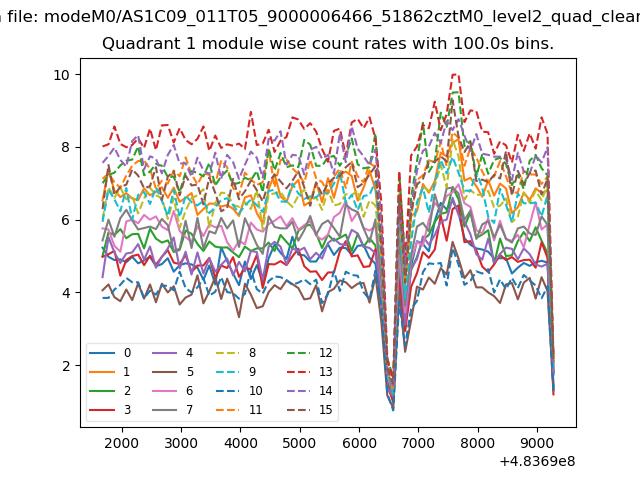
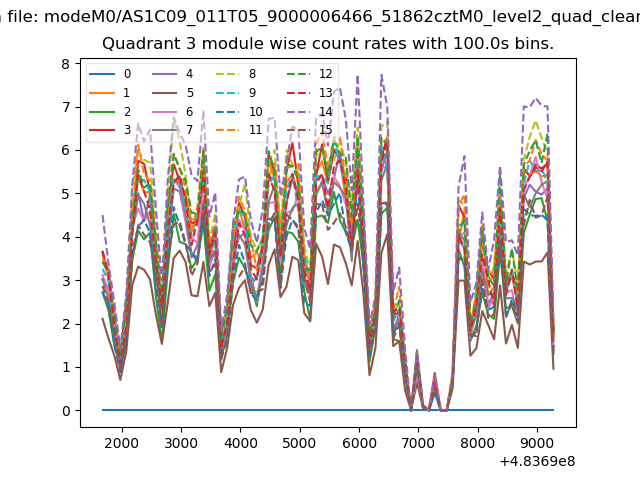
| Module-wise count rates for Quadrant A Data is divided into 100 sec bins |
 |
 |
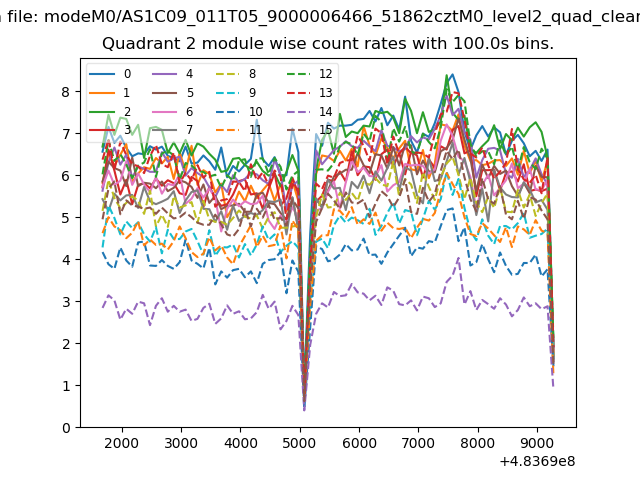
| Module-wise count rates for Quadrant B Data is divided into 100 sec bins |
 |
 |
| Module-wise count rates for Quadrant C Data is divided into 100 sec bins |
 |
 |
| Module-wise count rates for Quadrant D Data is divided into 100 sec bins |
 |
 |
| Parameter | Plot |
|---|---|
| CZT HV Monitor | 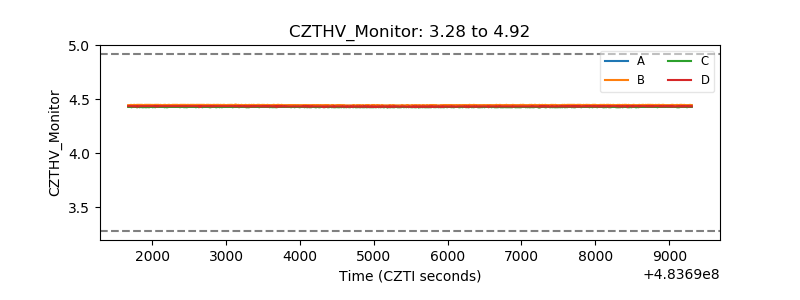 |
| D_VDD | 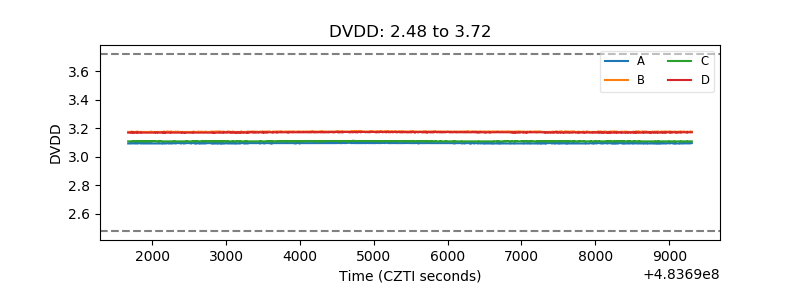 |
| Temperature 1 | 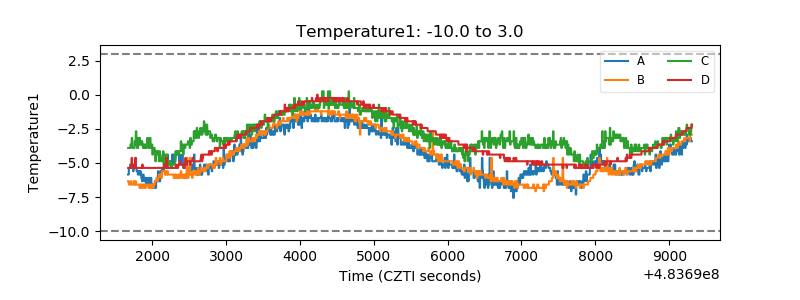 |
| Veto HV Monitor | 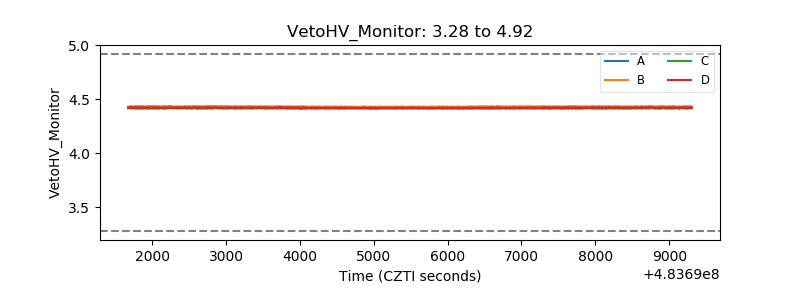 |
| Veto LLD | 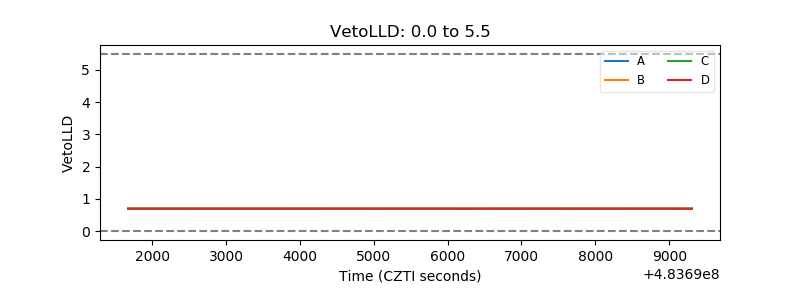 |
| Alpha Counter | 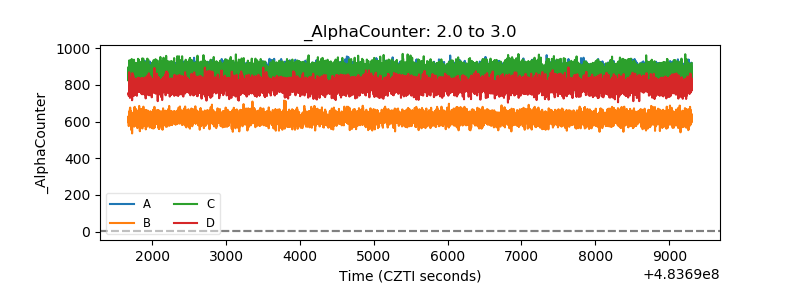 |
| _CPM_Rate | 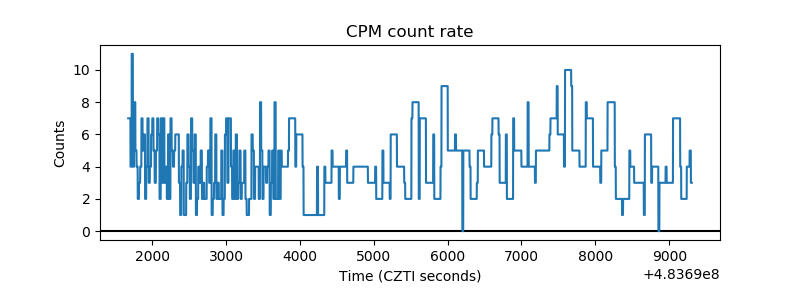 |
| CZT Counter | 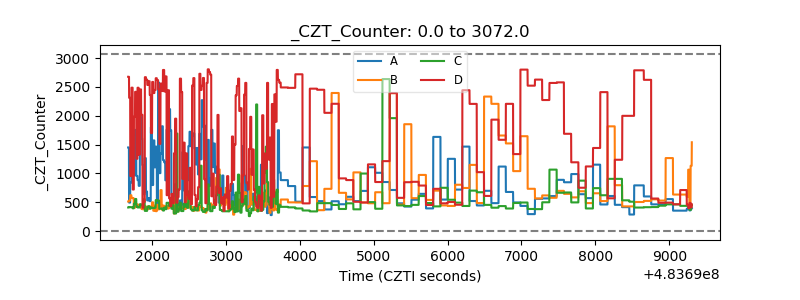 |
| +2.5 Volts monitor | 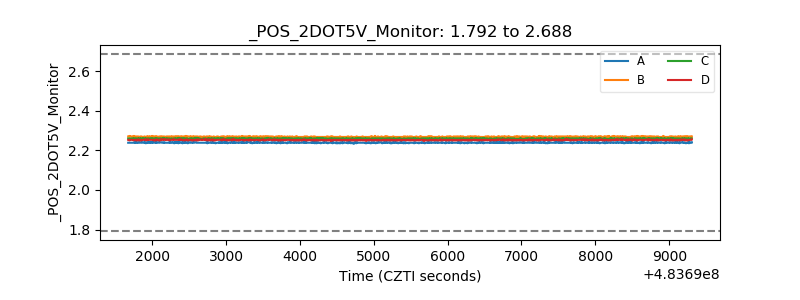 |
| +5 Volts monitor | 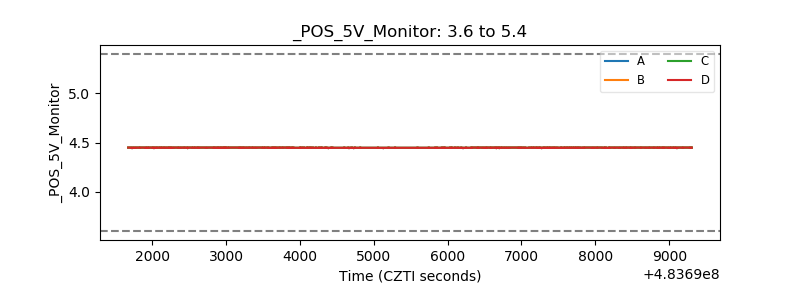 |
| _ROLL_ROT | 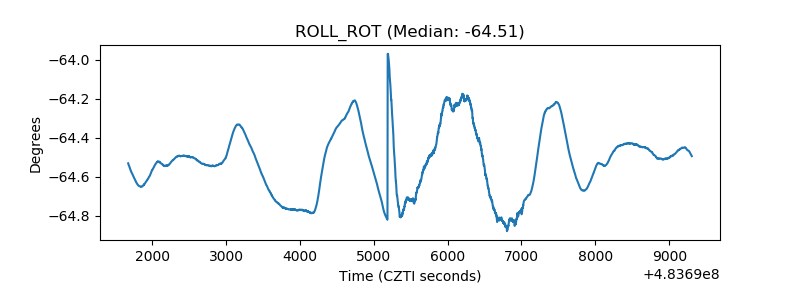 |
| _Roll_DEC | 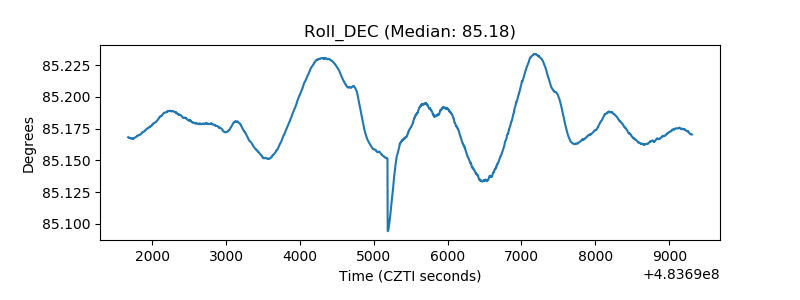 |
| _Roll_RA | 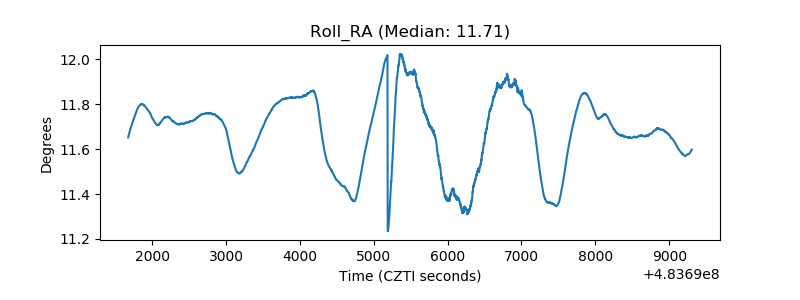 |
| Veto Counter | 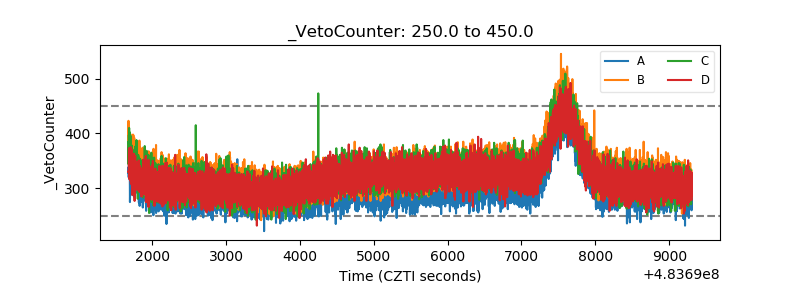 |