| Param | Original file | Final file |
|---|---|---|
| Filename | modeM0/AS1C09_011T05_9000006466_51863cztM0_level2.fits | modeM0/AS1C09_011T05_9000006466_51863cztM0_level2_quad_clean.evt |
| Size (bytes) | 709,583,040 | 93,522,240 |
| Size | 676.7 MB | 89.2 MB |
| Events in quadrant A | 5,258,488 | 637,176 |
| Events in quadrant B | 6,430,580 | 666,809 |
| Events in quadrant C | 3,741,089 | 632,287 |
| Events in quadrant D | 10,281,670 | 396,933 |
| Mode SS | |||
|---|---|---|---|
| Quadrant | BADHDUFLAG | Total packets | Discarded packets |
| A | 0 | 142 | 0 |
| B | 0 | 142 | 0 |
| C | 0 | 142 | 0 |
| D | 0 | 142 | 0 |
| Mode M0 | |||
|---|---|---|---|
| Quadrant | BADHDUFLAG | Total packets | Discarded packets |
| A | 0 | 20635 | 0 |
| B | 0 | 24004 | 0 |
| C | 0 | 16358 | 1 |
| D | 0 | 35495 | 0 |
| Quadrant | Total seconds | Saturated seconds | Saturation percentage |
|---|---|---|---|
| A | 7160 | 298 | 4.162011% |
| B | 7161 | 740 | 10.333752% |
| C | 7160 | 96 | 1.340782% |
| D | 7160 | 2570 | 35.893855% |
Noise dominated data is calculated using 1-second bins in cleaned event files. If a bin has >2000 counts, and if more than 50% of those come from <1% of pixels, then it is considered to be noise-dominated and hence unusable.
| Quadrant | # 1 sec bins | Bins with >0 counts | Bins with >2000 counts | High rate bins dominated by noise | Noise dominated (total time) | Noise dominated (detector-on time) | Marked lightcurve |
|---|---|---|---|---|---|---|---|
| A | 7160 | 7160 | 282 | 282 | 3.94% | 3.94% | 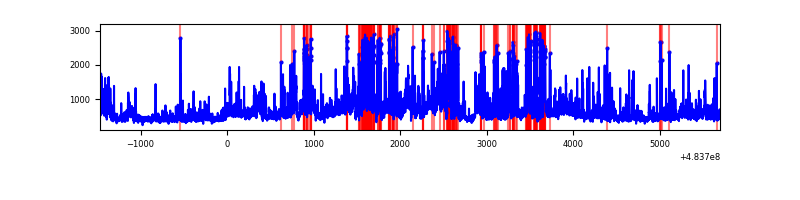 |
| B | 7161 | 7161 | 616 | 616 | 8.60% | 8.60% | 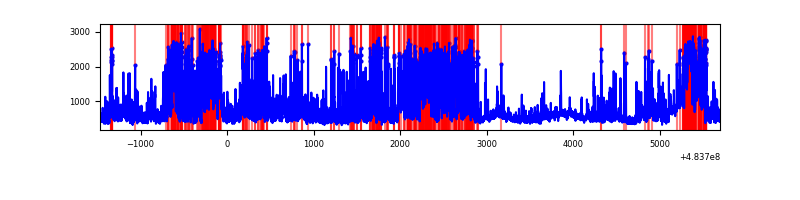 |
| C | 7160 | 7160 | 91 | 91 | 1.27% | 1.27% | 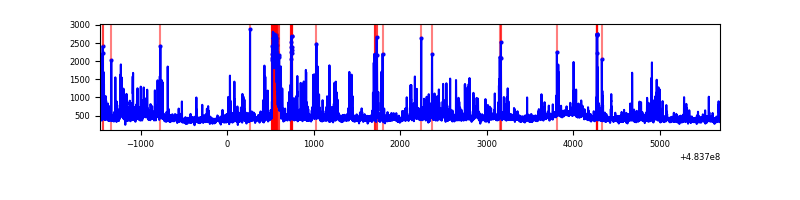 |
| D | 7160 | 7160 | 2512 | 2512 | 35.08% | 35.08% | 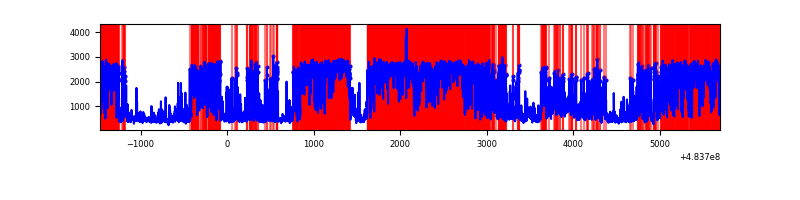 |
Top three noisy pixels from each quadrant. If the there are fewer than three noisy pixels in the level2.evt file, extra rows are filled as -1
| Pixel properties | Quadrant properties | ||||||
|---|---|---|---|---|---|---|---|
| Quadrant | DetID | PixID | Counts | Sigma | Mean | Median | Sigma |
| A | 11 | 3 | 933381 | 5116.77 | 732 | 715 | 182.3 |
| A | 12 | 3 | 355499 | 1946.41 | 732 | 715 | 182.3 |
| A | 4 | 3 | 147604 | 805.86 | 732 | 715 | 182.3 |
| B | 12 | 32 | 1492182 | 9768.83 | 713 | 687 | 152.7 |
| B | 10 | 44 | 916091 | 5995.61 | 713 | 687 | 152.7 |
| B | 5 | 250 | 377968 | 2471.07 | 713 | 687 | 152.7 |
| C | 13 | 3 | 236791 | 1202.2 | 714 | 709 | 196.4 |
| C | 0 | 193 | 143394 | 726.6 | 714 | 709 | 196.4 |
| C | 15 | 230 | 90379 | 456.63 | 714 | 709 | 196.4 |
| D | 11 | 129 | 6028920 | 36655.66 | 580 | 559 | 164.5 |
| D | 6 | 42 | 449911 | 2732.3 | 580 | 559 | 164.5 |
| D | 8 | 176 | 446923 | 2714.13 | 580 | 559 | 164.5 |
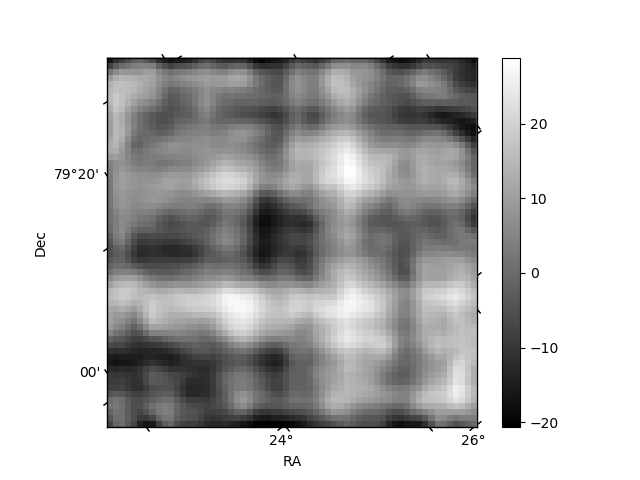
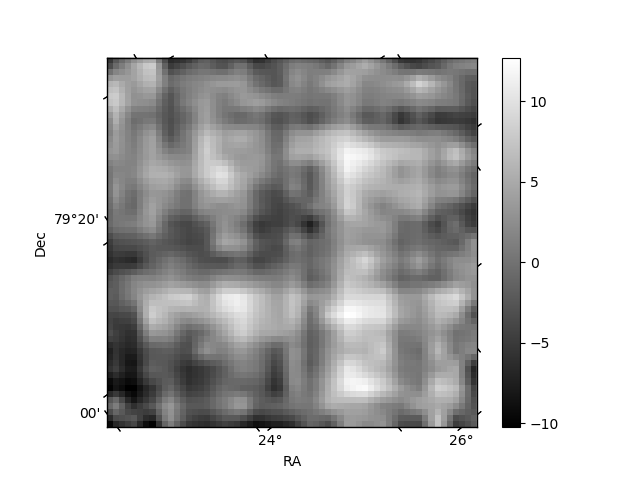
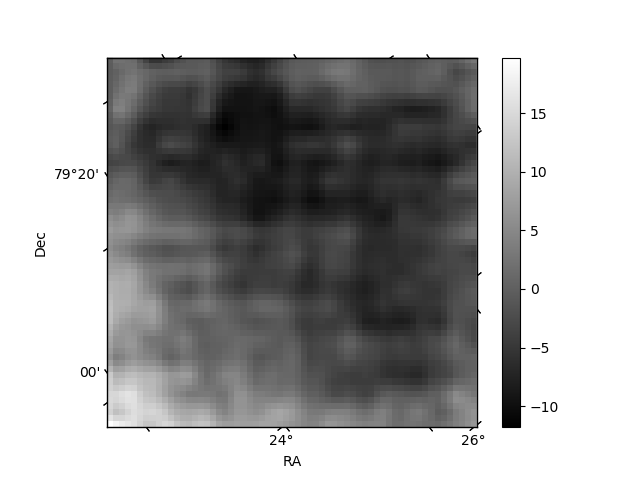
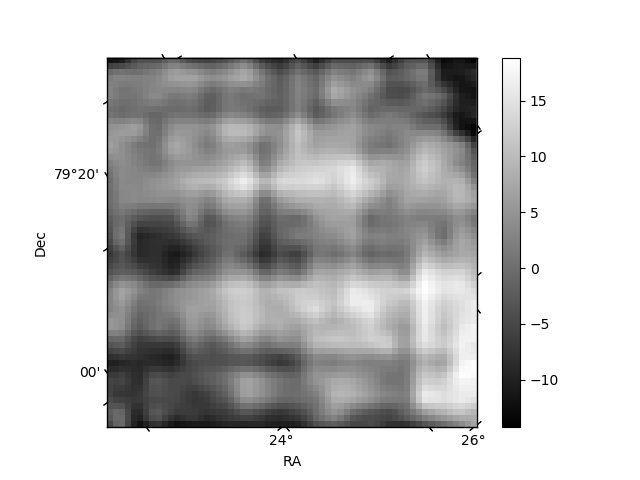
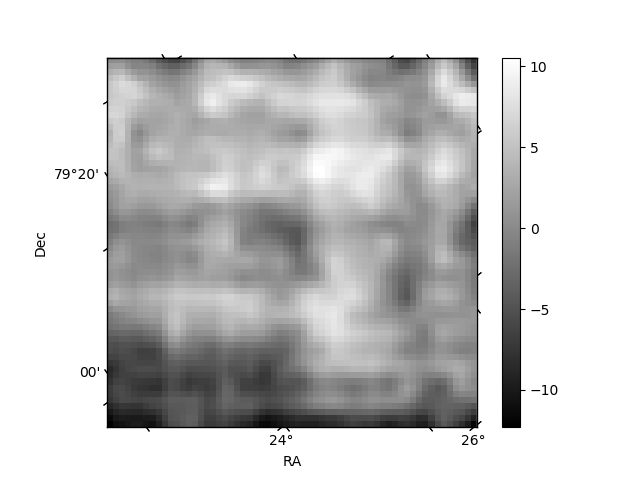
Histogram calculated using DETX and DETY for each event in the final _common_clean file
| Quadrant A | 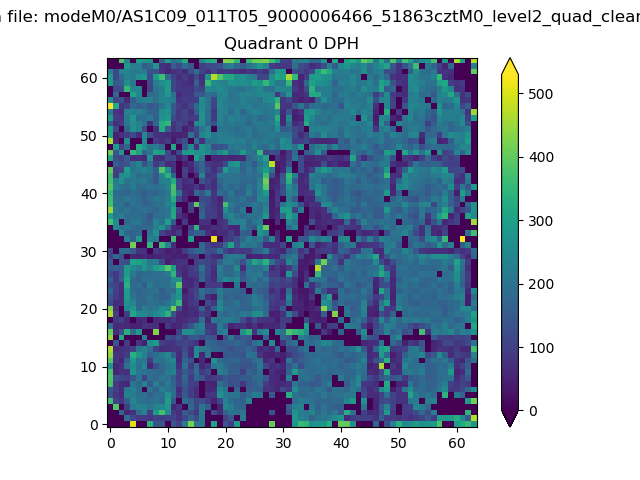 |
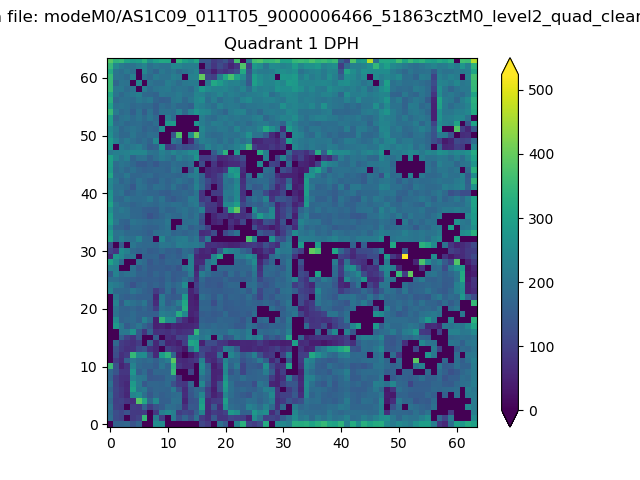 |
Quadrant B |
|---|---|---|---|
| Quadrant D | 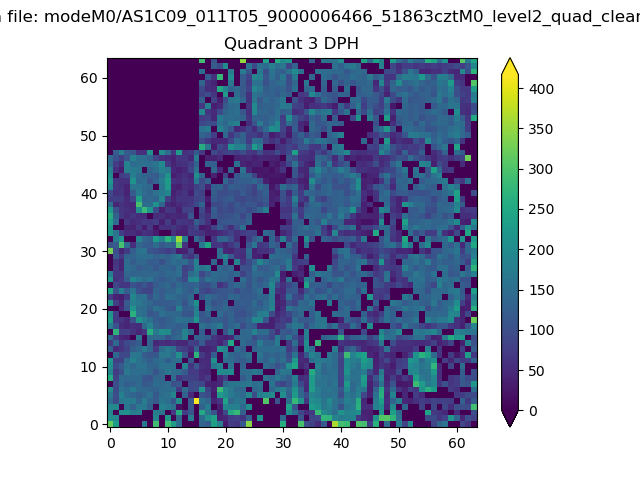 |
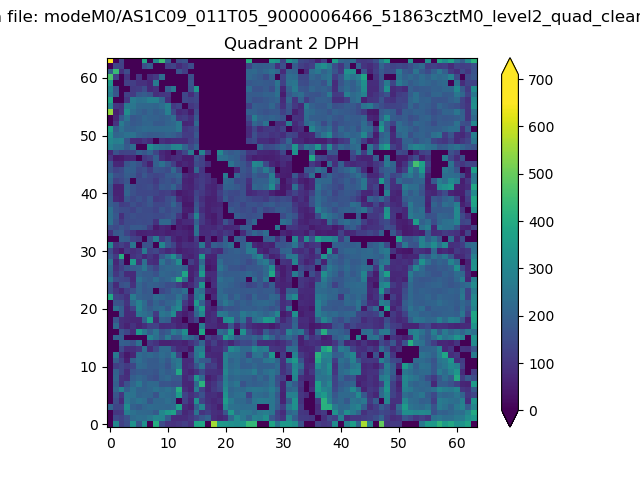 |
Quadrant C |
| Plot type | Count rate plots | Images |
|---|---|---|
| Comparison with Poisson distribution Blue bars denote a histogram of data divided into 1 sec bins. Red curve is a Poisson curve with rate = median count rate of data. |
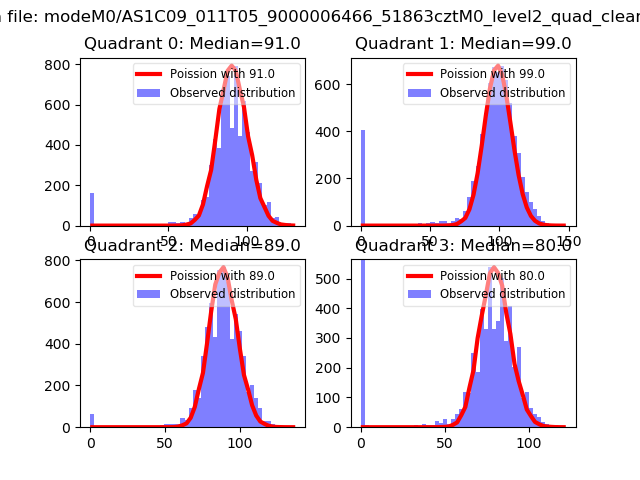 |
 |
| Quadrant-wise count rates Data is divided into 100 sec bins |
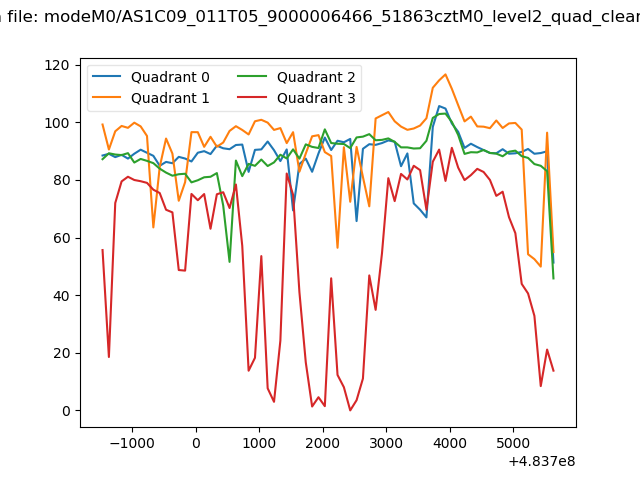 |
|
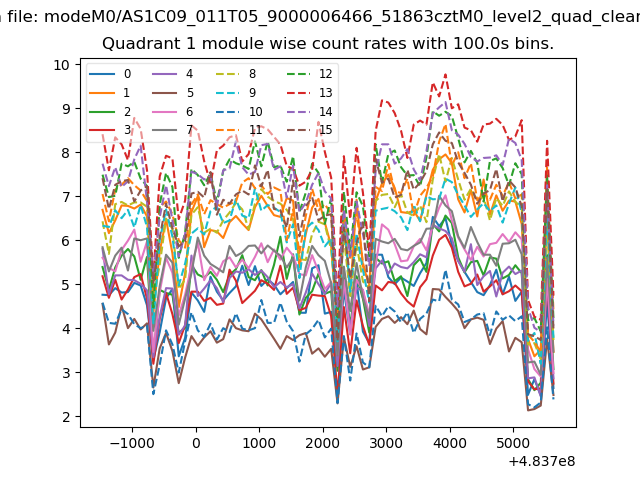
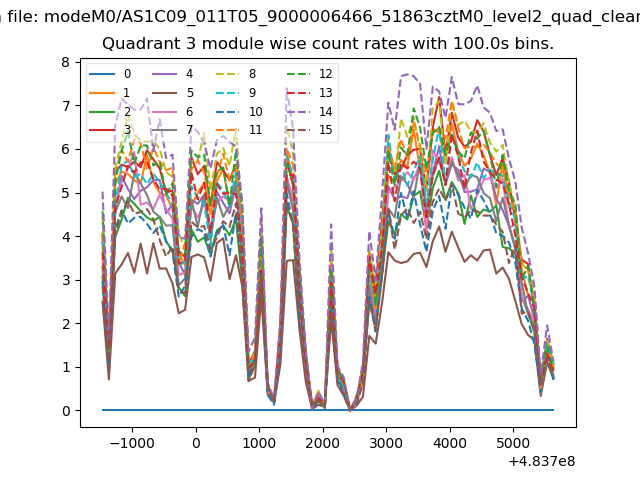
| Module-wise count rates for Quadrant A Data is divided into 100 sec bins |
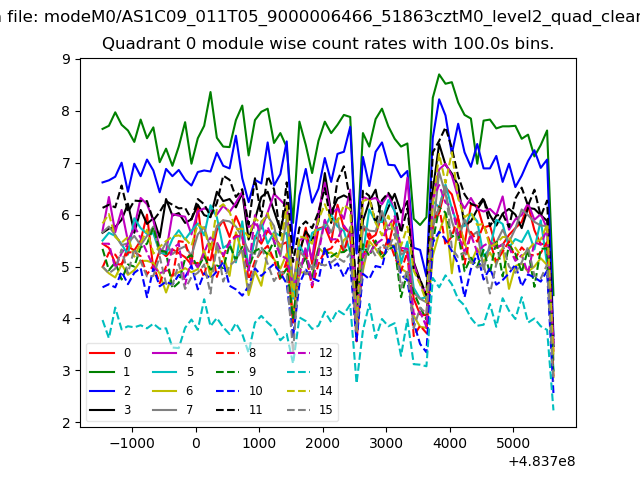 |
 |
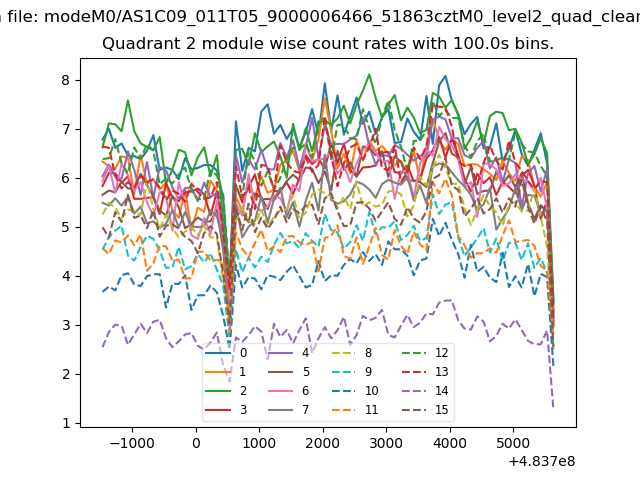
| Module-wise count rates for Quadrant B Data is divided into 100 sec bins |
 |
 |
| Module-wise count rates for Quadrant C Data is divided into 100 sec bins |
 |
 |
| Module-wise count rates for Quadrant D Data is divided into 100 sec bins |
 |
 |
| Parameter | Plot |
|---|---|
| CZT HV Monitor | 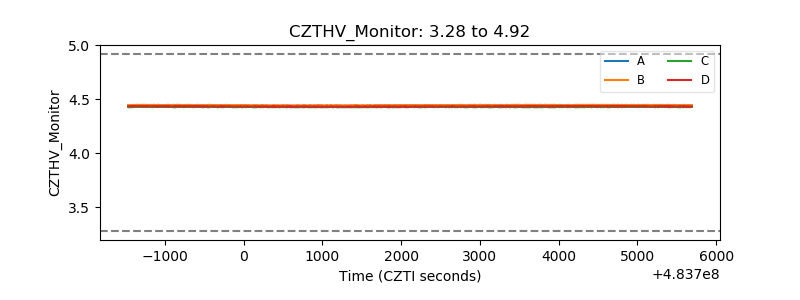 |
| D_VDD | 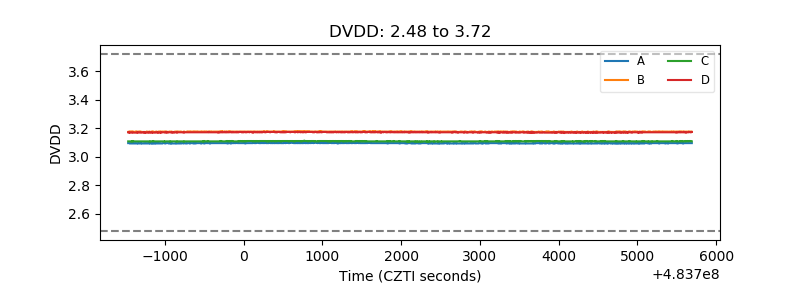 |
| Temperature 1 | 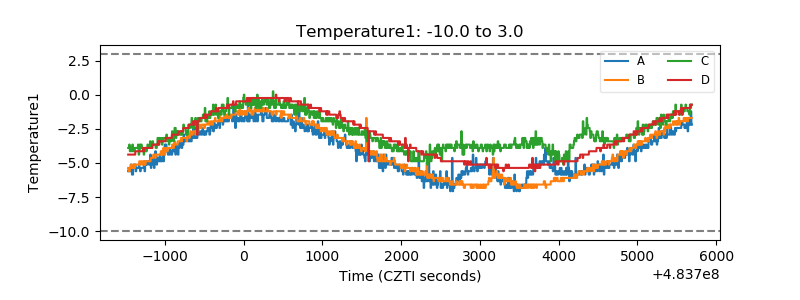 |
| Veto HV Monitor | 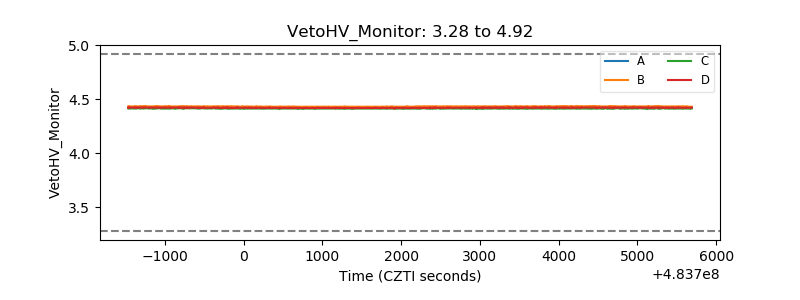 |
| Veto LLD | 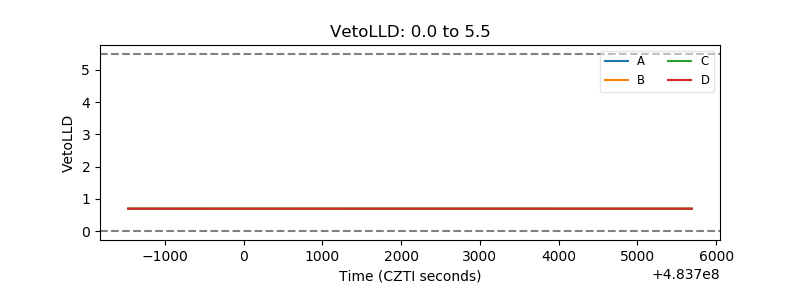 |
| Alpha Counter | 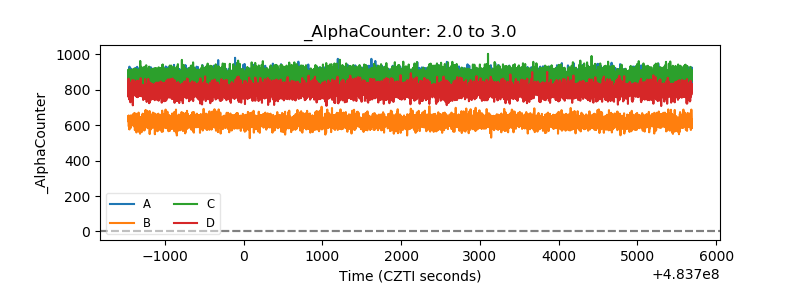 |
| _CPM_Rate | 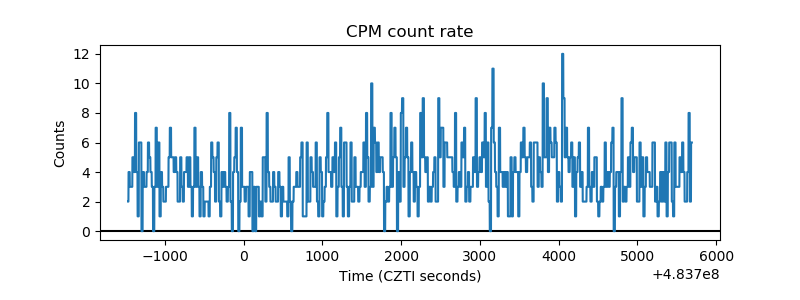 |
| CZT Counter | 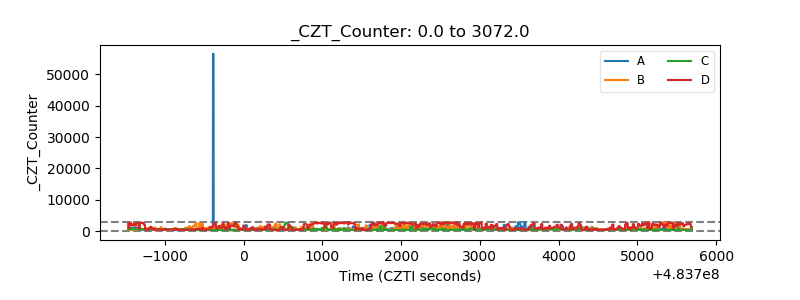 |
| +2.5 Volts monitor | 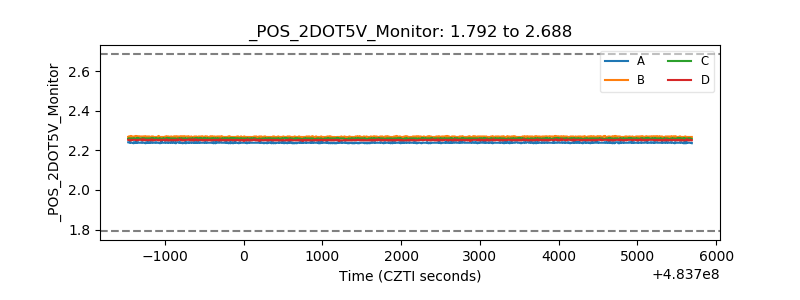 |
| +5 Volts monitor |  |
| _ROLL_ROT | 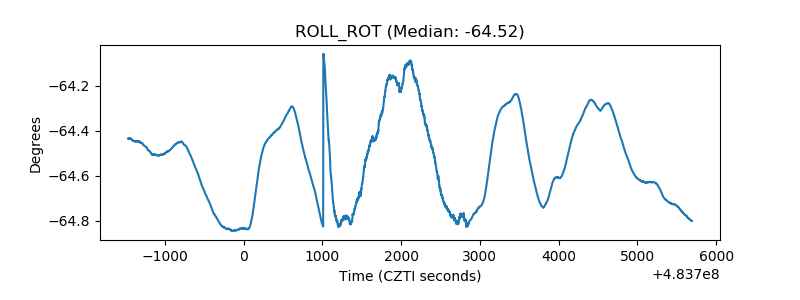 |
| _Roll_DEC | 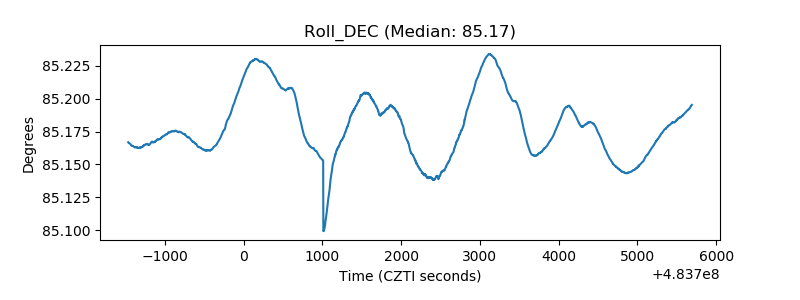 |
| _Roll_RA | 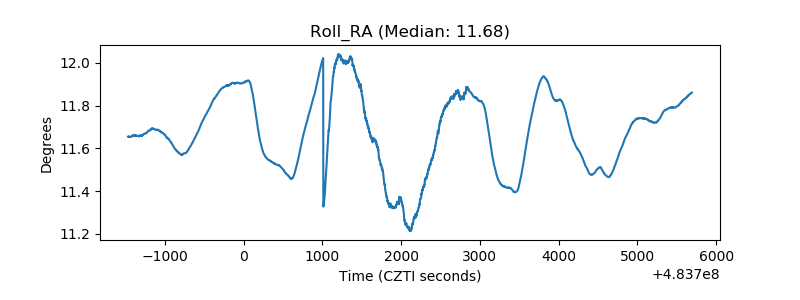 |
| Veto Counter | 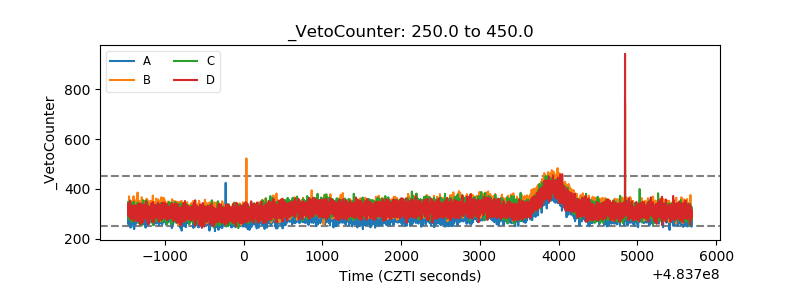 |