| Param | Original file | Final file |
|---|---|---|
| Filename | modeM0/AS1C09_011T05_9000006466_51864cztM0_level2.fits | modeM0/AS1C09_011T05_9000006466_51864cztM0_level2_quad_clean.evt |
| Size (bytes) | 804,237,120 | 94,633,920 |
| Size | 767.0 MB | 90.2 MB |
| Events in quadrant A | 6,003,598 | 630,368 |
| Events in quadrant B | 6,362,180 | 687,906 |
| Events in quadrant C | 4,302,148 | 647,816 |
| Events in quadrant D | 12,536,017 | 389,215 |
| Mode SS | |||
|---|---|---|---|
| Quadrant | BADHDUFLAG | Total packets | Discarded packets |
| A | 0 | 146 | 0 |
| B | 0 | 146 | 0 |
| C | 0 | 146 | 0 |
| D | 0 | 146 | 0 |
| Mode M0 | |||
|---|---|---|---|
| Quadrant | BADHDUFLAG | Total packets | Discarded packets |
| A | 0 | 22827 | 1 |
| B | 0 | 23933 | 0 |
| C | 0 | 18040 | 0 |
| D | 0 | 42291 | 0 |
| Quadrant | Total seconds | Saturated seconds | Saturation percentage |
|---|---|---|---|
| A | 7322 | 555 | 7.579896% |
| B | 7322 | 671 | 9.164163% |
| C | 7322 | 101 | 1.379405% |
| D | 7323 | 3089 | 42.182166% |
Noise dominated data is calculated using 1-second bins in cleaned event files. If a bin has >2000 counts, and if more than 50% of those come from <1% of pixels, then it is considered to be noise-dominated and hence unusable.
| Quadrant | # 1 sec bins | Bins with >0 counts | Bins with >2000 counts | High rate bins dominated by noise | Noise dominated (total time) | Noise dominated (detector-on time) | Marked lightcurve |
|---|---|---|---|---|---|---|---|
| A | 7322 | 7322 | 444 | 444 | 6.06% | 6.06% | 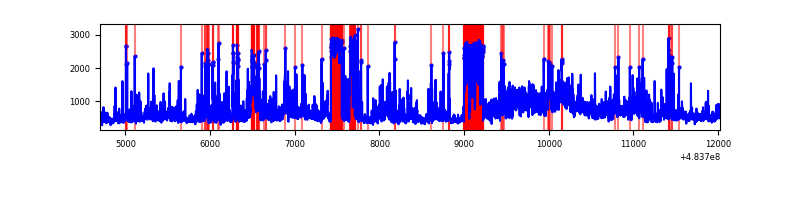 |
| B | 7322 | 7322 | 533 | 533 | 7.28% | 7.28% | 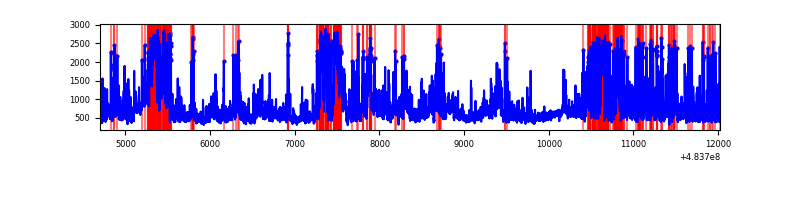 |
| C | 7322 | 7322 | 106 | 106 | 1.45% | 1.45% | 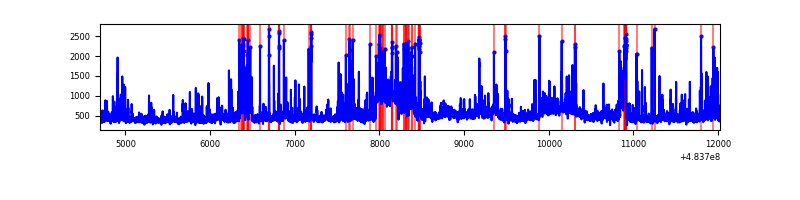 |
| D | 7322 | 7322 | 3054 | 3054 | 41.71% | 41.71% | 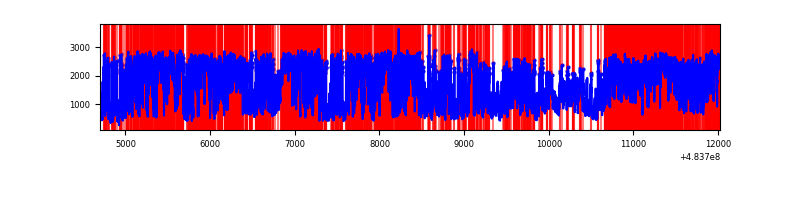 |
Top three noisy pixels from each quadrant. If the there are fewer than three noisy pixels in the level2.evt file, extra rows are filled as -1
| Pixel properties | Quadrant properties | ||||||
|---|---|---|---|---|---|---|---|
| Quadrant | DetID | PixID | Counts | Sigma | Mean | Median | Sigma |
| A | 0 | 250 | 1143700 | 6242.36 | 749 | 732 | 183.1 |
| A | 11 | 3 | 485333 | 2646.66 | 749 | 732 | 183.1 |
| A | 3 | 14 | 310353 | 1691.01 | 749 | 732 | 183.1 |
| B | 12 | 32 | 1151395 | 7289.42 | 741 | 715 | 157.9 |
| B | 10 | 44 | 1009417 | 6390.0 | 741 | 715 | 157.9 |
| B | 5 | 250 | 298886 | 1888.87 | 741 | 715 | 157.9 |
| C | 15 | 230 | 264923 | 1290.91 | 745 | 738 | 204.6 |
| C | 15 | 219 | 242919 | 1183.39 | 745 | 738 | 204.6 |
| C | 13 | 3 | 150768 | 733.1 | 745 | 738 | 204.6 |
| D | 11 | 129 | 5147304 | 29990.81 | 618 | 596 | 171.6 |
| D | 6 | 42 | 2432153 | 14169.13 | 618 | 596 | 171.6 |
| D | 8 | 209 | 598378 | 3483.38 | 618 | 596 | 171.6 |
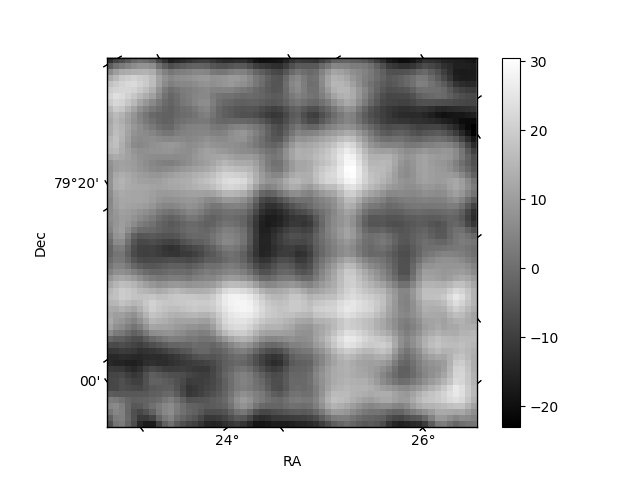
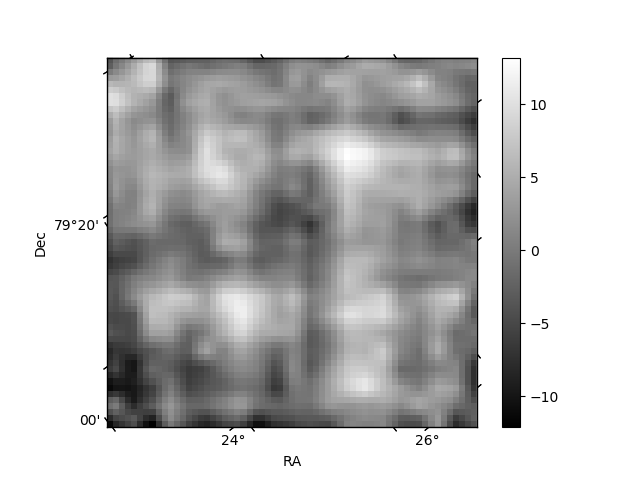
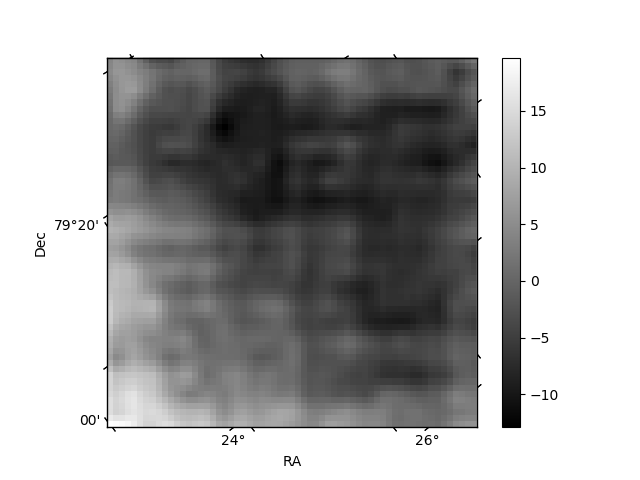
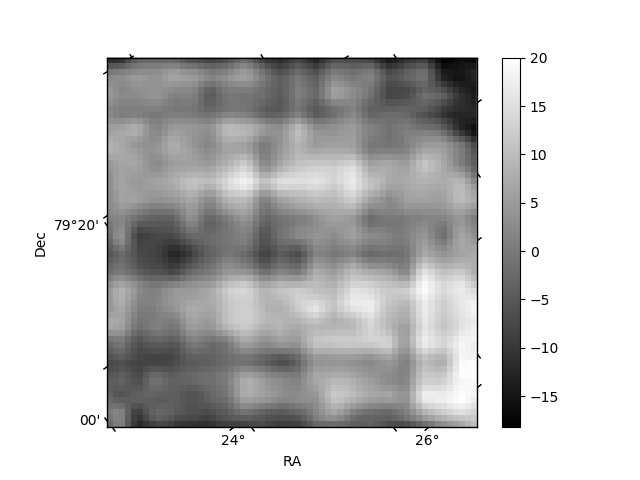
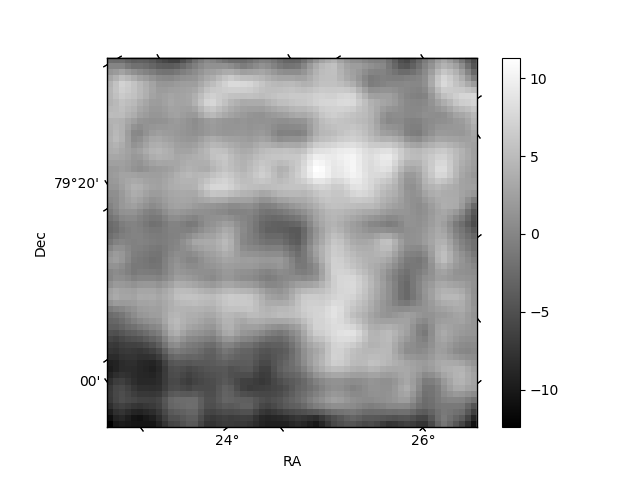
Histogram calculated using DETX and DETY for each event in the final _common_clean file
| Quadrant A | 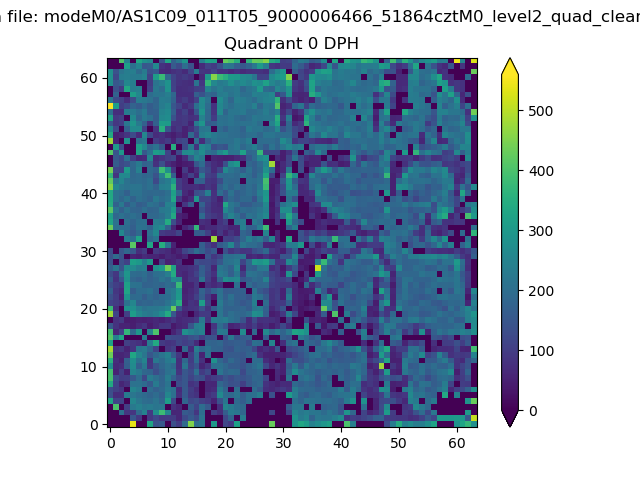 |
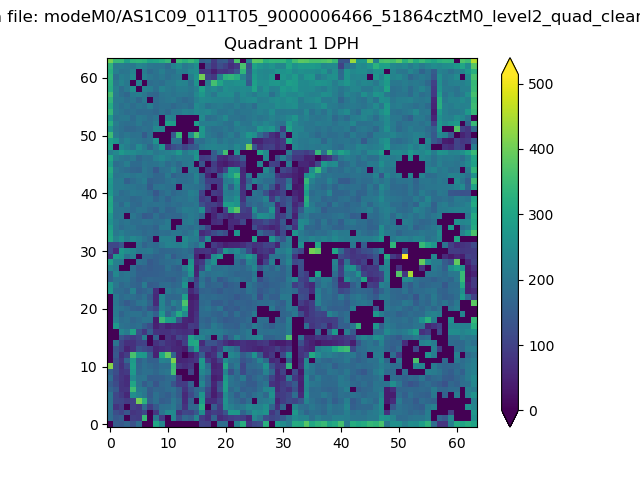 |
Quadrant B |
|---|---|---|---|
| Quadrant D | 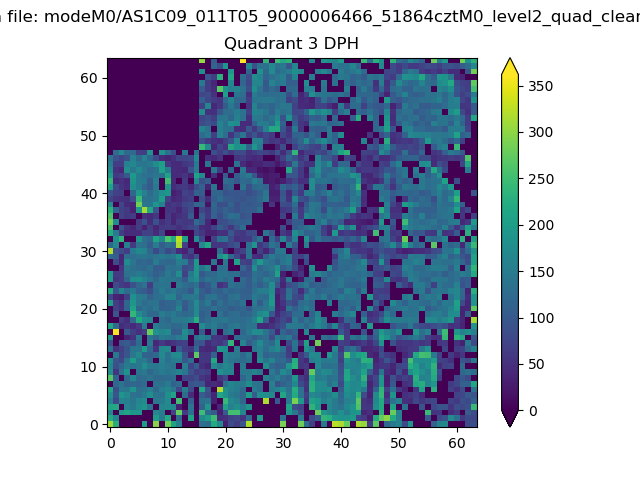 |
 |
Quadrant C |
| Plot type | Count rate plots | Images |
|---|---|---|
| Comparison with Poisson distribution Blue bars denote a histogram of data divided into 1 sec bins. Red curve is a Poisson curve with rate = median count rate of data. |
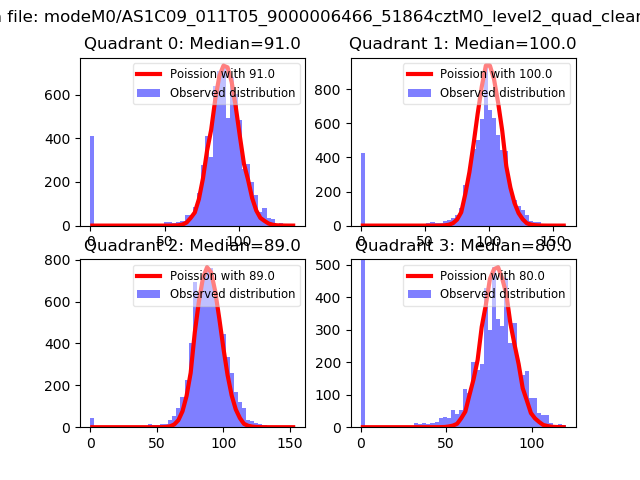 |
 |
| Quadrant-wise count rates Data is divided into 100 sec bins |
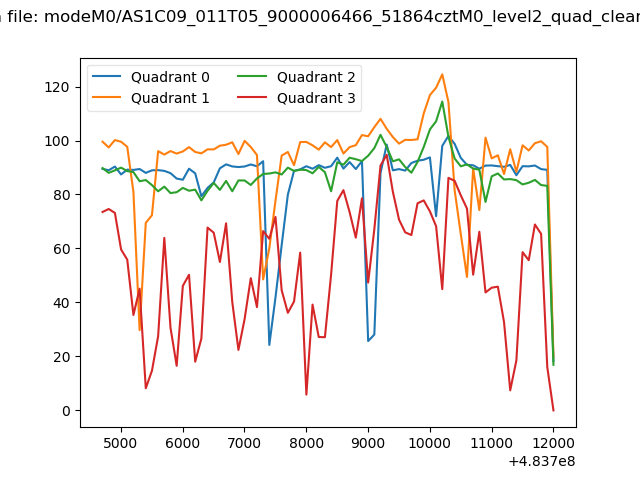 |
|
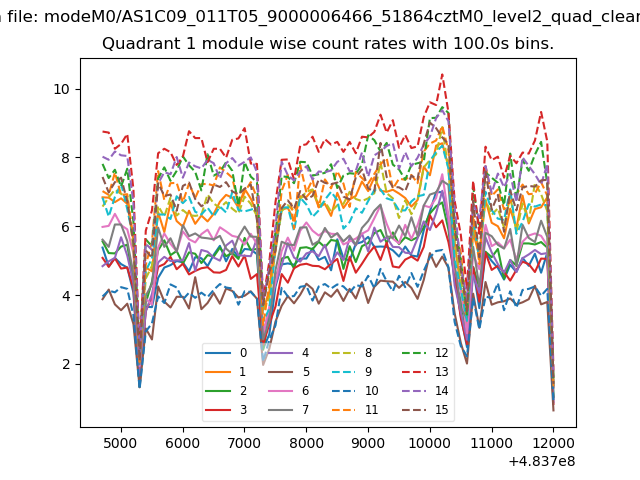
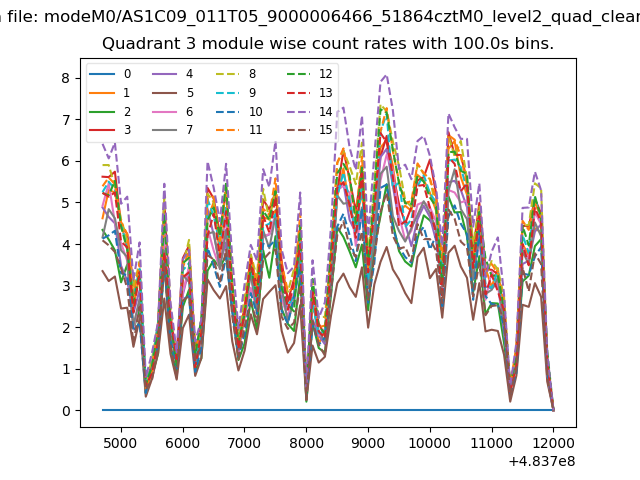
| Module-wise count rates for Quadrant A Data is divided into 100 sec bins |
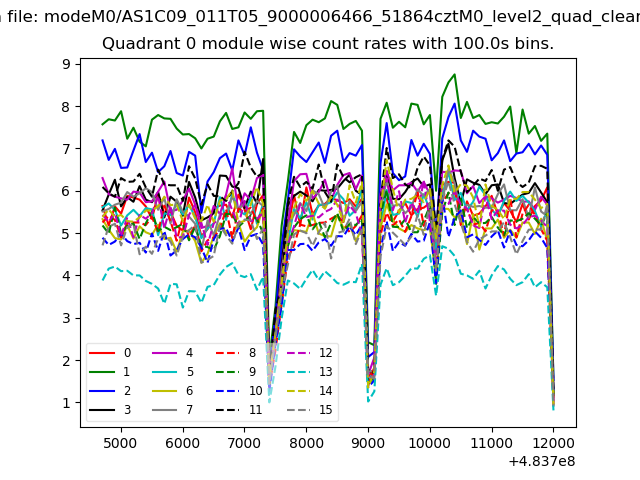 |
 |
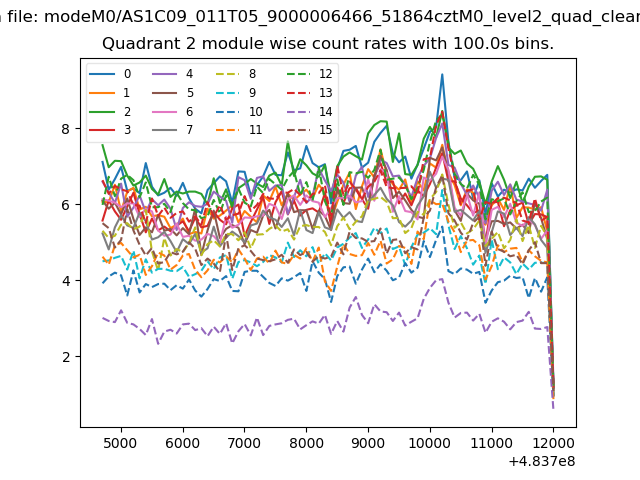
| Module-wise count rates for Quadrant B Data is divided into 100 sec bins |
 |
 |
| Module-wise count rates for Quadrant C Data is divided into 100 sec bins |
 |
 |
| Module-wise count rates for Quadrant D Data is divided into 100 sec bins |
 |
 |
| Parameter | Plot |
|---|---|
| CZT HV Monitor | 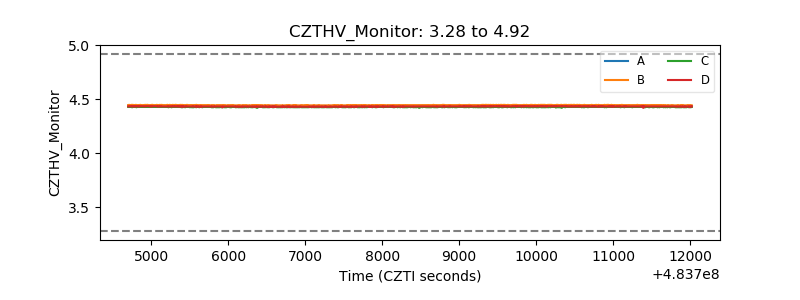 |
| D_VDD | 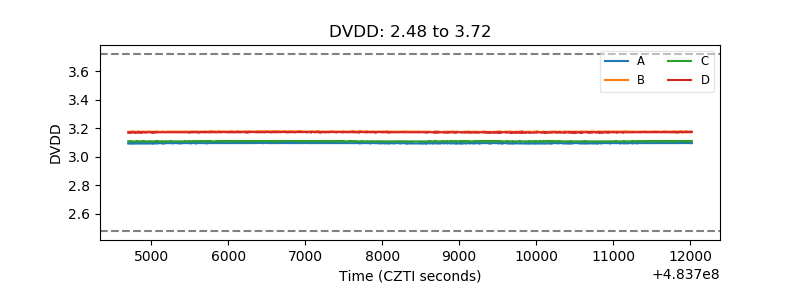 |
| Temperature 1 | 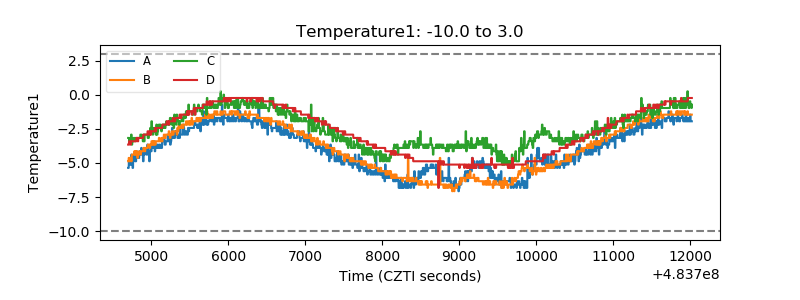 |
| Veto HV Monitor | 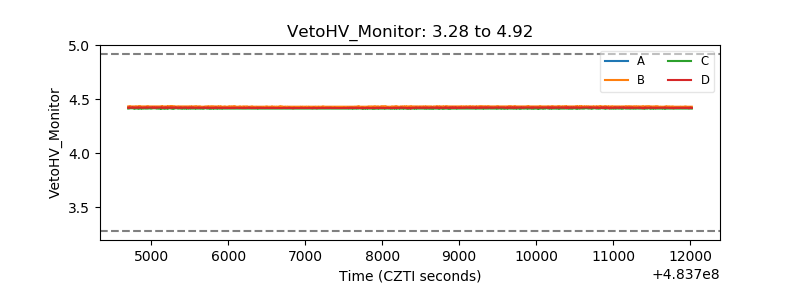 |
| Veto LLD | 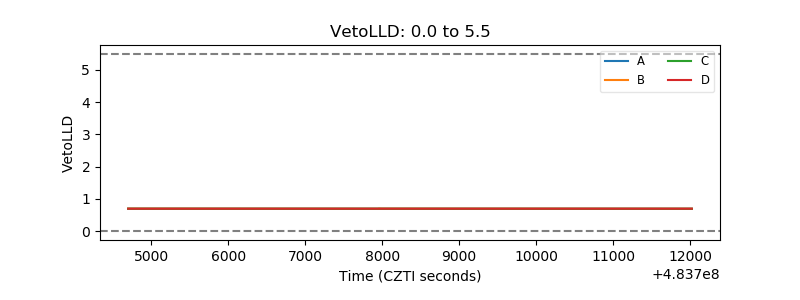 |
| Alpha Counter | 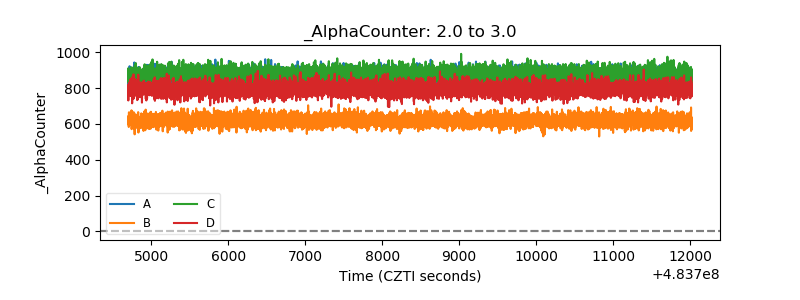 |
| _CPM_Rate | 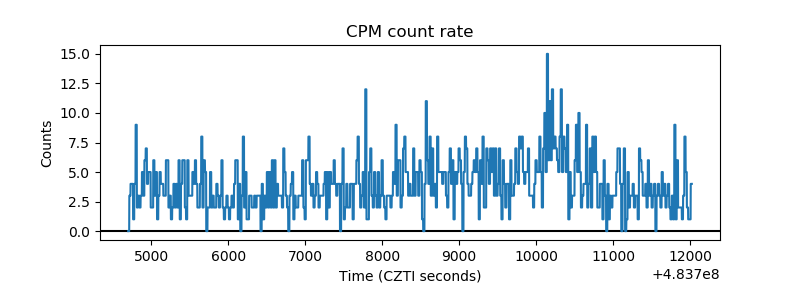 |
| CZT Counter | 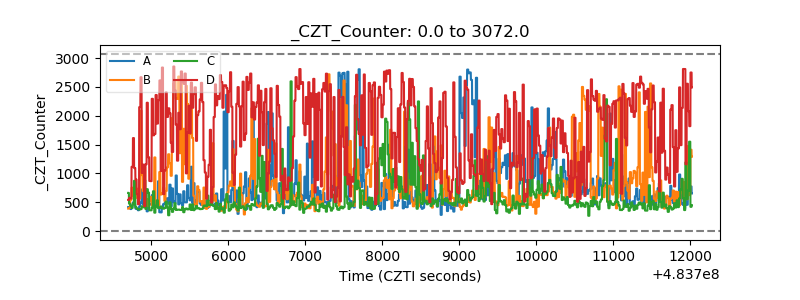 |
| +2.5 Volts monitor | 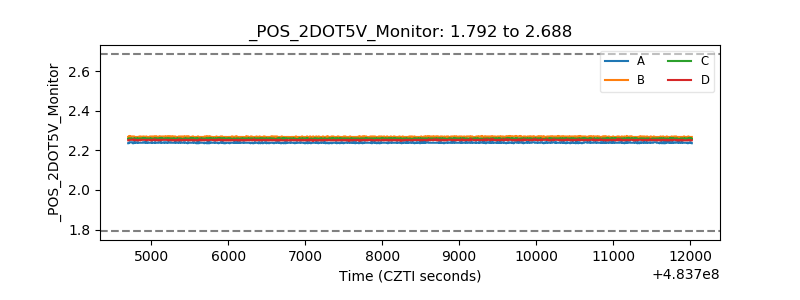 |
| +5 Volts monitor | 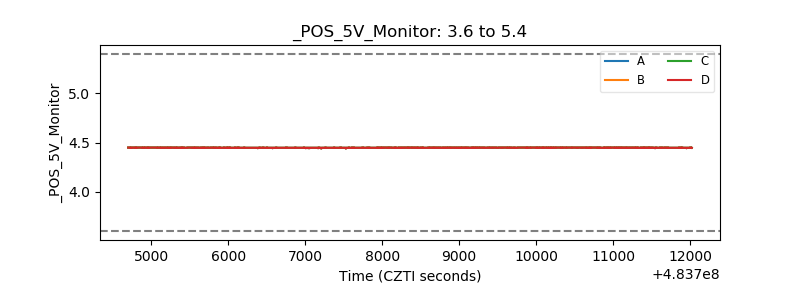 |
| _ROLL_ROT | 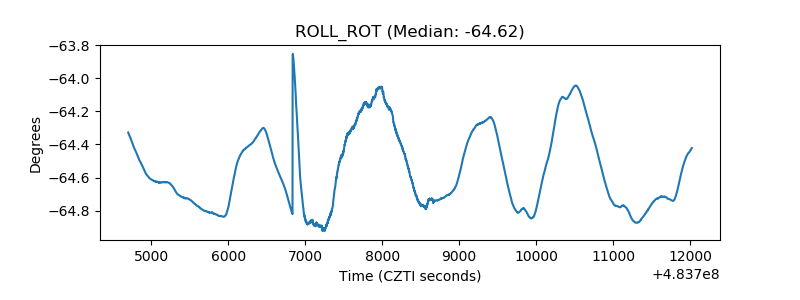 |
| _Roll_DEC | 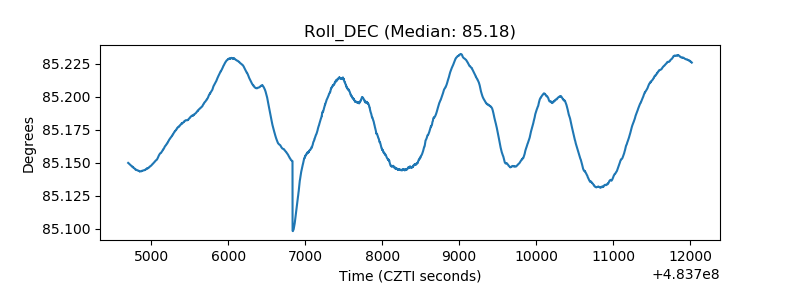 |
| _Roll_RA | 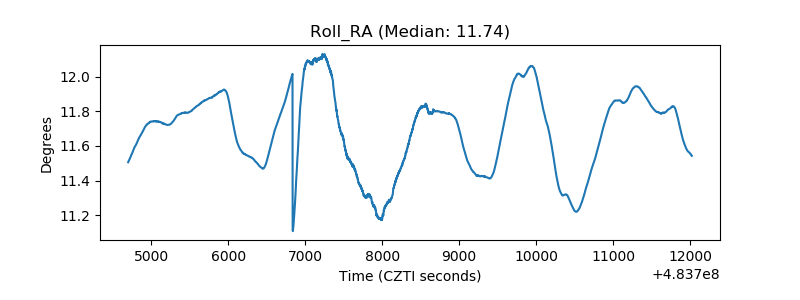 |
| Veto Counter | 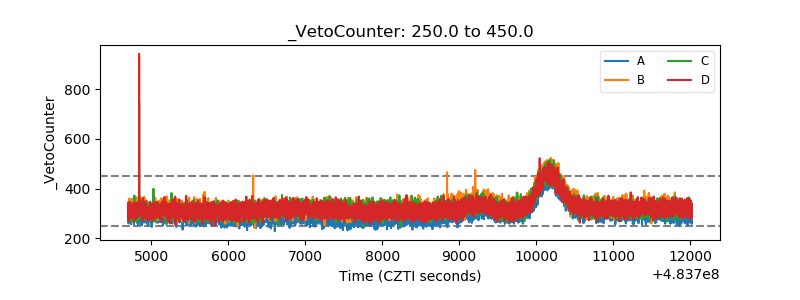 |