| Param | Original file | Final file |
|---|---|---|
| Filename | modeM0/AS1C09_011T05_9000006466_51867cztM0_level2.fits | modeM0/AS1C09_011T05_9000006466_51867cztM0_level2_quad_clean.evt |
| Size (bytes) | 2,176,453,440 | 226,229,760 |
| Size | 2.0 GB | 215.7 MB |
| Events in quadrant A | 14,044,105 | 1,593,886 |
| Events in quadrant B | 19,799,008 | 1,568,023 |
| Events in quadrant C | 13,895,140 | 1,544,066 |
| Events in quadrant D | 31,395,581 | 861,185 |
| Mode SS | |||
|---|---|---|---|
| Quadrant | BADHDUFLAG | Total packets | Discarded packets |
| A | 0 | 378 | 0 |
| B | 0 | 378 | 0 |
| C | 0 | 378 | 0 |
| D | 0 | 378 | 0 |
| Mode M0 | |||
|---|---|---|---|
| Quadrant | BADHDUFLAG | Total packets | Discarded packets |
| A | 0 | 54272 | 3 |
| B | 0 | 71770 | 3 |
| C | 0 | 54241 | 3 |
| D | 0 | 106108 | 3 |
| Mode M9 | |||
|---|---|---|---|
| Quadrant | BADHDUFLAG | Total packets | Discarded packets |
| A | 0 | 15 | 0 |
| B | 0 | 15 | 0 |
| C | 0 | 15 | 0 |
| D | 0 | 15 | 0 |
| Quadrant | Total seconds | Saturated seconds | Saturation percentage |
|---|---|---|---|
| A | 18586 | 941 | 5.062951% |
| B | 18586 | 3143 | 16.910578% |
| C | 18586 | 1259 | 6.773916% |
| D | 18587 | 8574 | 46.129015% |
Noise dominated data is calculated using 1-second bins in cleaned event files. If a bin has >2000 counts, and if more than 50% of those come from <1% of pixels, then it is considered to be noise-dominated and hence unusable.
| Quadrant | # 1 sec bins | Bins with >0 counts | Bins with >2000 counts | High rate bins dominated by noise | Noise dominated (total time) | Noise dominated (detector-on time) | Marked lightcurve |
|---|---|---|---|---|---|---|---|
| A | 20050 | 18587 | 752 | 752 | 3.75% | 4.05% | 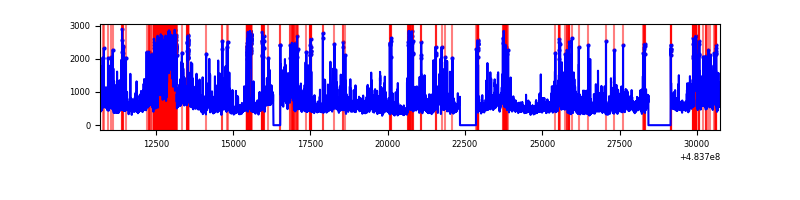 |
| B | 20050 | 18587 | 2383 | 2383 | 11.89% | 12.82% | 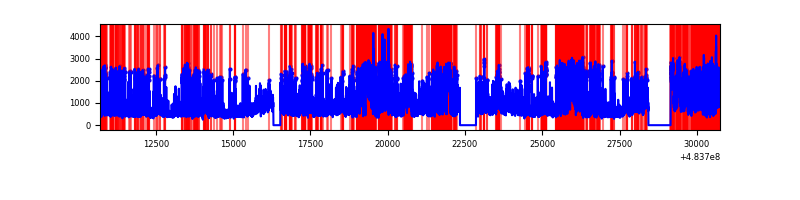 |
| C | 20050 | 18587 | 1041 | 1041 | 5.19% | 5.60% | 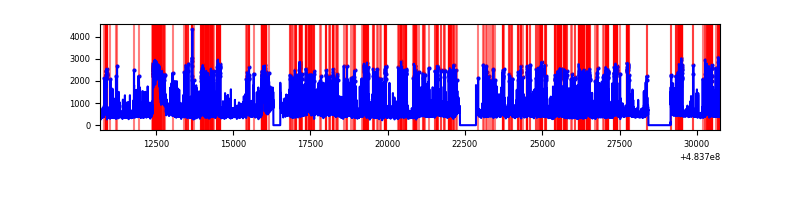 |
| D | 20051 | 18588 | 8322 | 8322 | 41.50% | 44.77% | 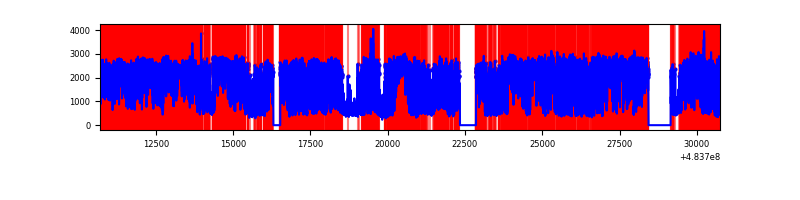 |
Top three noisy pixels from each quadrant. If the there are fewer than three noisy pixels in the level2.evt file, extra rows are filled as -1
| Pixel properties | Quadrant properties | ||||||
|---|---|---|---|---|---|---|---|
| Quadrant | DetID | PixID | Counts | Sigma | Mean | Median | Sigma |
| A | 12 | 3 | 1730131 | 3634.56 | 1926 | 1878 | 475.5 |
| A | 4 | 249 | 782051 | 1640.72 | 1926 | 1878 | 475.5 |
| A | 4 | 3 | 619367 | 1298.59 | 1926 | 1878 | 475.5 |
| B | 4 | 170 | 4961439 | 12787.78 | 1828 | 1765 | 387.8 |
| B | 12 | 32 | 2971610 | 7657.3 | 1828 | 1765 | 387.8 |
| B | 10 | 44 | 1698914 | 4375.84 | 1828 | 1765 | 387.8 |
| C | 14 | 80 | 1974872 | 3866.12 | 1870 | 1861 | 510.3 |
| C | 15 | 147 | 821534 | 1606.15 | 1870 | 1861 | 510.3 |
| C | 15 | 230 | 783179 | 1530.99 | 1870 | 1861 | 510.3 |
| D | 11 | 129 | 16396019 | 39920.72 | 1462 | 1407 | 410.7 |
| D | 6 | 42 | 4840433 | 11782.98 | 1462 | 1407 | 410.7 |
| D | 7 | 60 | 456658 | 1108.53 | 1462 | 1407 | 410.7 |
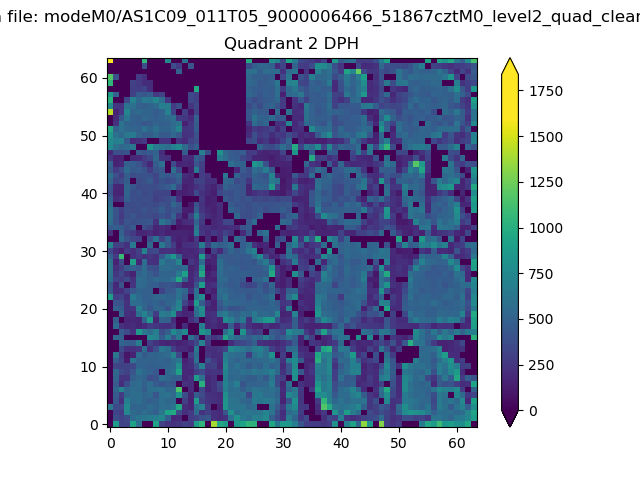
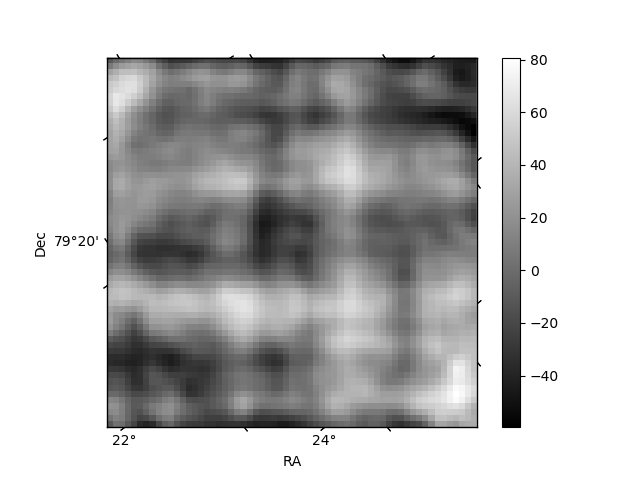
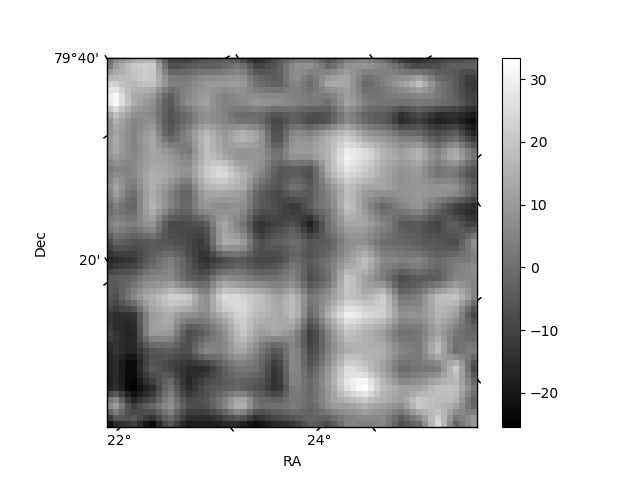
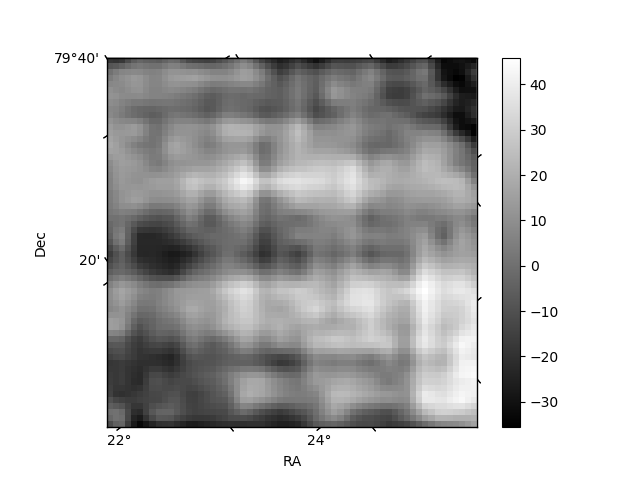
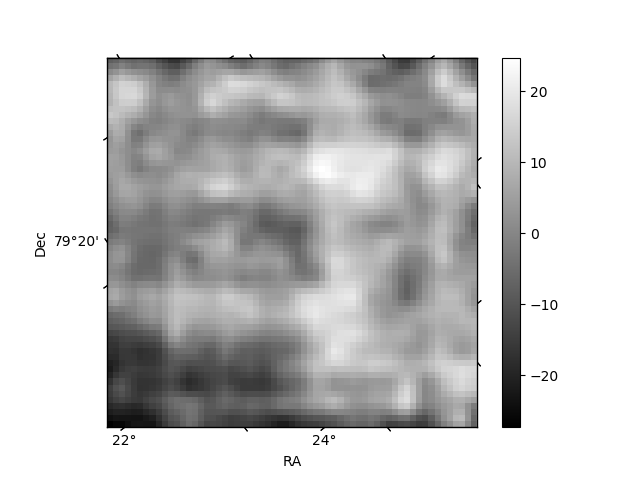
Histogram calculated using DETX and DETY for each event in the final _common_clean file
| Quadrant A | 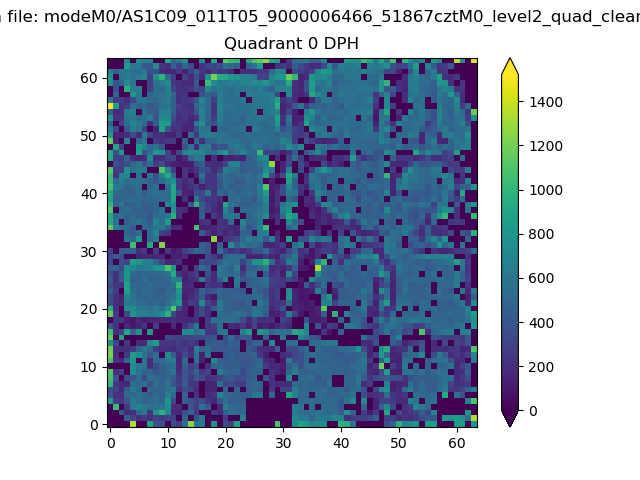 |
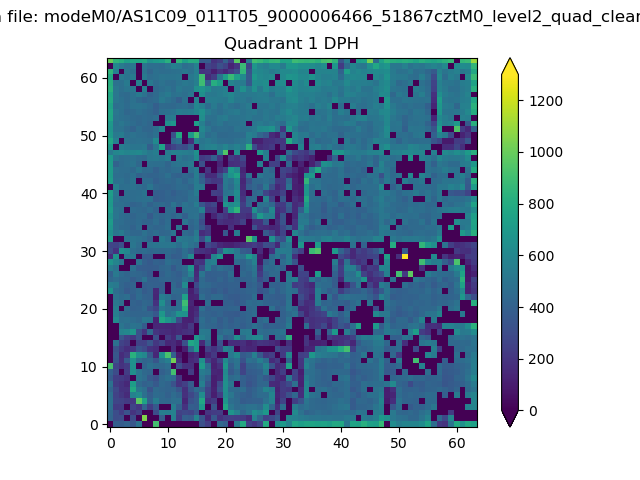 |
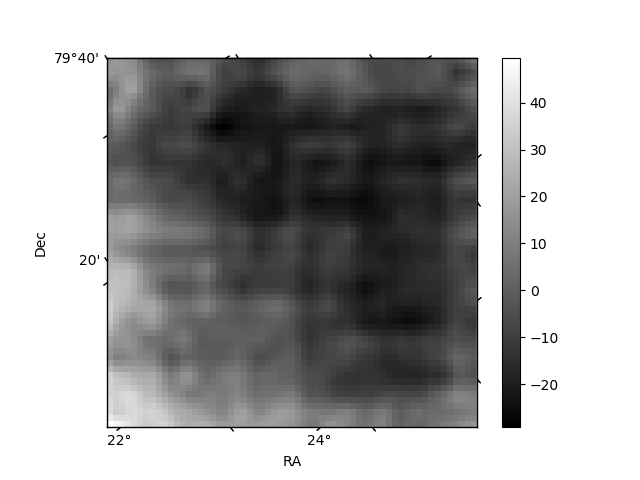
Quadrant B |
|---|---|---|---|
| Quadrant D | 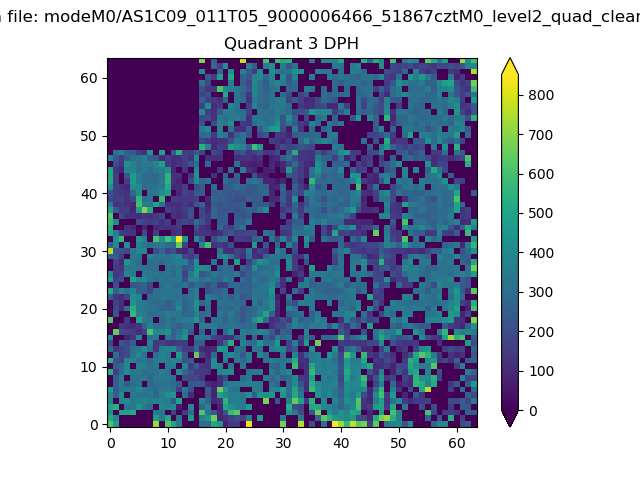 |
 |
Quadrant C |
| Plot type | Count rate plots | Images |
|---|---|---|
| Comparison with Poisson distribution Blue bars denote a histogram of data divided into 1 sec bins. Red curve is a Poisson curve with rate = median count rate of data. |
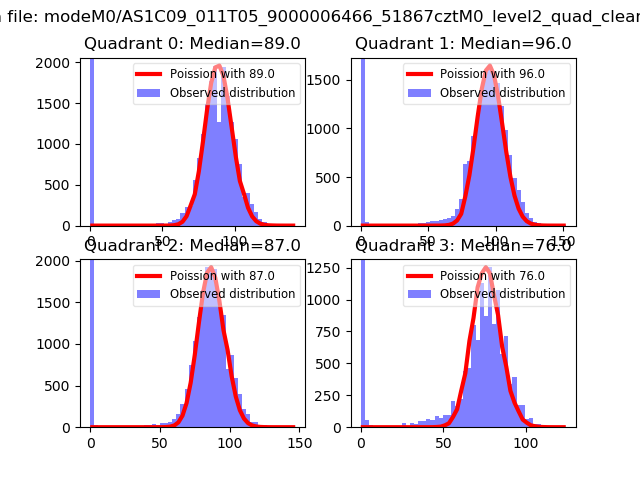 |
 |
| Quadrant-wise count rates Data is divided into 100 sec bins |
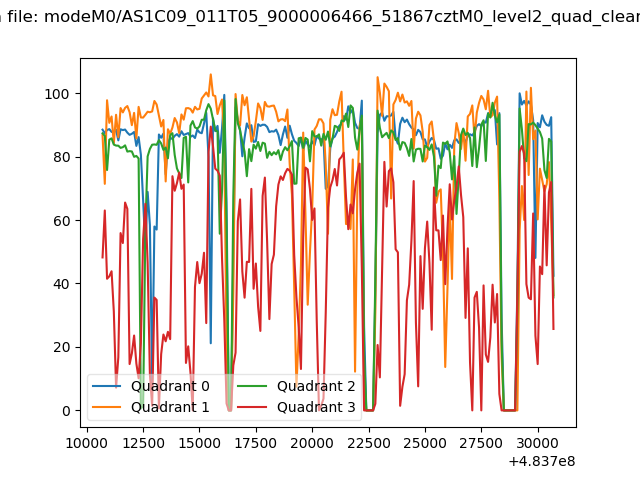 |
|
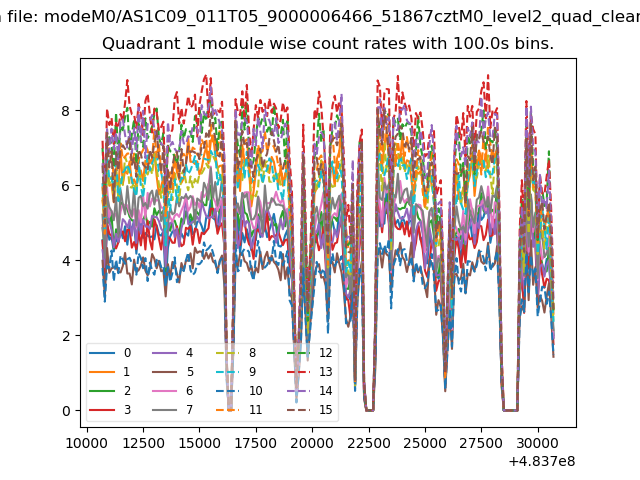
| Module-wise count rates for Quadrant A Data is divided into 100 sec bins |
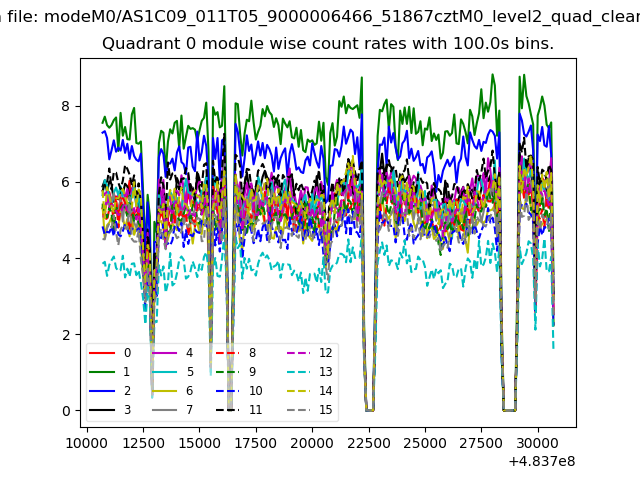 |
 |
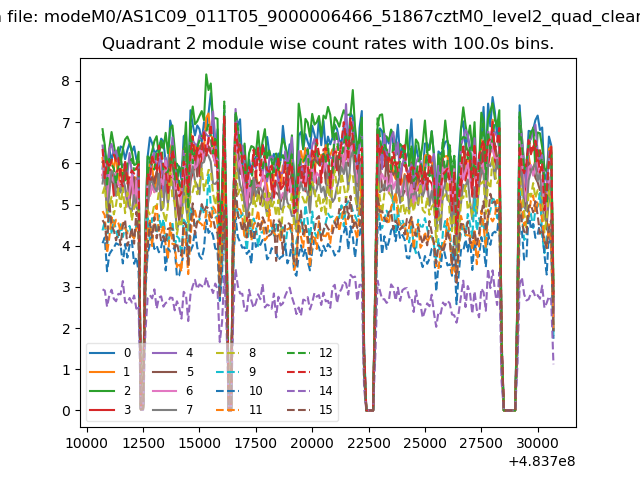
| Module-wise count rates for Quadrant B Data is divided into 100 sec bins |
 |
 |
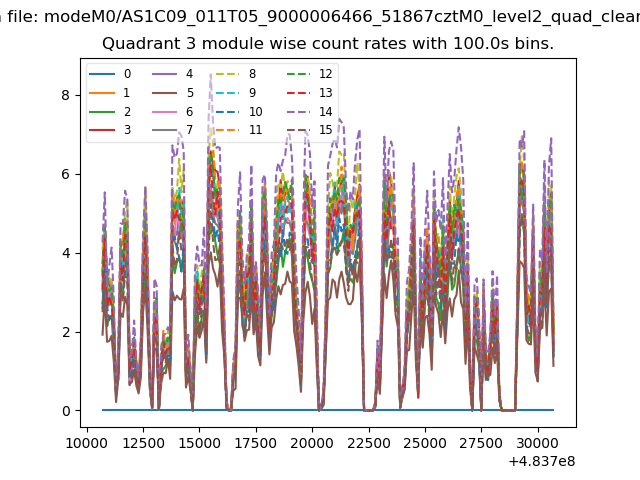
| Module-wise count rates for Quadrant C Data is divided into 100 sec bins |
 |
 |
| Module-wise count rates for Quadrant D Data is divided into 100 sec bins |
 |
 |
| Parameter | Plot |
|---|---|
| CZT HV Monitor | 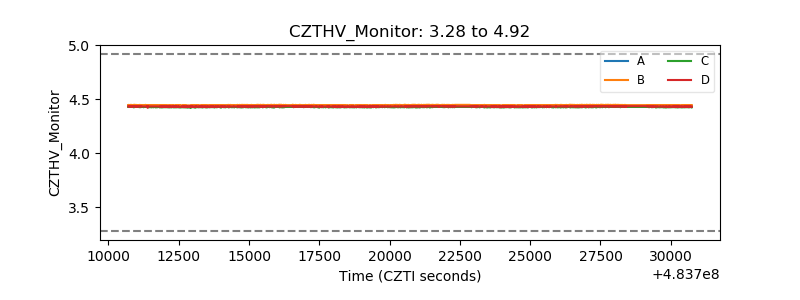 |
| D_VDD | 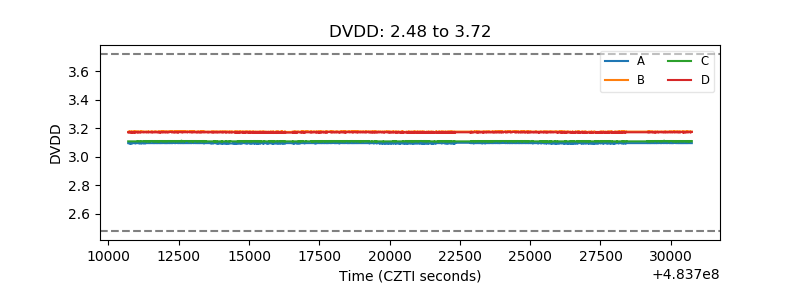 |
| Temperature 1 | 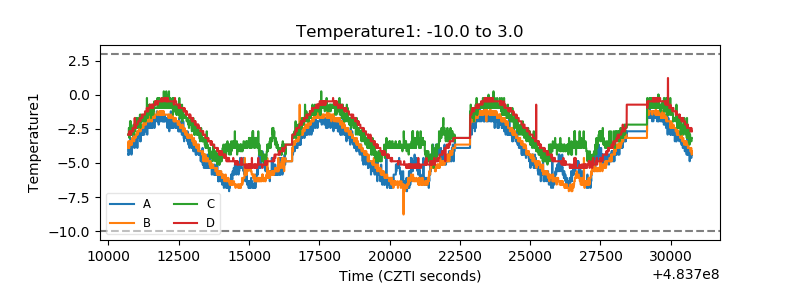 |
| Veto HV Monitor | 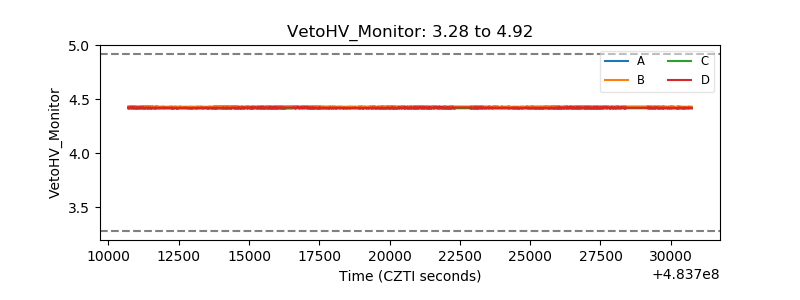 |
| Veto LLD | 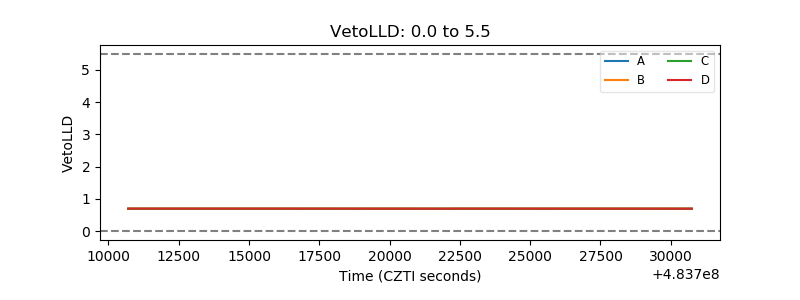 |
| Alpha Counter | 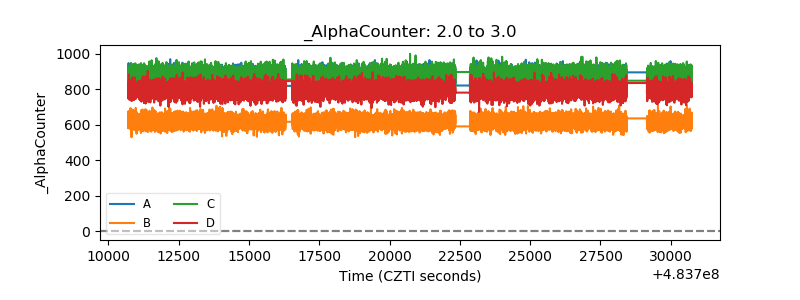 |
| _CPM_Rate | 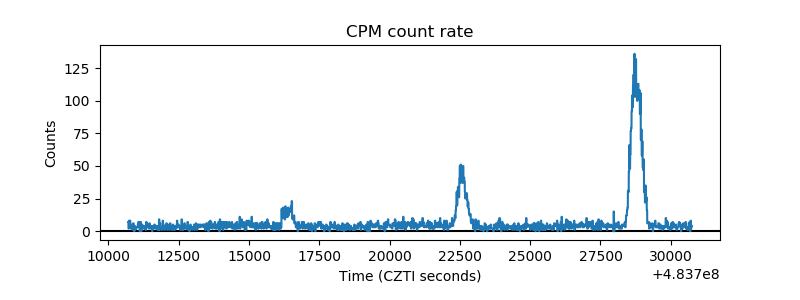 |
| CZT Counter | 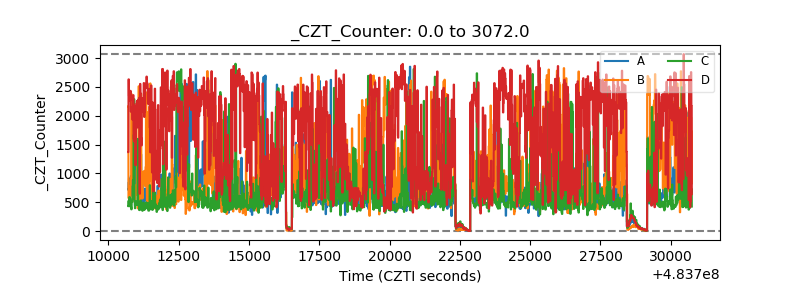 |
| +2.5 Volts monitor | 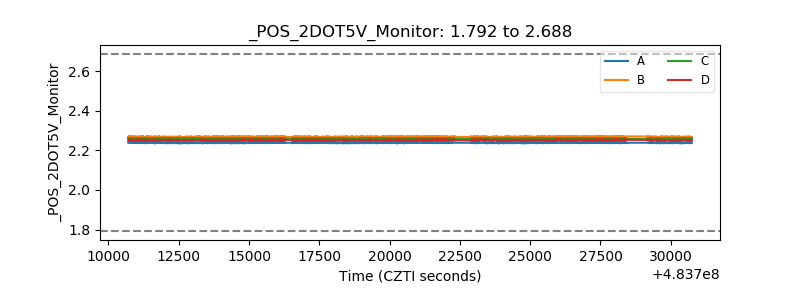 |
| +5 Volts monitor |  |
| _ROLL_ROT | 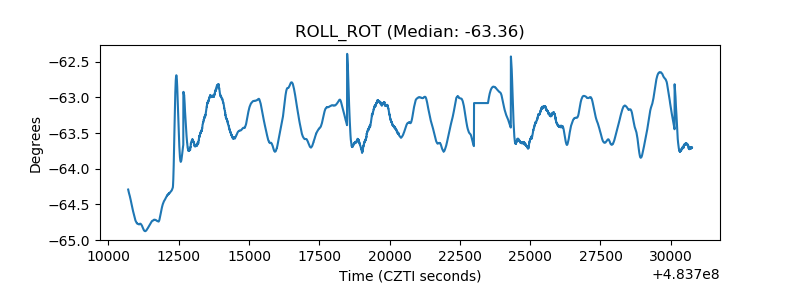 |
| _Roll_DEC | 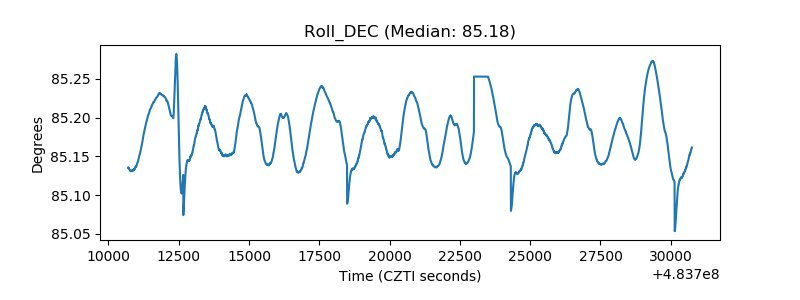 |
| _Roll_RA | 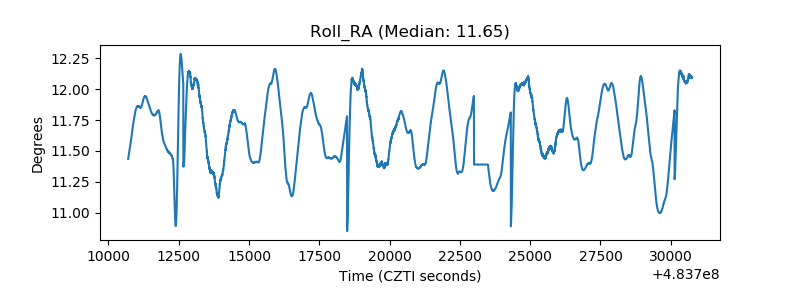 |
| Veto Counter | 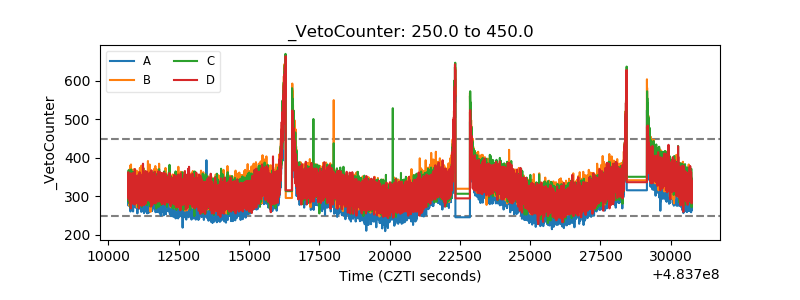 |