| Param | Original file | Final file |
|---|---|---|
| Filename | modeM0/AS1C09_011T05_9000006466_51868cztM0_level2.fits | modeM0/AS1C09_011T05_9000006466_51868cztM0_level2_quad_clean.evt |
| Size (bytes) | 708,520,320 | 81,460,800 |
| Size | 675.7 MB | 77.7 MB |
| Events in quadrant A | 4,927,304 | 584,796 |
| Events in quadrant B | 7,025,050 | 537,746 |
| Events in quadrant C | 3,629,135 | 571,936 |
| Events in quadrant D | 10,149,915 | 324,775 |
| Mode SS | |||
|---|---|---|---|
| Quadrant | BADHDUFLAG | Total packets | Discarded packets |
| A | 0 | 132 | 0 |
| B | 0 | 132 | 0 |
| C | 0 | 132 | 0 |
| D | 0 | 132 | 0 |
| Mode M0 | |||
|---|---|---|---|
| Quadrant | BADHDUFLAG | Total packets | Discarded packets |
| A | 0 | 19193 | 2 |
| B | 0 | 25299 | 1 |
| C | 0 | 15408 | 1 |
| D | 0 | 34629 | 1 |
| Mode M9 | |||
|---|---|---|---|
| Quadrant | BADHDUFLAG | Total packets | Discarded packets |
| A | 0 | 8 | 0 |
| B | 0 | 8 | 0 |
| C | 0 | 8 | 0 |
| D | 0 | 8 | 0 |
| Quadrant | Total seconds | Saturated seconds | Saturation percentage |
|---|---|---|---|
| A | 6398 | 199 | 3.110347% |
| B | 6398 | 1341 | 20.959675% |
| C | 6398 | 133 | 2.078775% |
| D | 6399 | 2832 | 44.256915% |
Noise dominated data is calculated using 1-second bins in cleaned event files. If a bin has >2000 counts, and if more than 50% of those come from <1% of pixels, then it is considered to be noise-dominated and hence unusable.
| Quadrant | # 1 sec bins | Bins with >0 counts | Bins with >2000 counts | High rate bins dominated by noise | Noise dominated (total time) | Noise dominated (detector-on time) | Marked lightcurve |
|---|---|---|---|---|---|---|---|
| A | 7253 | 6399 | 137 | 137 | 1.89% | 2.14% | 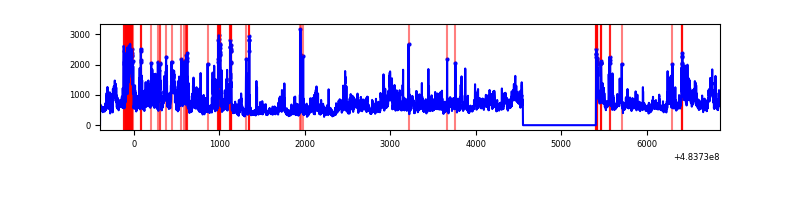 |
| B | 7253 | 6399 | 1139 | 1139 | 15.70% | 17.80% | 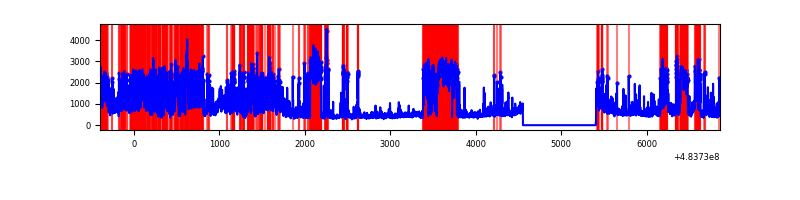 |
| C | 7253 | 6399 | 86 | 86 | 1.19% | 1.34% | 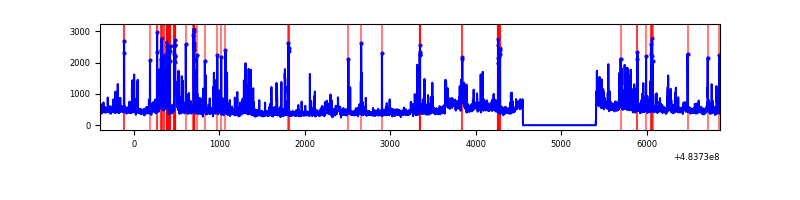 |
| D | 7254 | 6400 | 2586 | 2586 | 35.65% | 40.41% |  |
Top three noisy pixels from each quadrant. If the there are fewer than three noisy pixels in the level2.evt file, extra rows are filled as -1
| Pixel properties | Quadrant properties | ||||||
|---|---|---|---|---|---|---|---|
| Quadrant | DetID | PixID | Counts | Sigma | Mean | Median | Sigma |
| A | 12 | 3 | 1010536 | 6054.5 | 665 | 649 | 166.8 |
| A | 5 | 243 | 168710 | 1007.56 | 665 | 649 | 166.8 |
| A | 4 | 3 | 149522 | 892.53 | 665 | 649 | 166.8 |
| B | 4 | 170 | 3188465 | 24324.33 | 616 | 593 | 131.1 |
| B | 12 | 32 | 569560 | 4341.37 | 616 | 593 | 131.1 |
| B | 7 | 252 | 140133 | 1064.73 | 616 | 593 | 131.1 |
| C | 13 | 3 | 194119 | 1082.81 | 657 | 654 | 178.7 |
| C | 15 | 220 | 109650 | 610.04 | 657 | 654 | 178.7 |
| C | 15 | 219 | 100173 | 557.0 | 657 | 654 | 178.7 |
| D | 11 | 129 | 6420933 | 46000.91 | 495 | 476 | 139.6 |
| D | 6 | 42 | 645472 | 4621.23 | 495 | 476 | 139.6 |
| D | 8 | 176 | 528264 | 3781.46 | 495 | 476 | 139.6 |
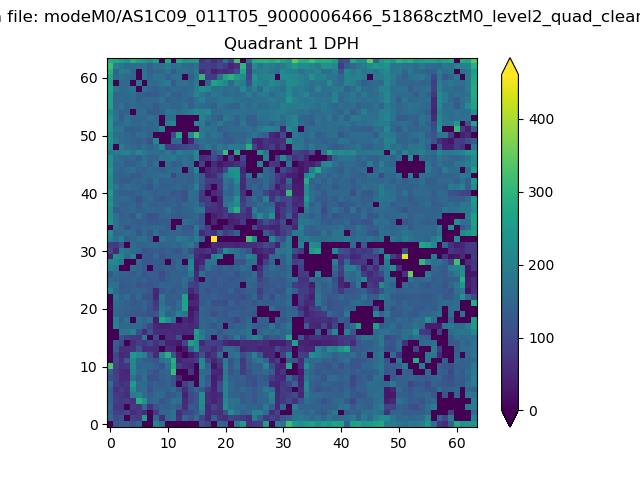
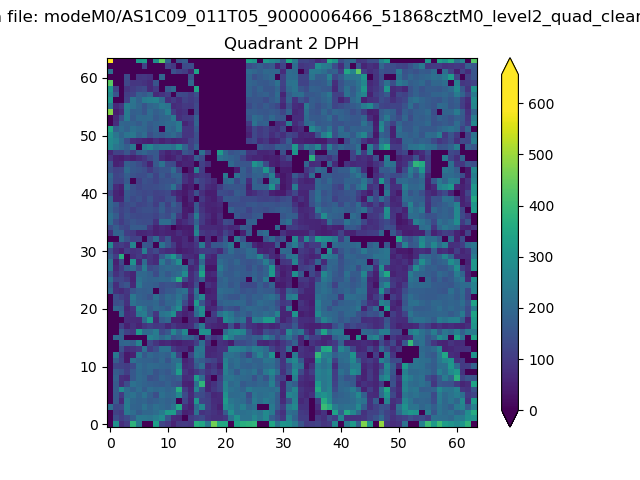
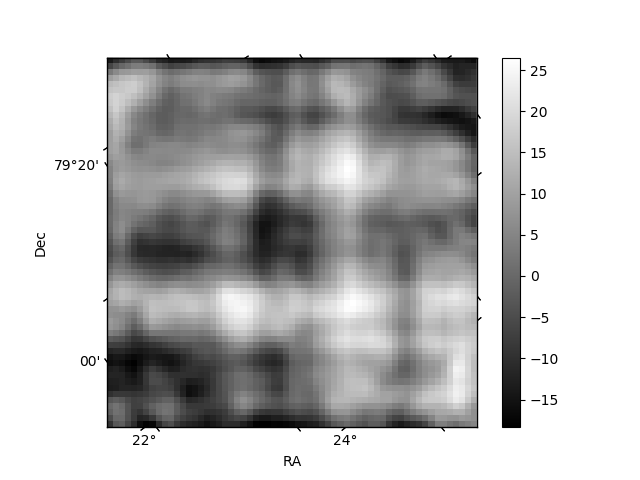
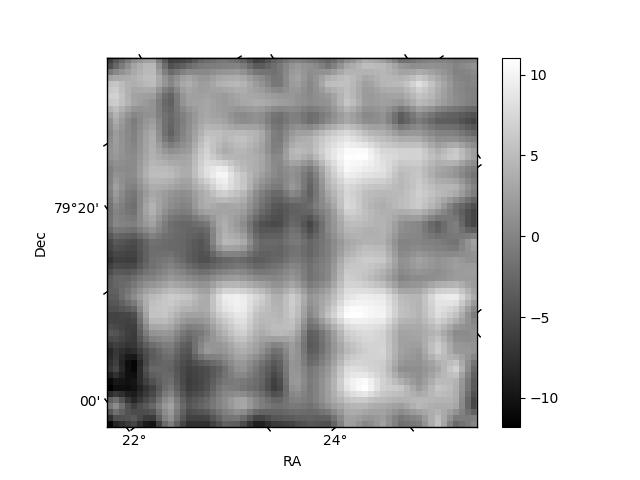
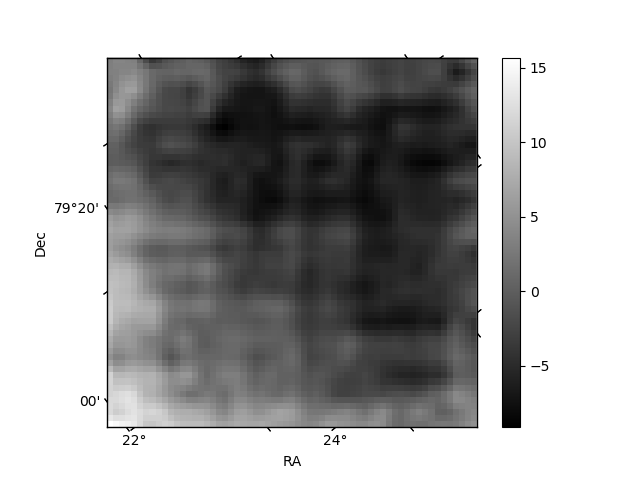
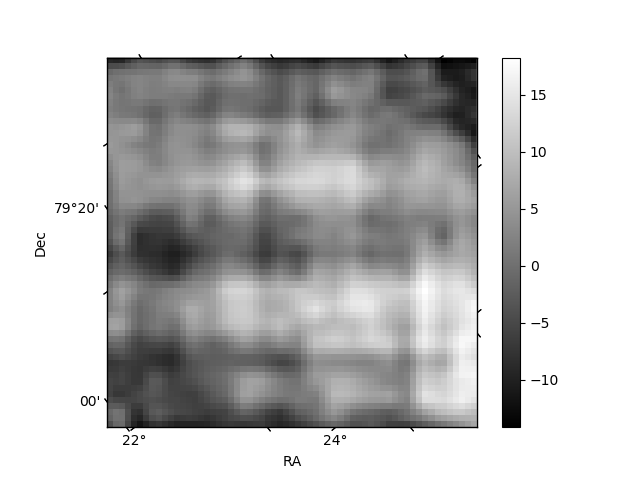
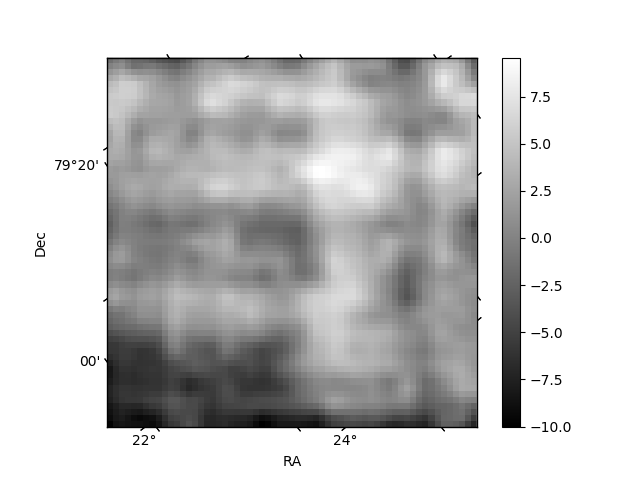
Histogram calculated using DETX and DETY for each event in the final _common_clean file
| Quadrant A | 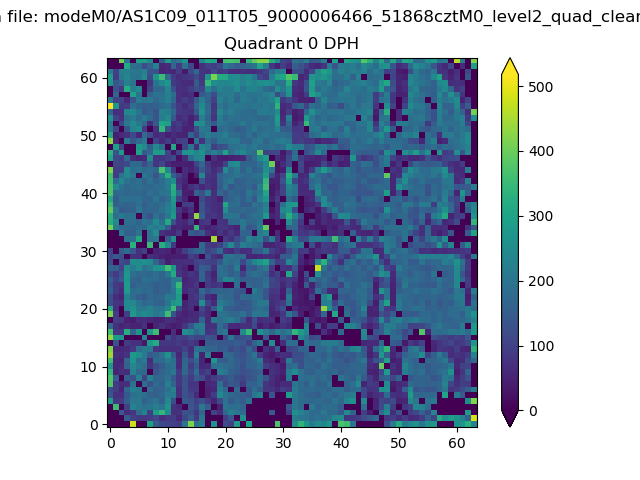 |
 |
Quadrant B |
|---|---|---|---|
| Quadrant D | 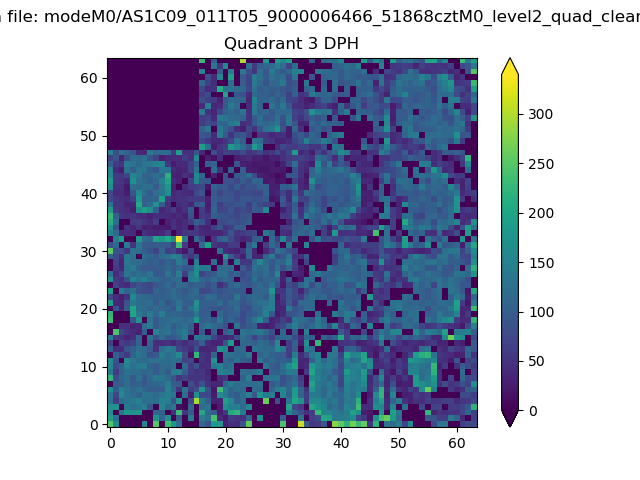 |
 |
Quadrant C |
| Plot type | Count rate plots | Images |
|---|---|---|
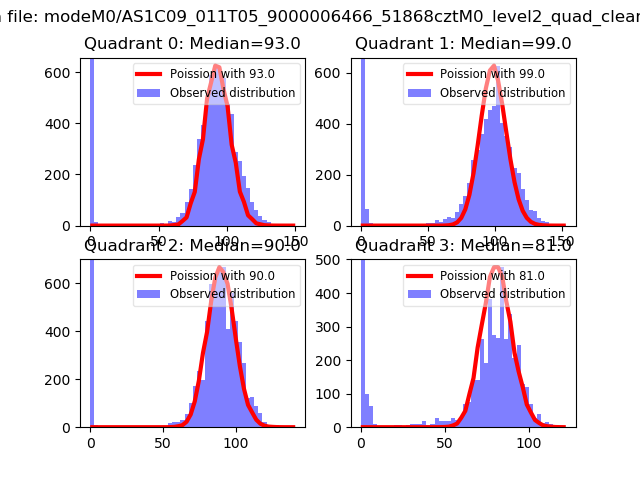
| Comparison with Poisson distribution Blue bars denote a histogram of data divided into 1 sec bins. Red curve is a Poisson curve with rate = median count rate of data. |
 |
 |
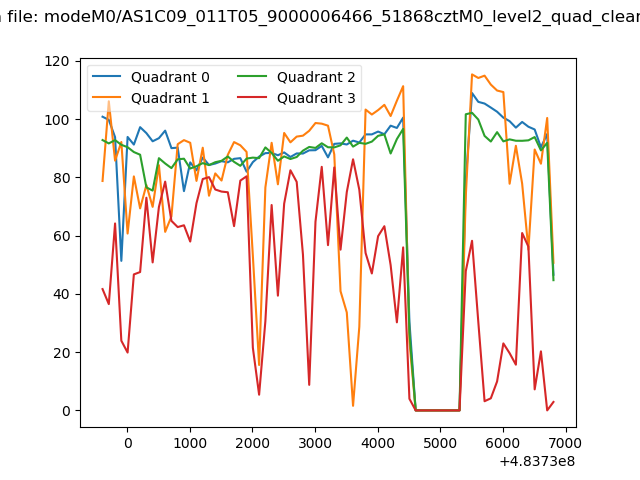
| Quadrant-wise count rates Data is divided into 100 sec bins |
 |
|
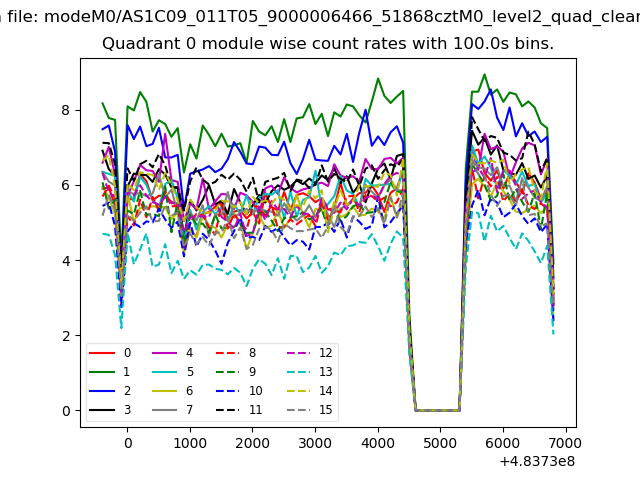
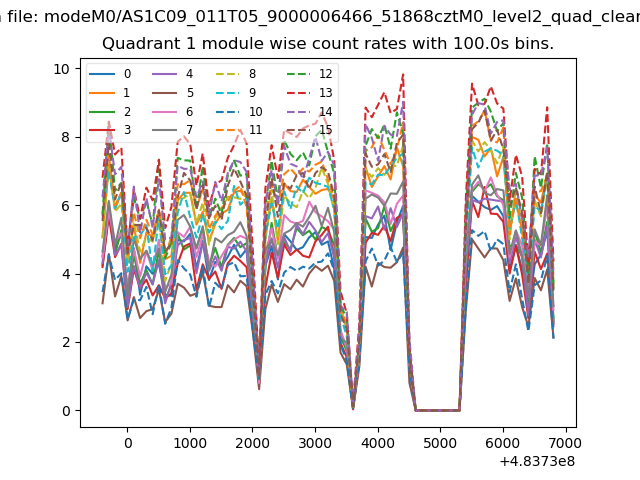
| Module-wise count rates for Quadrant A Data is divided into 100 sec bins |
 |
 |
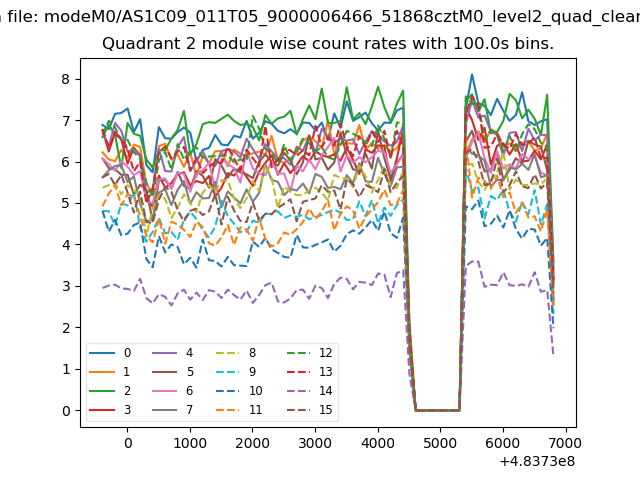
| Module-wise count rates for Quadrant B Data is divided into 100 sec bins |
 |
 |
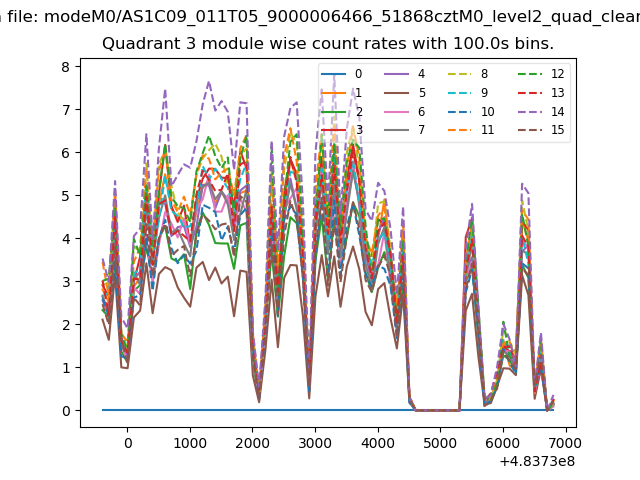
| Module-wise count rates for Quadrant C Data is divided into 100 sec bins |
 |
 |
| Module-wise count rates for Quadrant D Data is divided into 100 sec bins |
 |
 |
| Parameter | Plot |
|---|---|
| CZT HV Monitor | 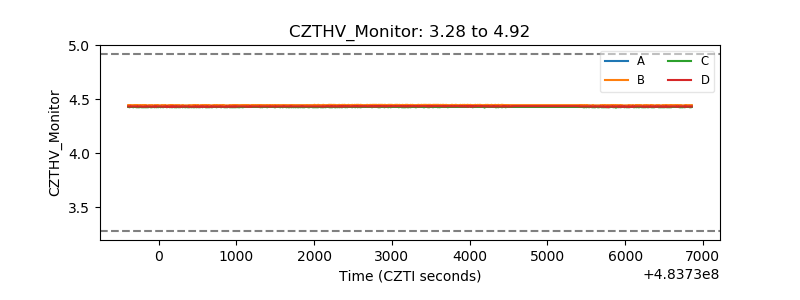 |
| D_VDD | 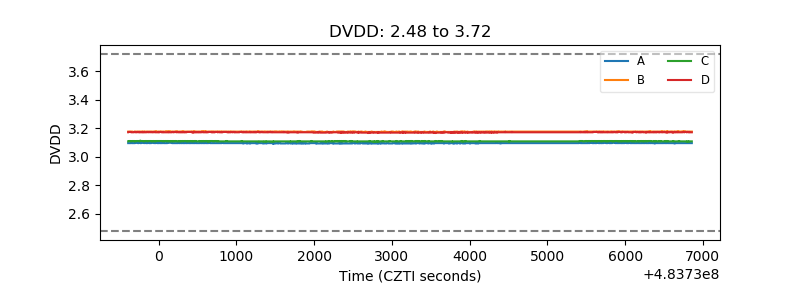 |
| Temperature 1 | 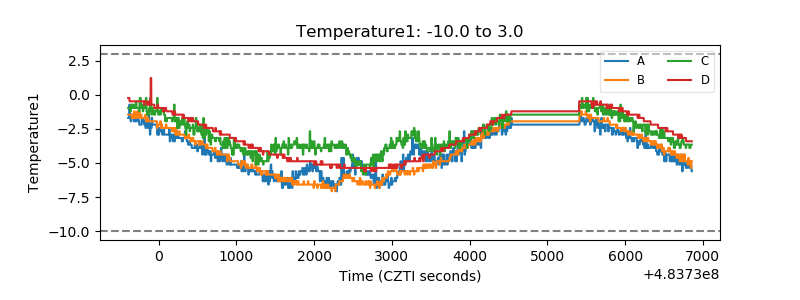 |
| Veto HV Monitor | 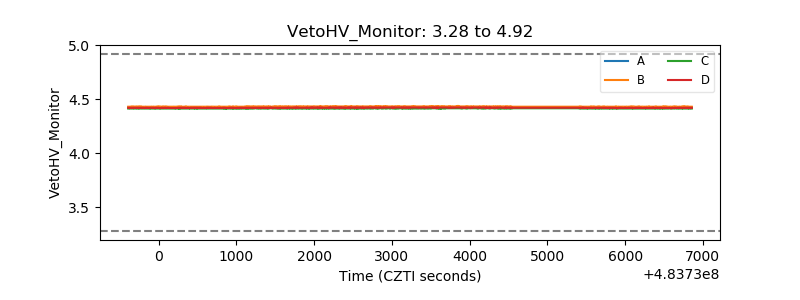 |
| Veto LLD | 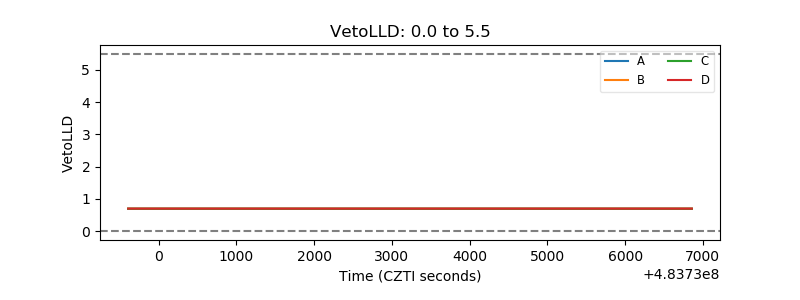 |
| Alpha Counter | 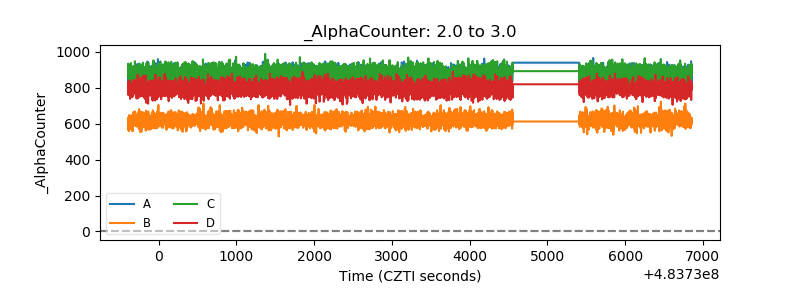 |
| _CPM_Rate | 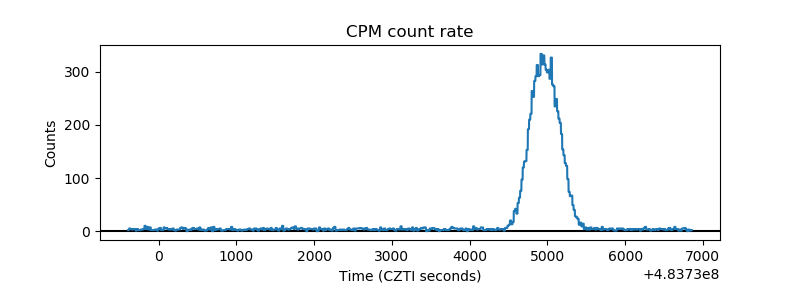 |
| CZT Counter | 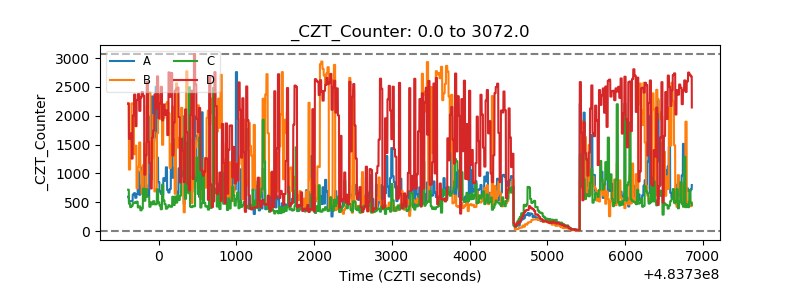 |
| +2.5 Volts monitor |  |
| +5 Volts monitor |  |
| _ROLL_ROT | 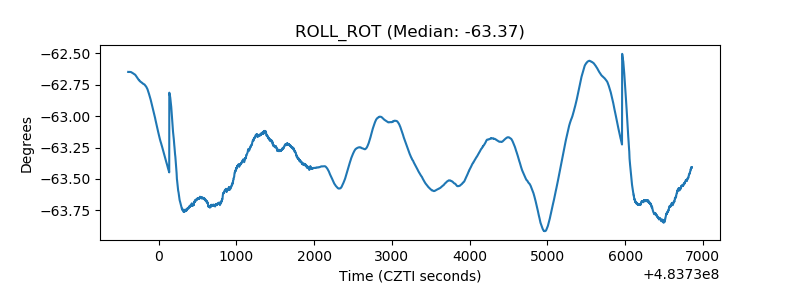 |
| _Roll_DEC | 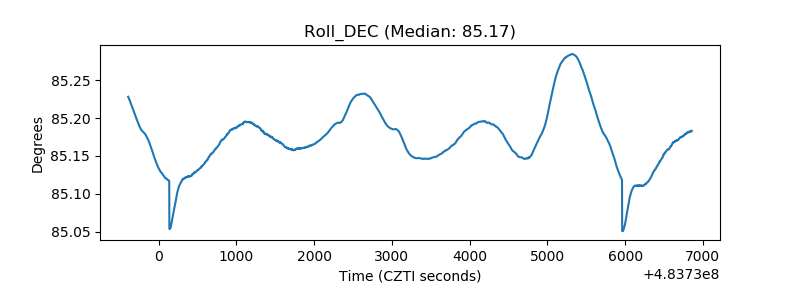 |
| _Roll_RA | 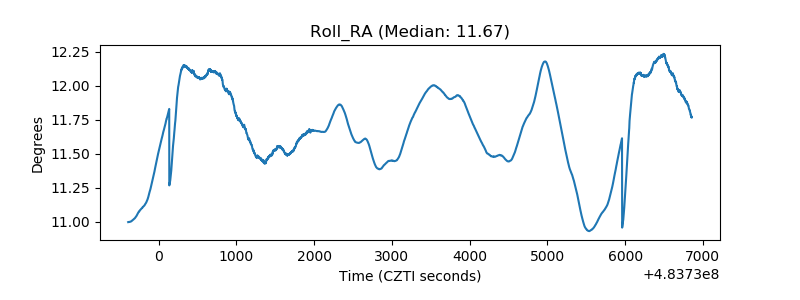 |
| Veto Counter | 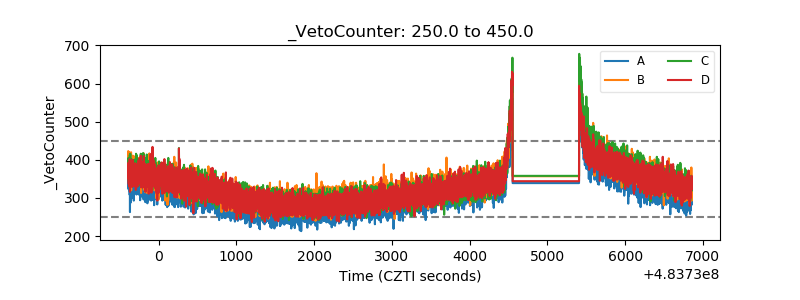 |