| Param | Original file | Final file |
|---|---|---|
| Filename | modeM0/AS1C09_011T05_9000006466_51870cztM0_level2.fits | modeM0/AS1C09_011T05_9000006466_51870cztM0_level2_quad_clean.evt |
| Size (bytes) | 803,894,400 | 81,273,600 |
| Size | 766.7 MB | 77.5 MB |
| Events in quadrant A | 5,493,615 | 611,304 |
| Events in quadrant B | 6,319,861 | 586,607 |
| Events in quadrant C | 3,893,130 | 605,217 |
| Events in quadrant D | 13,539,931 | 196,935 |
| Mode SS | |||
|---|---|---|---|
| Quadrant | BADHDUFLAG | Total packets | Discarded packets |
| A | 0 | 136 | 0 |
| B | 0 | 136 | 0 |
| C | 0 | 136 | 0 |
| D | 0 | 136 | 0 |
| Mode M0 | |||
|---|---|---|---|
| Quadrant | BADHDUFLAG | Total packets | Discarded packets |
| A | 0 | 21014 | 2 |
| B | 0 | 23382 | 2 |
| C | 0 | 16205 | 2 |
| D | 0 | 44752 | 8 |
| Mode M9 | |||
|---|---|---|---|
| Quadrant | BADHDUFLAG | Total packets | Discarded packets |
| A | 0 | 12 | 0 |
| B | 0 | 13 | 0 |
| C | 0 | 13 | 0 |
| D | 0 | 13 | 0 |
| Quadrant | Total seconds | Saturated seconds | Saturation percentage |
|---|---|---|---|
| A | 6596 | 161 | 2.440873% |
| B | 6596 | 1065 | 16.146149% |
| C | 6596 | 122 | 1.849606% |
| D | 6595 | 4604 | 69.810462% |
Noise dominated data is calculated using 1-second bins in cleaned event files. If a bin has >2000 counts, and if more than 50% of those come from <1% of pixels, then it is considered to be noise-dominated and hence unusable.
| Quadrant | # 1 sec bins | Bins with >0 counts | Bins with >2000 counts | High rate bins dominated by noise | Noise dominated (total time) | Noise dominated (detector-on time) | Marked lightcurve |
|---|---|---|---|---|---|---|---|
| A | 7636 | 6597 | 119 | 119 | 1.56% | 1.80% | 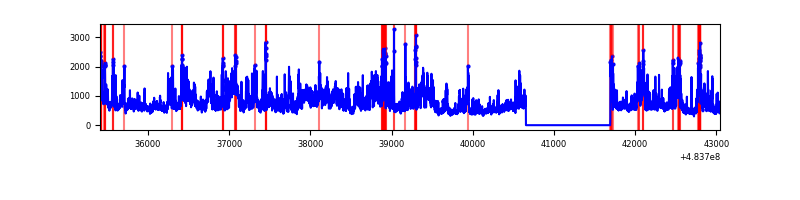 |
| B | 7636 | 6597 | 915 | 915 | 11.98% | 13.87% | 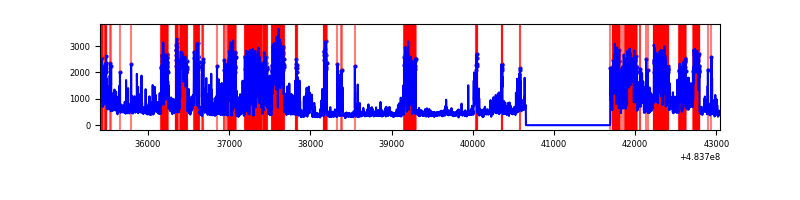 |
| C | 7636 | 6597 | 88 | 88 | 1.15% | 1.33% | 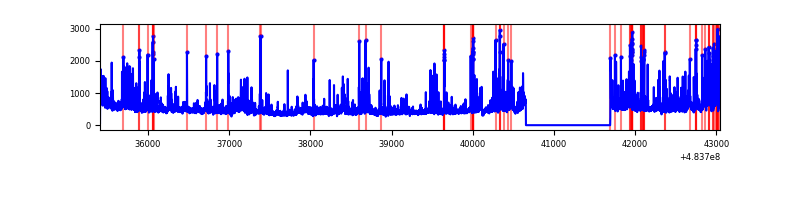 |
| D | 7635 | 6596 | 4156 | 4156 | 54.43% | 63.01% | 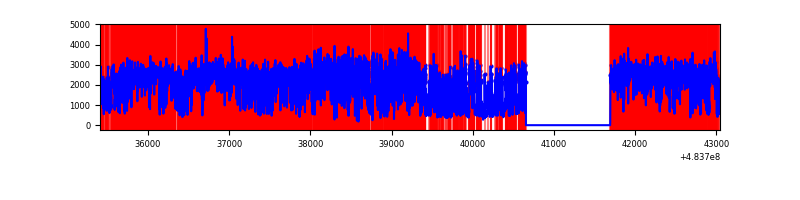 |
Top three noisy pixels from each quadrant. If the there are fewer than three noisy pixels in the level2.evt file, extra rows are filled as -1
| Pixel properties | Quadrant properties | ||||||
|---|---|---|---|---|---|---|---|
| Quadrant | DetID | PixID | Counts | Sigma | Mean | Median | Sigma |
| A | 12 | 3 | 1375442 | 7958.48 | 691 | 674 | 172.7 |
| A | 4 | 175 | 351345 | 2030.02 | 691 | 674 | 172.7 |
| A | 4 | 3 | 185690 | 1071.05 | 691 | 674 | 172.7 |
| B | 4 | 170 | 2215834 | 15775.62 | 654 | 630 | 140.4 |
| B | 5 | 172 | 439649 | 3126.48 | 654 | 630 | 140.4 |
| B | 12 | 32 | 283073 | 2011.42 | 654 | 630 | 140.4 |
| C | 14 | 245 | 168680 | 885.54 | 685 | 679 | 189.7 |
| C | 14 | 80 | 128277 | 672.57 | 685 | 679 | 189.7 |
| C | 13 | 3 | 120851 | 633.43 | 685 | 679 | 189.7 |
| D | 11 | 129 | 10642685 | 94811.65 | 396 | 381 | 112.2 |
| D | 6 | 42 | 393606 | 3503.22 | 396 | 381 | 112.2 |
| D | 8 | 176 | 332451 | 2958.39 | 396 | 381 | 112.2 |
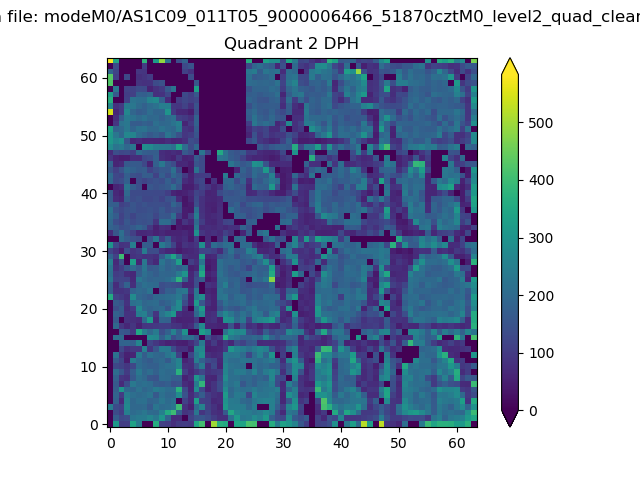
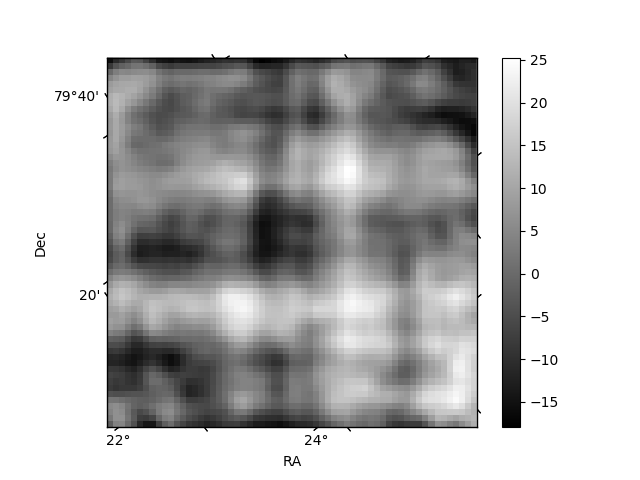
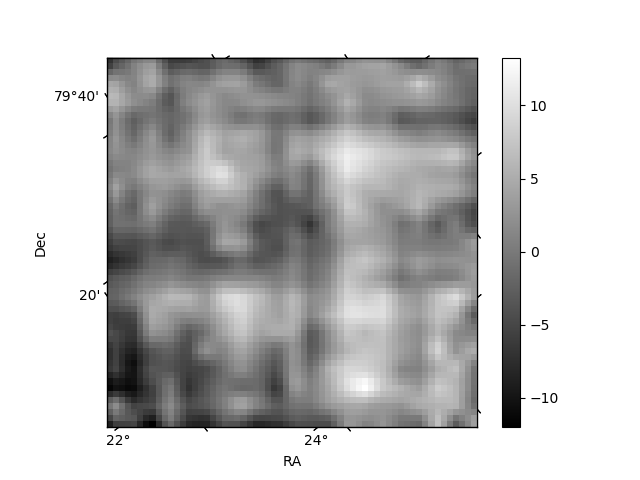
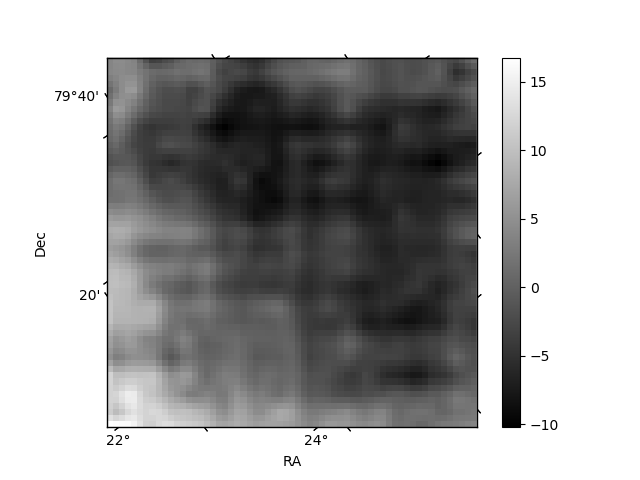
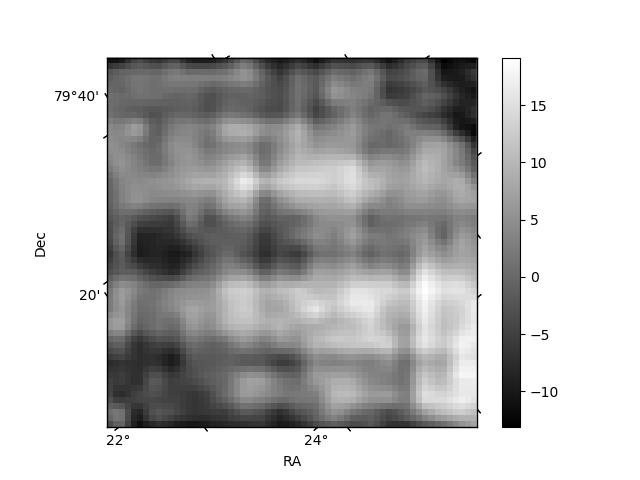
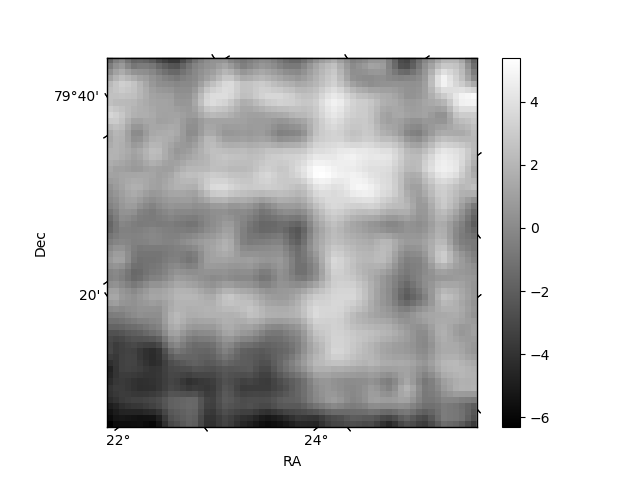
Histogram calculated using DETX and DETY for each event in the final _common_clean file
| Quadrant A | 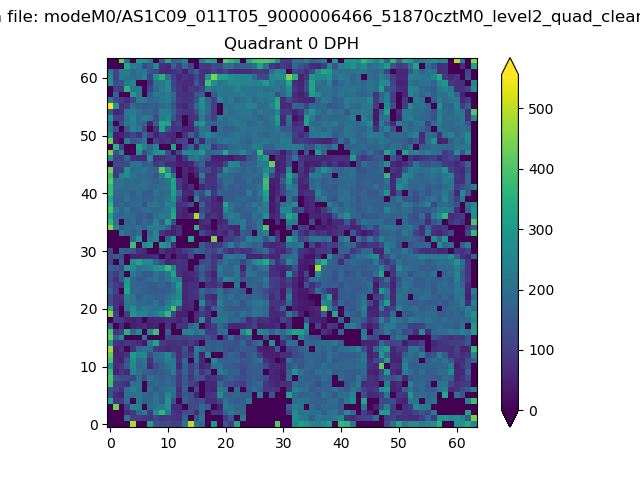 |
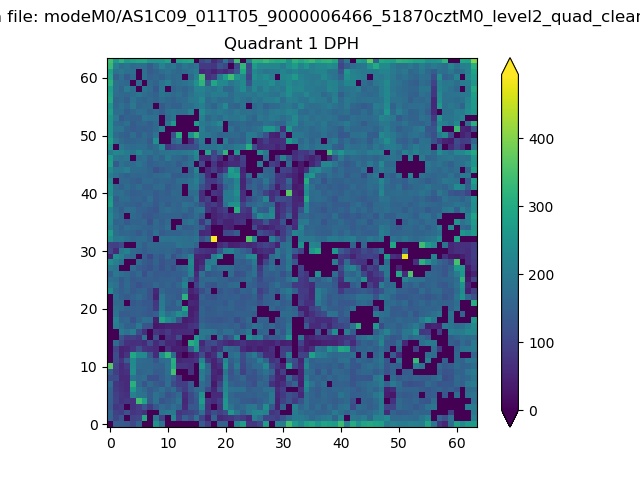 |
Quadrant B |
|---|---|---|---|
| Quadrant D | 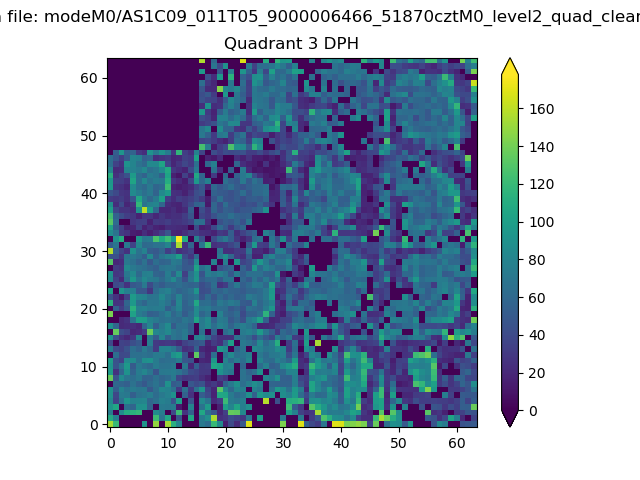 |
 |
Quadrant C |
| Plot type | Count rate plots | Images |
|---|---|---|
| Comparison with Poisson distribution Blue bars denote a histogram of data divided into 1 sec bins. Red curve is a Poisson curve with rate = median count rate of data. |
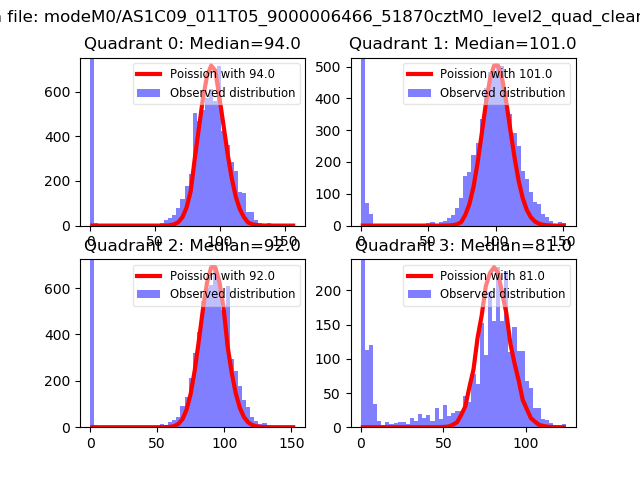 |
 |
| Quadrant-wise count rates Data is divided into 100 sec bins |
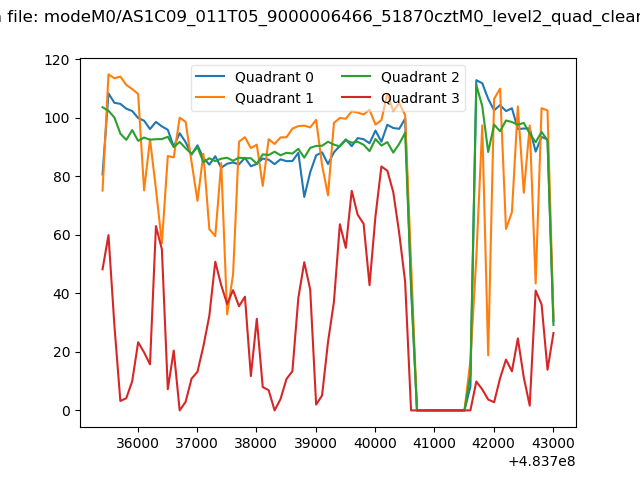 |
|
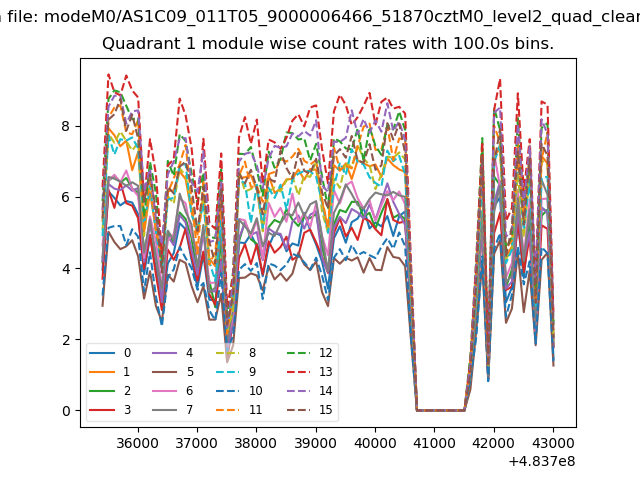
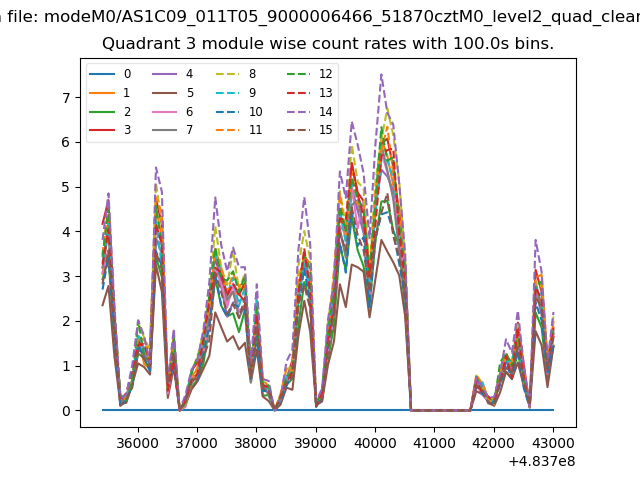
| Module-wise count rates for Quadrant A Data is divided into 100 sec bins |
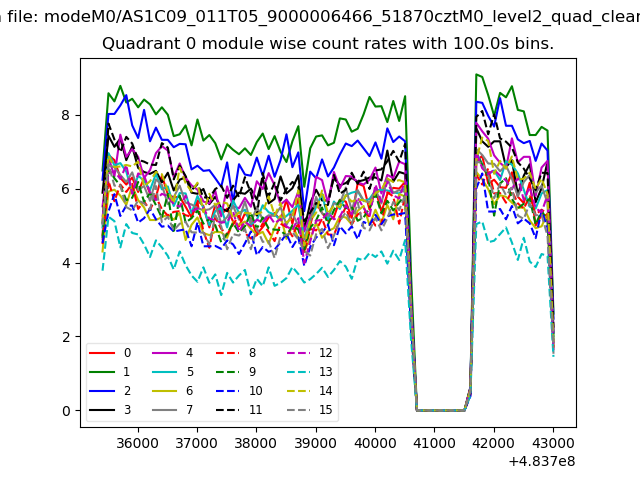 |
 |
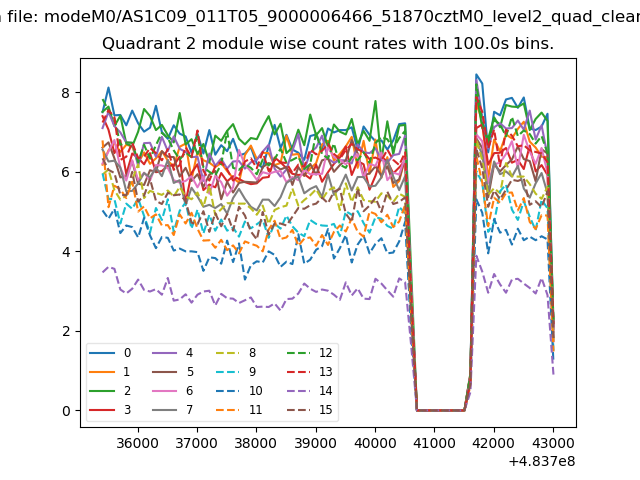
| Module-wise count rates for Quadrant B Data is divided into 100 sec bins |
 |
 |
| Module-wise count rates for Quadrant C Data is divided into 100 sec bins |
 |
 |
| Module-wise count rates for Quadrant D Data is divided into 100 sec bins |
 |
 |
| Parameter | Plot |
|---|---|
| CZT HV Monitor | 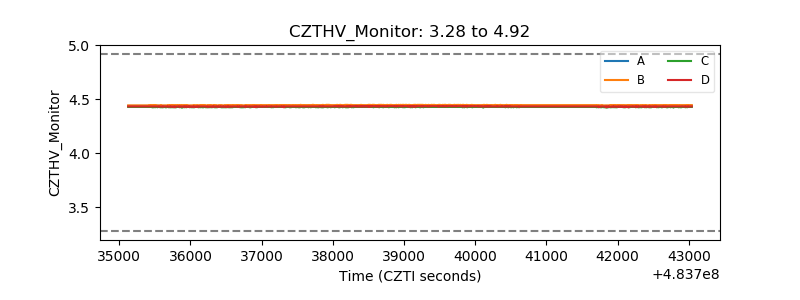 |
| D_VDD | 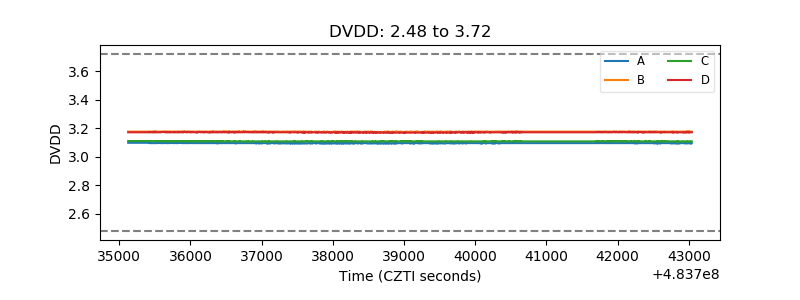 |
| Temperature 1 | 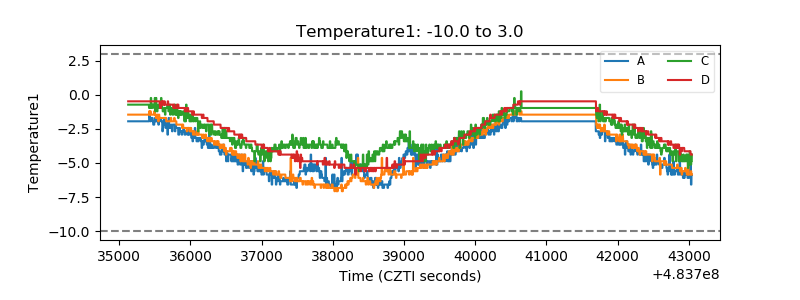 |
| Veto HV Monitor | 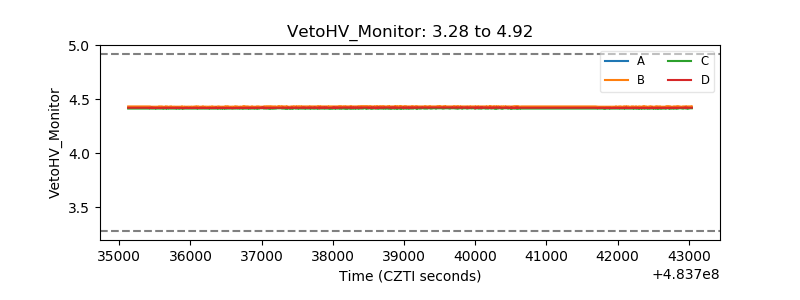 |
| Veto LLD |  |
| Alpha Counter | 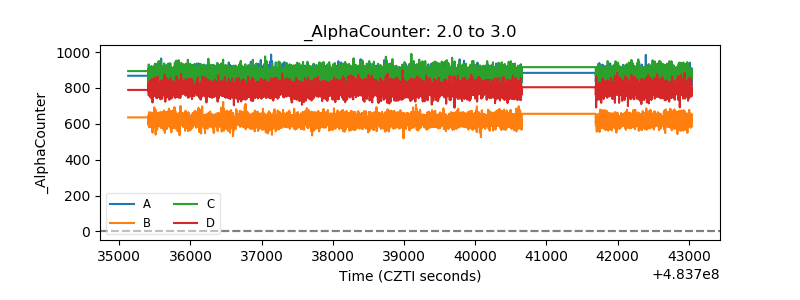 |
| _CPM_Rate | 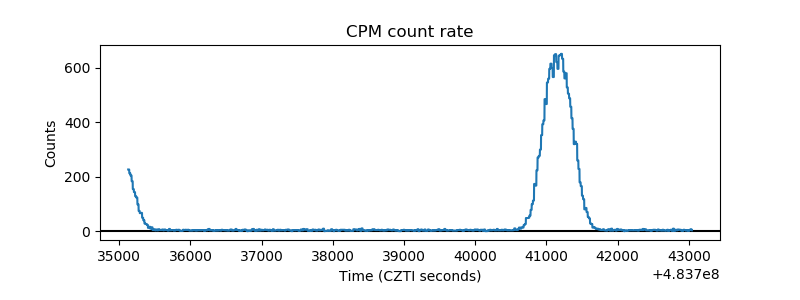 |
| CZT Counter | 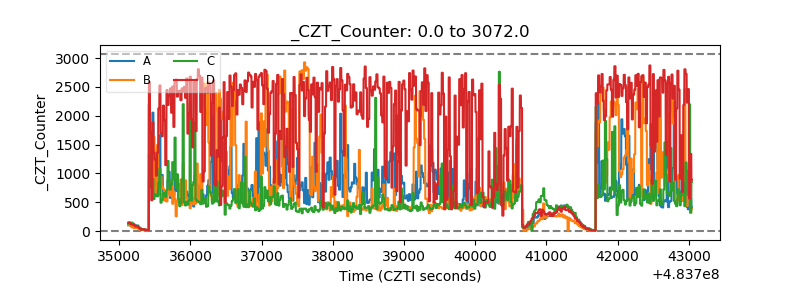 |
| +2.5 Volts monitor | 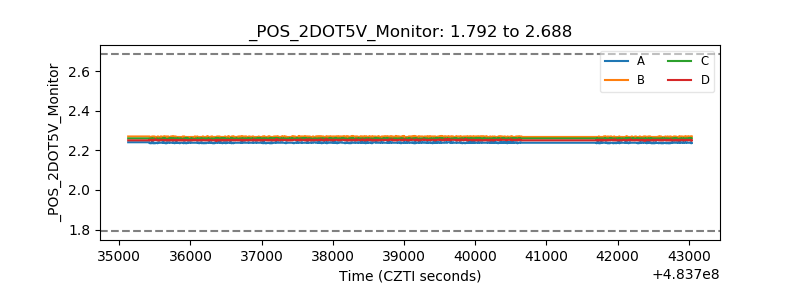 |
| +5 Volts monitor | 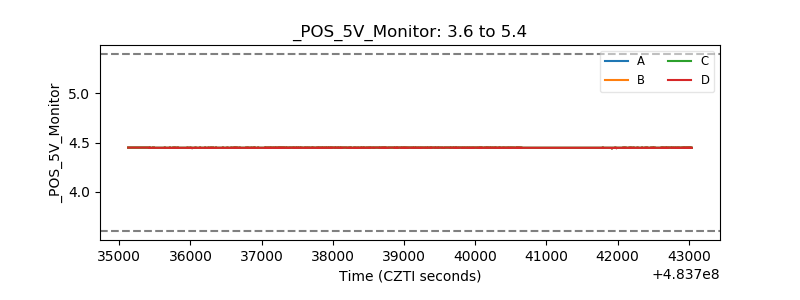 |
| _ROLL_ROT | 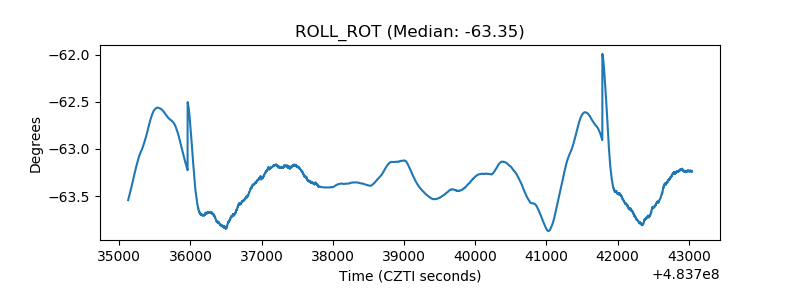 |
| _Roll_DEC | 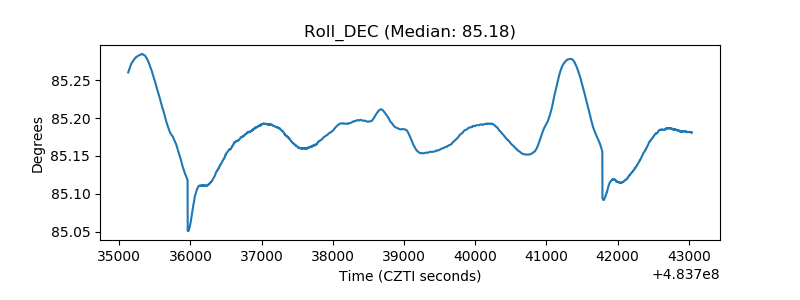 |
| _Roll_RA | 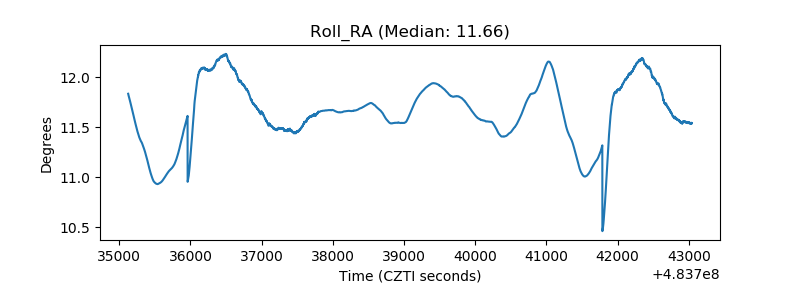 |
| Veto Counter | 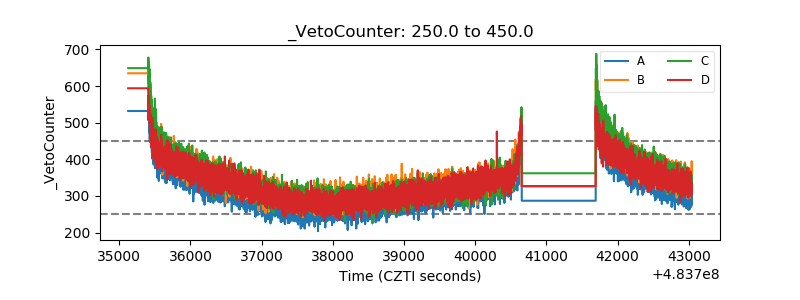 |