| Param | Original file | Final file |
|---|---|---|
| Filename | modeM0/AS1C09_011T05_9000006466_51871cztM0_level2.fits | modeM0/AS1C09_011T05_9000006466_51871cztM0_level2_quad_clean.evt |
| Size (bytes) | 741,041,280 | 81,455,040 |
| Size | 706.7 MB | 77.7 MB |
| Events in quadrant A | 4,859,500 | 603,107 |
| Events in quadrant B | 5,158,244 | 612,319 |
| Events in quadrant C | 4,478,310 | 583,312 |
| Events in quadrant D | 12,439,494 | 221,537 |
| Mode SS | |||
|---|---|---|---|
| Quadrant | BADHDUFLAG | Total packets | Discarded packets |
| A | 0 | 130 | 0 |
| B | 0 | 130 | 0 |
| C | 0 | 130 | 0 |
| D | 0 | 130 | 0 |
| Mode M0 | |||
|---|---|---|---|
| Quadrant | BADHDUFLAG | Total packets | Discarded packets |
| A | 0 | 19045 | 2 |
| B | 0 | 19830 | 2 |
| C | 0 | 17820 | 2 |
| D | 0 | 41421 | 6 |
| Mode M9 | |||
|---|---|---|---|
| Quadrant | BADHDUFLAG | Total packets | Discarded packets |
| A | 0 | 13 | 0 |
| B | 0 | 14 | 0 |
| C | 0 | 14 | 0 |
| D | 0 | 14 | 0 |
| Quadrant | Total seconds | Saturated seconds | Saturation percentage |
|---|---|---|---|
| A | 6388 | 171 | 2.676894% |
| B | 6388 | 673 | 10.535379% |
| C | 6388 | 331 | 5.181590% |
| D | 6387 | 4137 | 64.772194% |
Noise dominated data is calculated using 1-second bins in cleaned event files. If a bin has >2000 counts, and if more than 50% of those come from <1% of pixels, then it is considered to be noise-dominated and hence unusable.
| Quadrant | # 1 sec bins | Bins with >0 counts | Bins with >2000 counts | High rate bins dominated by noise | Noise dominated (total time) | Noise dominated (detector-on time) | Marked lightcurve |
|---|---|---|---|---|---|---|---|
| A | 7491 | 6392 | 125 | 125 | 1.67% | 1.96% | 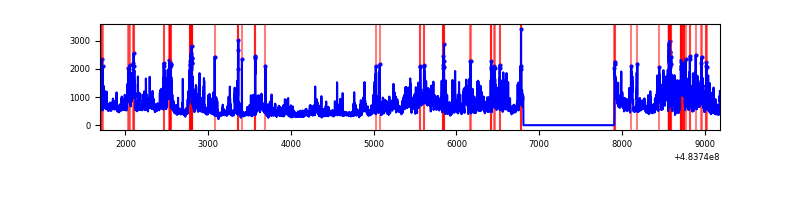 |
| B | 7491 | 6392 | 520 | 520 | 6.94% | 8.14% | 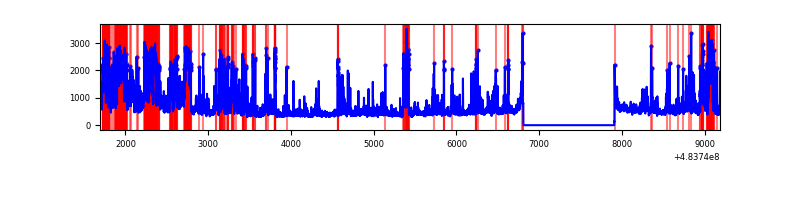 |
| C | 7491 | 6392 | 256 | 256 | 3.42% | 4.01% | 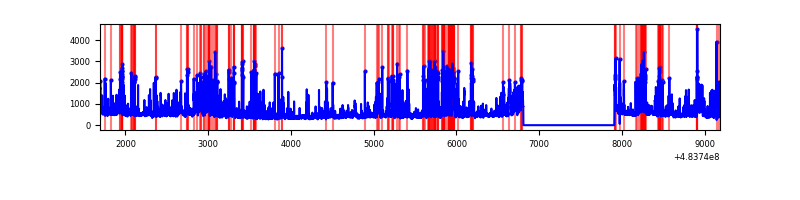 |
| D | 7490 | 6391 | 3538 | 3538 | 47.24% | 55.36% | 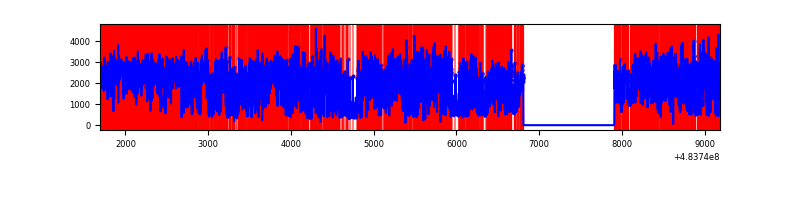 |
Top three noisy pixels from each quadrant. If the there are fewer than three noisy pixels in the level2.evt file, extra rows are filled as -1
| Pixel properties | Quadrant properties | ||||||
|---|---|---|---|---|---|---|---|
| Quadrant | DetID | PixID | Counts | Sigma | Mean | Median | Sigma |
| A | 12 | 3 | 1207572 | 7227.17 | 669 | 654 | 167.0 |
| A | 12 | 194 | 144624 | 862.11 | 669 | 654 | 167.0 |
| A | 4 | 3 | 116195 | 691.87 | 669 | 654 | 167.0 |
| B | 4 | 170 | 837100 | 6116.5 | 649 | 628 | 136.8 |
| B | 5 | 172 | 448055 | 3271.7 | 649 | 628 | 136.8 |
| B | 4 | 206 | 266470 | 1943.9 | 649 | 628 | 136.8 |
| C | 14 | 80 | 487842 | 2704.1 | 656 | 651 | 180.2 |
| C | 10 | 22 | 256178 | 1418.27 | 656 | 651 | 180.2 |
| C | 13 | 3 | 189658 | 1049.06 | 656 | 651 | 180.2 |
| D | 11 | 129 | 10261402 | 91694.44 | 399 | 386 | 111.9 |
| D | 2 | 249 | 204765 | 1826.37 | 399 | 386 | 111.9 |
| D | 8 | 176 | 69077 | 613.84 | 399 | 386 | 111.9 |
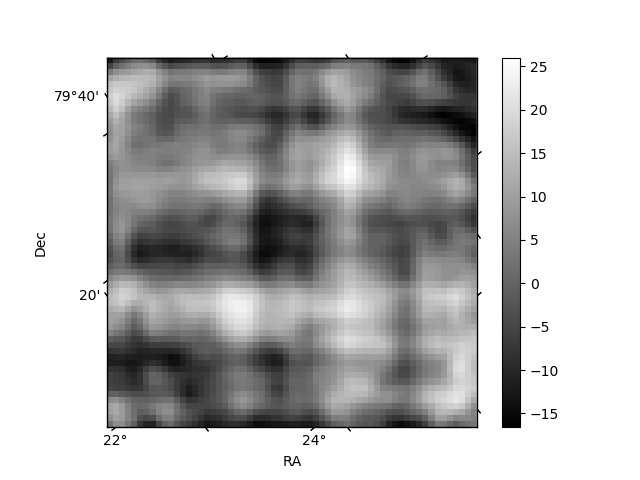
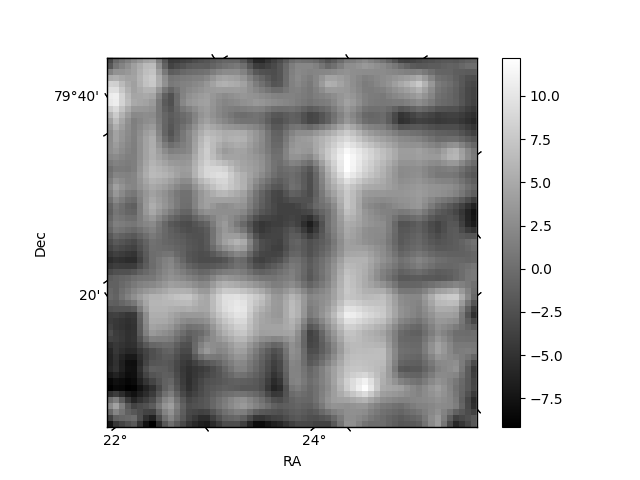
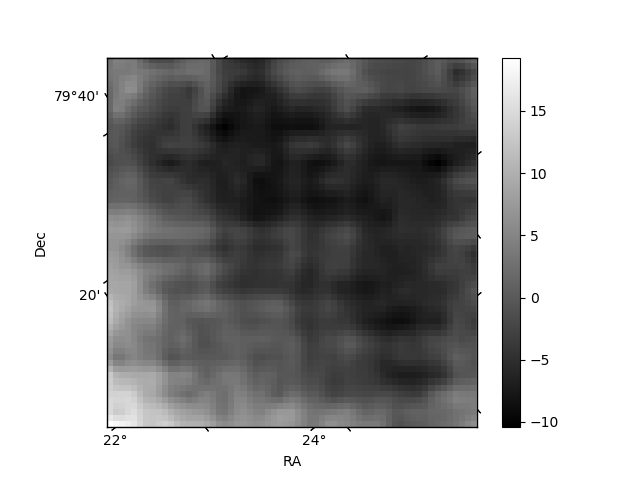
Histogram calculated using DETX and DETY for each event in the final _common_clean file
| Quadrant A | 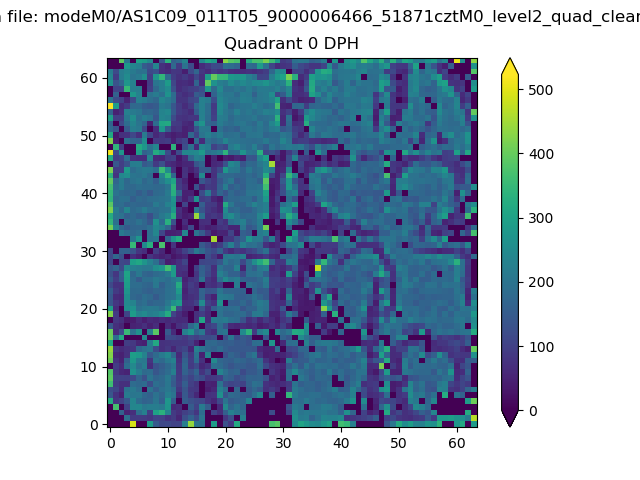 |
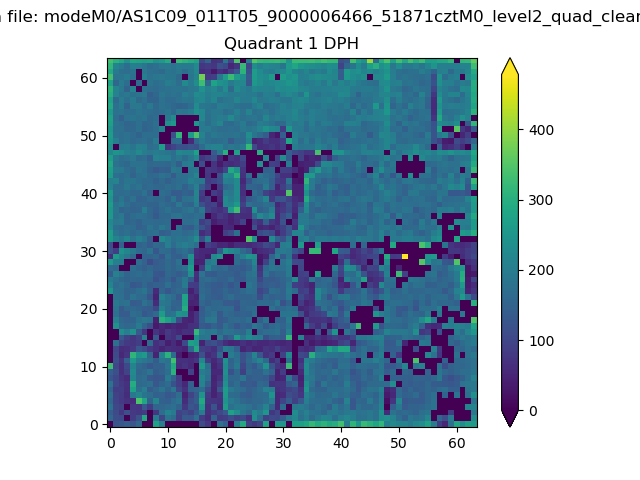 |
Quadrant B |
|---|---|---|---|
| Quadrant D | 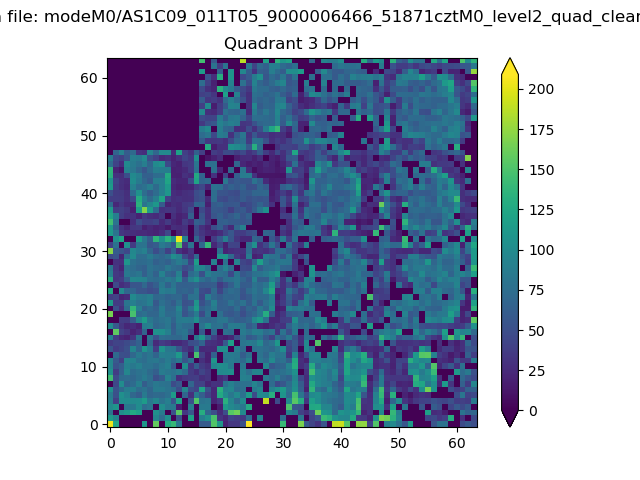 |
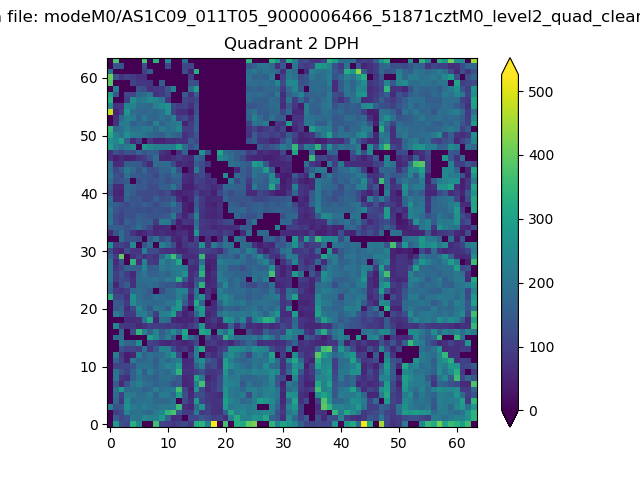 |
Quadrant C |
| Plot type | Count rate plots | Images |
|---|---|---|
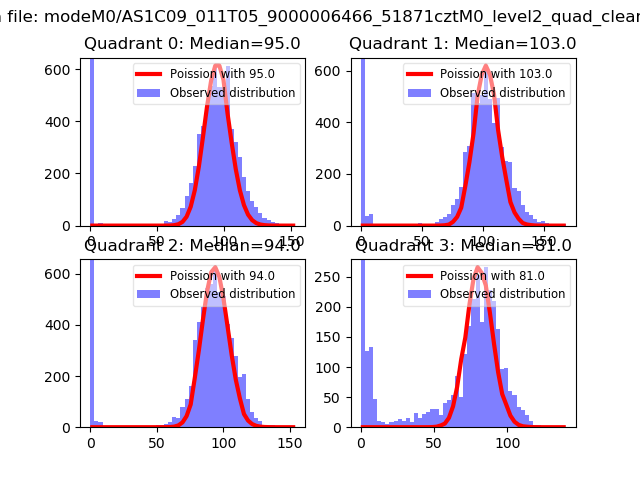
| Comparison with Poisson distribution Blue bars denote a histogram of data divided into 1 sec bins. Red curve is a Poisson curve with rate = median count rate of data. |
 |
 |
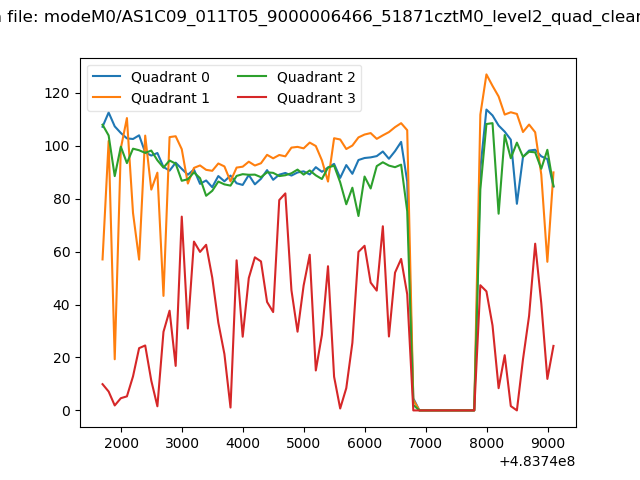
| Quadrant-wise count rates Data is divided into 100 sec bins |
 |
|
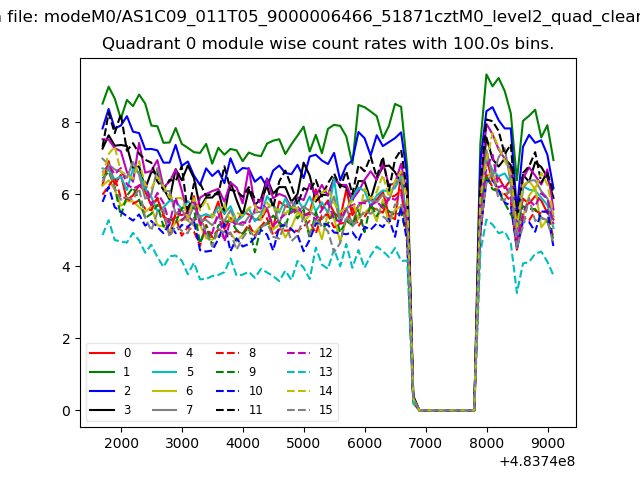
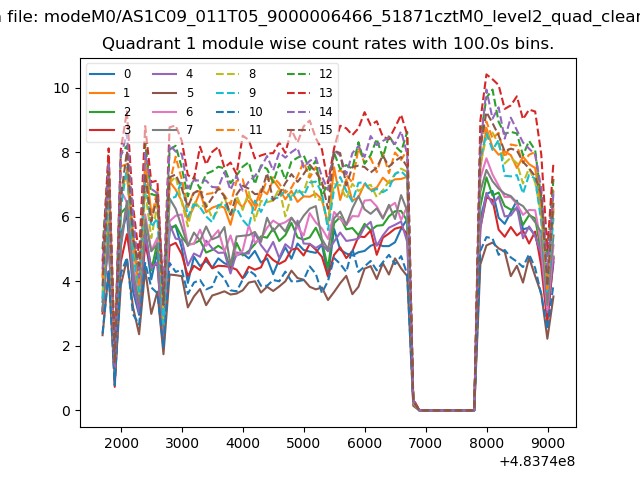
| Module-wise count rates for Quadrant A Data is divided into 100 sec bins |
 |
 |
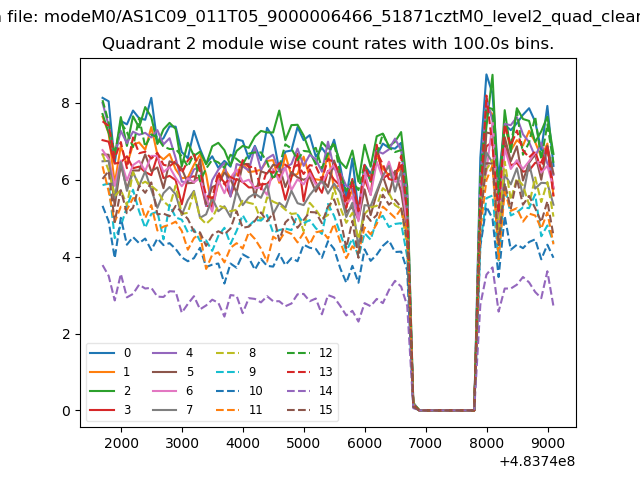
| Module-wise count rates for Quadrant B Data is divided into 100 sec bins |
 |
 |
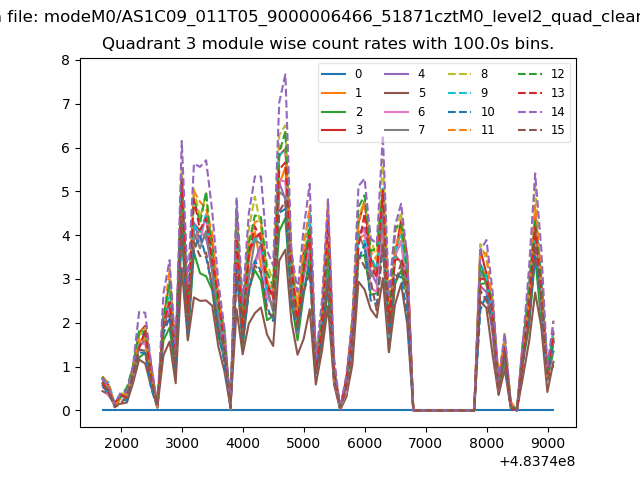
| Module-wise count rates for Quadrant C Data is divided into 100 sec bins |
 |
 |
| Module-wise count rates for Quadrant D Data is divided into 100 sec bins |
 |
 |
| Parameter | Plot |
|---|---|
| CZT HV Monitor |  |
| D_VDD | 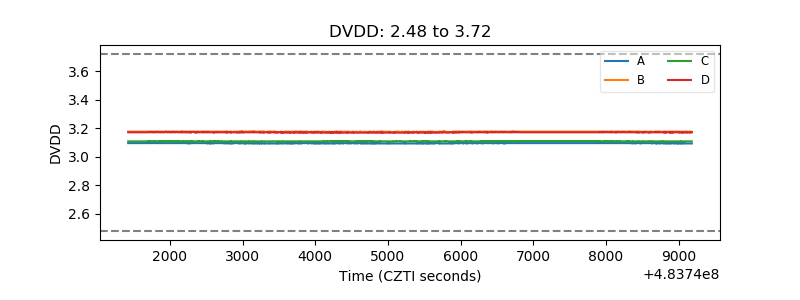 |
| Temperature 1 | 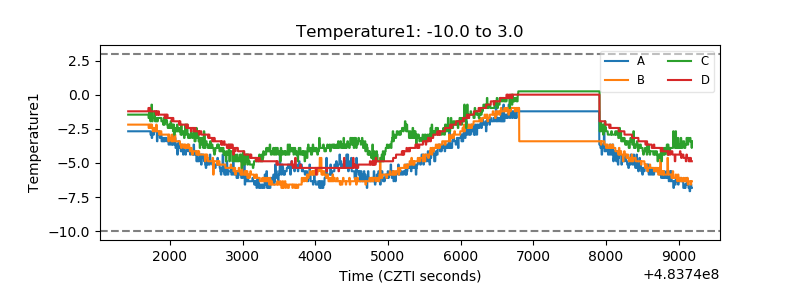 |
| Veto HV Monitor | 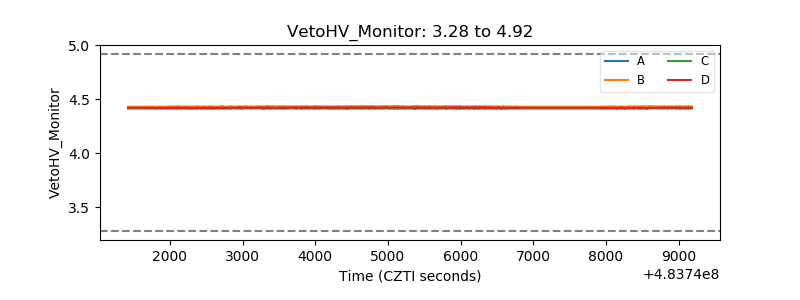 |
| Veto LLD | 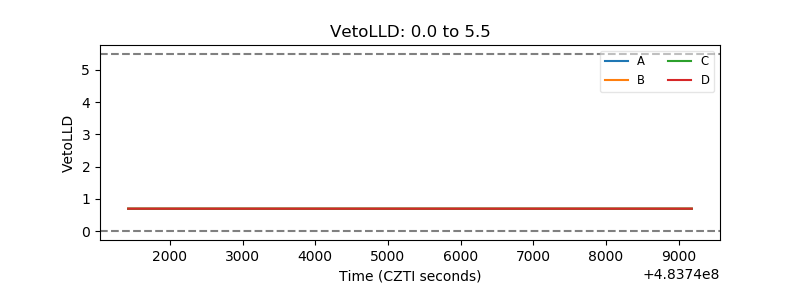 |
| Alpha Counter | 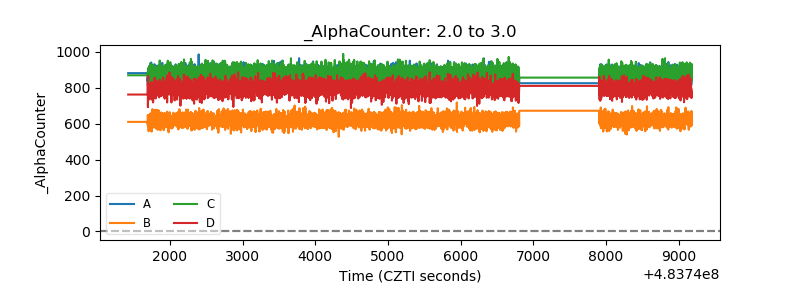 |
| _CPM_Rate | 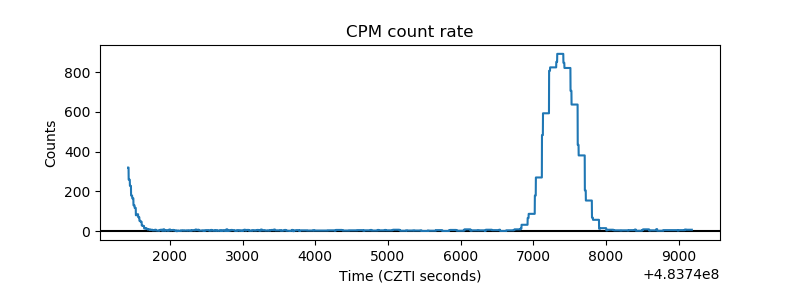 |
| CZT Counter | 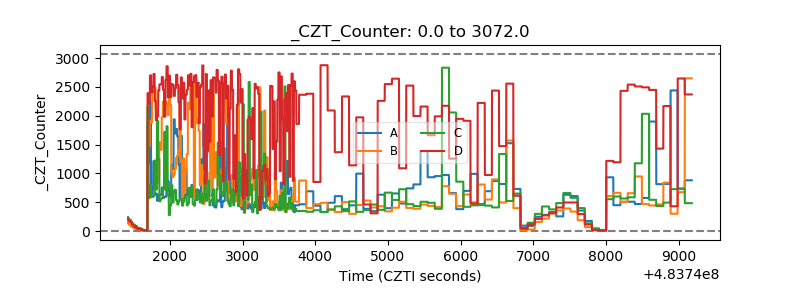 |
| +2.5 Volts monitor | 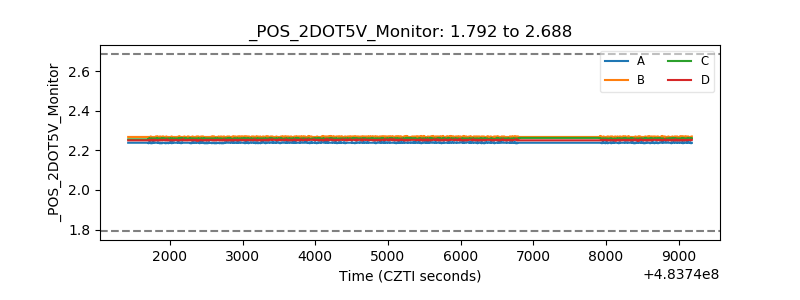 |
| +5 Volts monitor |  |
| _ROLL_ROT | 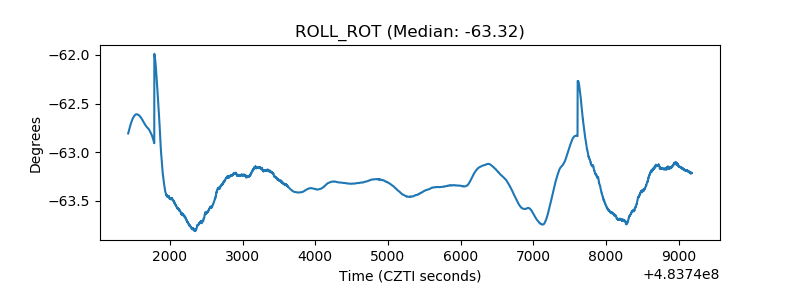 |
| _Roll_DEC | 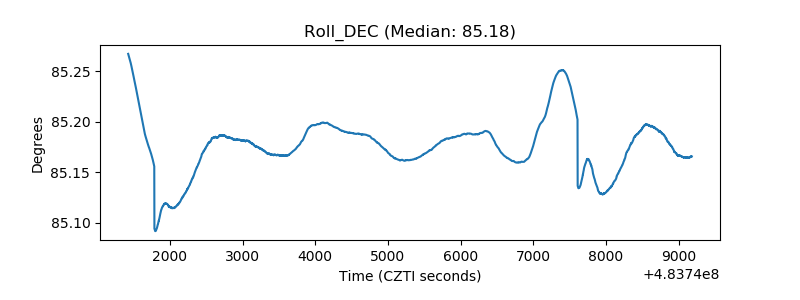 |
| _Roll_RA | 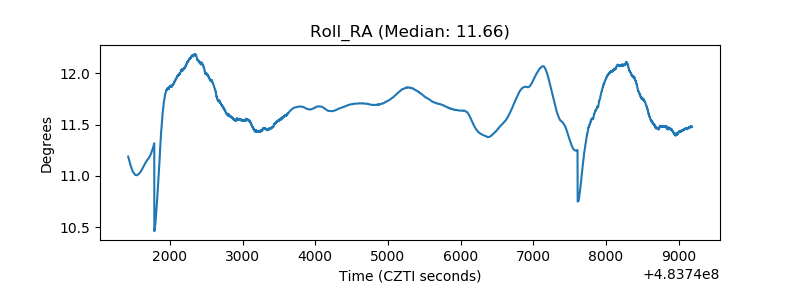 |
| Veto Counter | 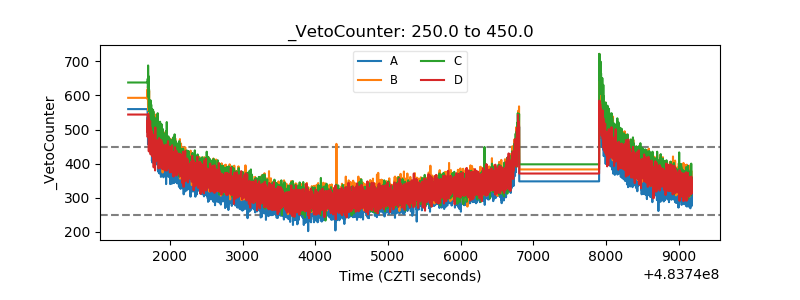 |