| Param | Original file | Final file |
|---|---|---|
| Filename | modeM0/AS1C09_011T05_9000006466_51872cztM0_level2.fits | modeM0/AS1C09_011T05_9000006466_51872cztM0_level2_quad_clean.evt |
| Size (bytes) | 723,355,200 | 91,327,680 |
| Size | 689.8 MB | 87.1 MB |
| Events in quadrant A | 5,551,858 | 631,462 |
| Events in quadrant B | 6,071,203 | 650,454 |
| Events in quadrant C | 4,589,015 | 621,529 |
| Events in quadrant D | 10,043,948 | 393,781 |
| Mode SS | |||
|---|---|---|---|
| Quadrant | BADHDUFLAG | Total packets | Discarded packets |
| A | 0 | 134 | 0 |
| B | 0 | 134 | 0 |
| C | 0 | 134 | 0 |
| D | 0 | 134 | 0 |
| Mode M0 | |||
|---|---|---|---|
| Quadrant | BADHDUFLAG | Total packets | Discarded packets |
| A | 0 | 21212 | 1 |
| B | 0 | 22674 | 1 |
| C | 0 | 18345 | 1 |
| D | 0 | 34509 | 1 |
| Mode M9 | |||
|---|---|---|---|
| Quadrant | BADHDUFLAG | Total packets | Discarded packets |
| A | 0 | 12 | 0 |
| B | 0 | 12 | 0 |
| C | 0 | 12 | 0 |
| D | 0 | 12 | 0 |
| Quadrant | Total seconds | Saturated seconds | Saturation percentage |
|---|---|---|---|
| A | 6718 | 262 | 3.899970% |
| B | 6718 | 841 | 12.518607% |
| C | 6718 | 342 | 5.090801% |
| D | 6719 | 2499 | 37.193035% |
Noise dominated data is calculated using 1-second bins in cleaned event files. If a bin has >2000 counts, and if more than 50% of those come from <1% of pixels, then it is considered to be noise-dominated and hence unusable.
| Quadrant | # 1 sec bins | Bins with >0 counts | Bins with >2000 counts | High rate bins dominated by noise | Noise dominated (total time) | Noise dominated (detector-on time) | Marked lightcurve |
|---|---|---|---|---|---|---|---|
| A | 7878 | 6719 | 249 | 249 | 3.16% | 3.71% | 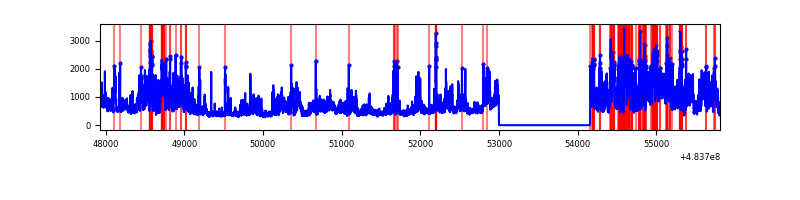 |
| B | 7878 | 6719 | 656 | 656 | 8.33% | 9.76% | 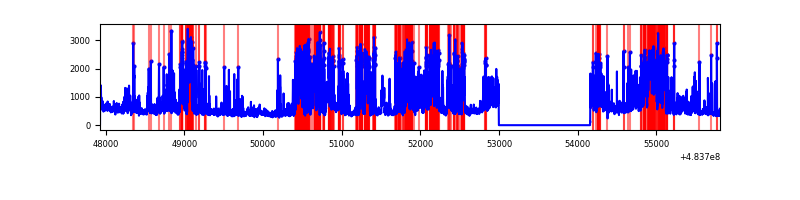 |
| C | 7878 | 6719 | 275 | 275 | 3.49% | 4.09% |  |
| D | 7879 | 6720 | 2224 | 2224 | 28.23% | 33.10% | 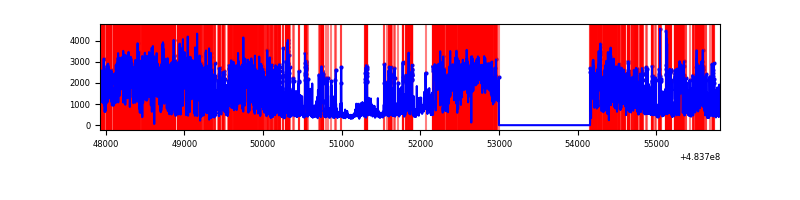 |
Top three noisy pixels from each quadrant. If the there are fewer than three noisy pixels in the level2.evt file, extra rows are filled as -1
| Pixel properties | Quadrant properties | ||||||
|---|---|---|---|---|---|---|---|
| Quadrant | DetID | PixID | Counts | Sigma | Mean | Median | Sigma |
| A | 12 | 3 | 1765149 | 10188.68 | 694 | 679 | 173.2 |
| A | 12 | 194 | 207490 | 1194.2 | 694 | 679 | 173.2 |
| A | 4 | 3 | 144559 | 830.81 | 694 | 679 | 173.2 |
| B | 4 | 170 | 2102442 | 14541.59 | 683 | 661 | 144.5 |
| B | 4 | 81 | 290790 | 2007.32 | 683 | 661 | 144.5 |
| B | 7 | 252 | 177154 | 1221.1 | 683 | 661 | 144.5 |
| C | 14 | 80 | 703208 | 3698.78 | 684 | 677 | 189.9 |
| C | 13 | 3 | 223600 | 1173.67 | 684 | 677 | 189.9 |
| C | 1 | 44 | 222653 | 1168.69 | 684 | 677 | 189.9 |
| D | 11 | 129 | 6282807 | 40855.02 | 543 | 524 | 153.8 |
| D | 3 | 12 | 477102 | 3099.29 | 543 | 524 | 153.8 |
| D | 8 | 176 | 454560 | 2952.69 | 543 | 524 | 153.8 |
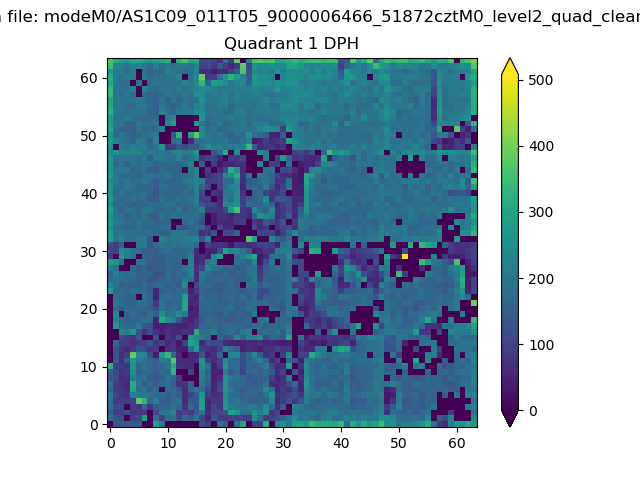
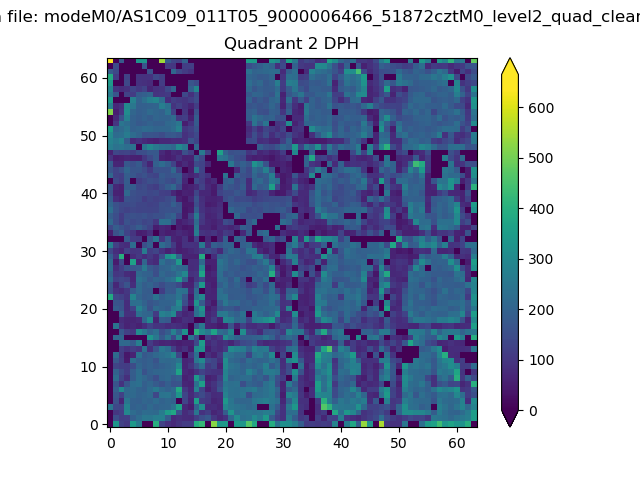
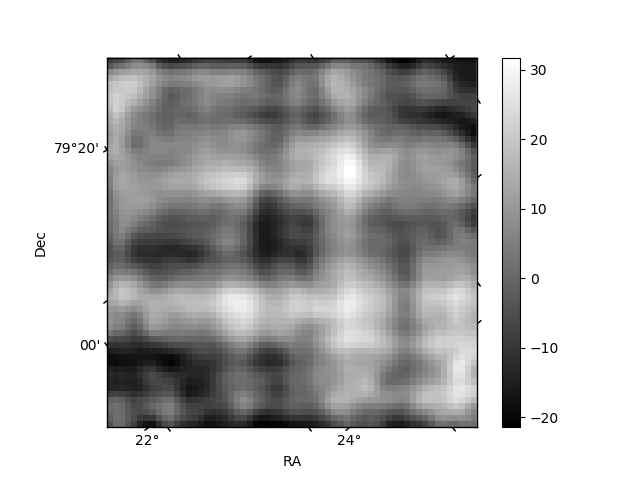
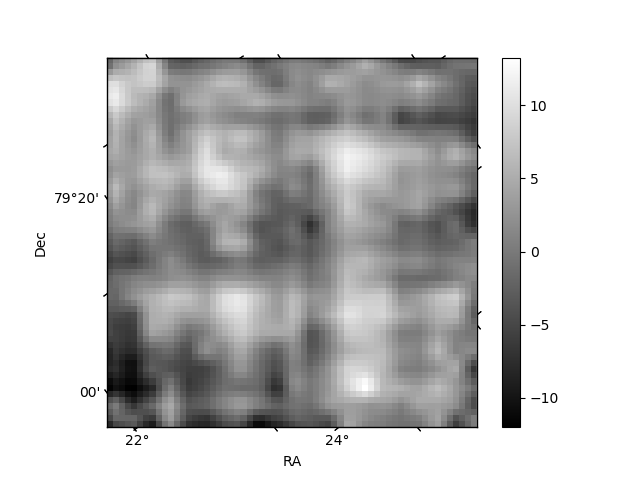
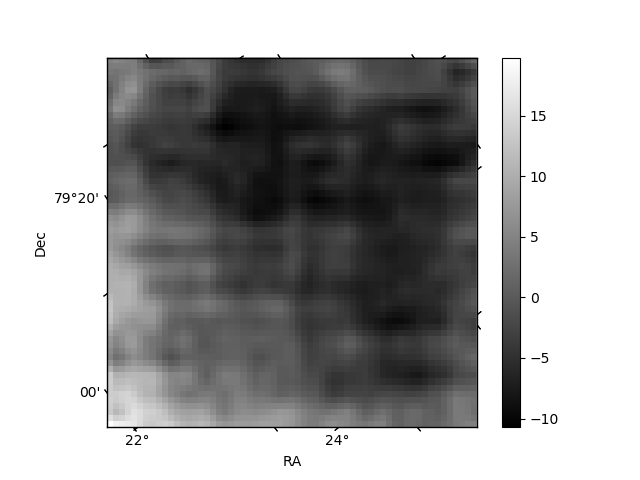
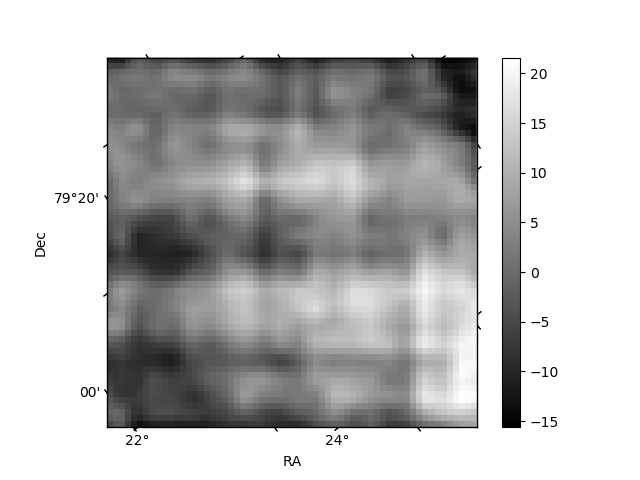
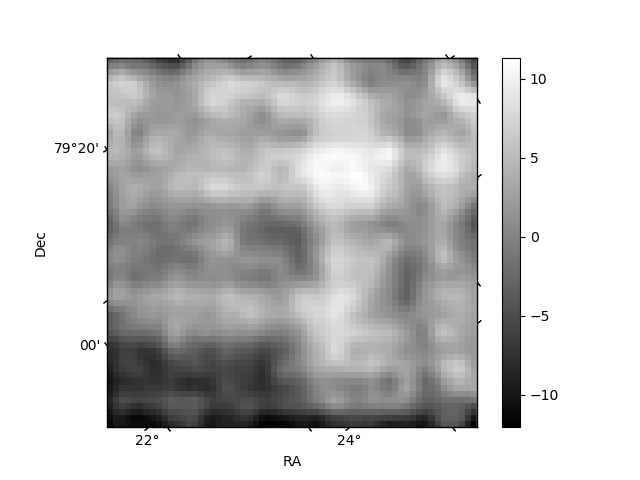
Histogram calculated using DETX and DETY for each event in the final _common_clean file
| Quadrant A | 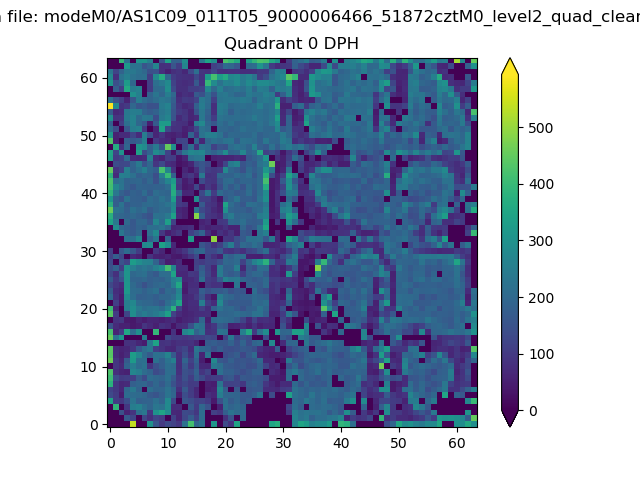 |
 |
Quadrant B |
|---|---|---|---|
| Quadrant D | 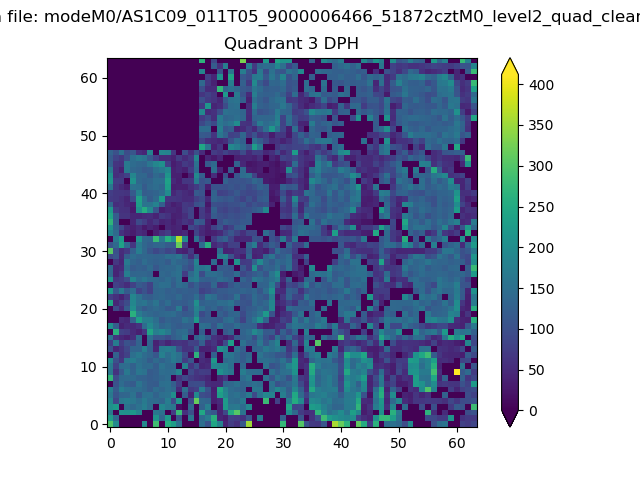 |
 |
Quadrant C |
| Plot type | Count rate plots | Images |
|---|---|---|
| Comparison with Poisson distribution Blue bars denote a histogram of data divided into 1 sec bins. Red curve is a Poisson curve with rate = median count rate of data. |
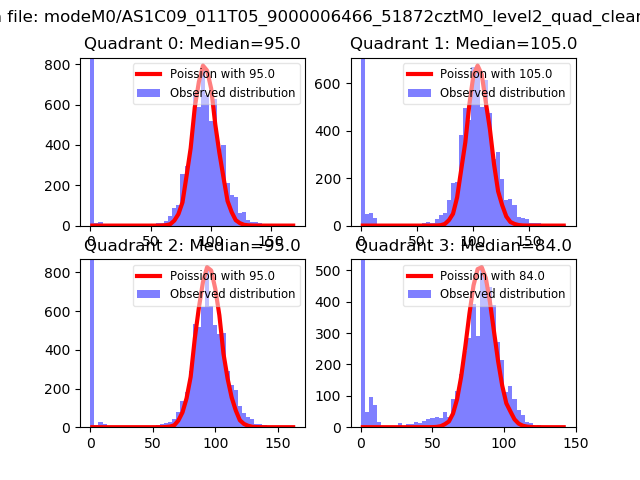 |
 |
| Quadrant-wise count rates Data is divided into 100 sec bins |
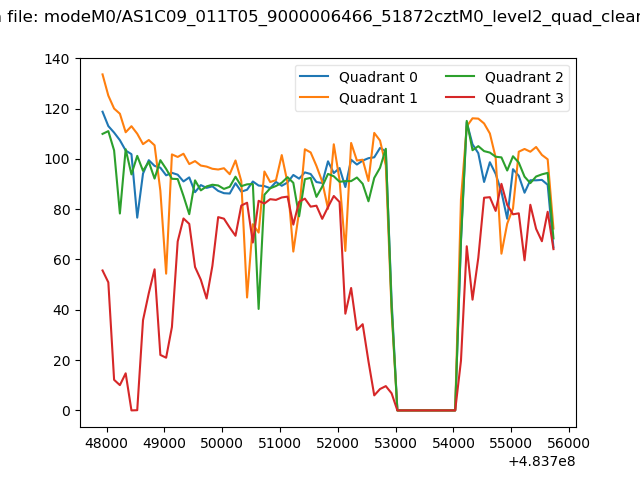 |
|
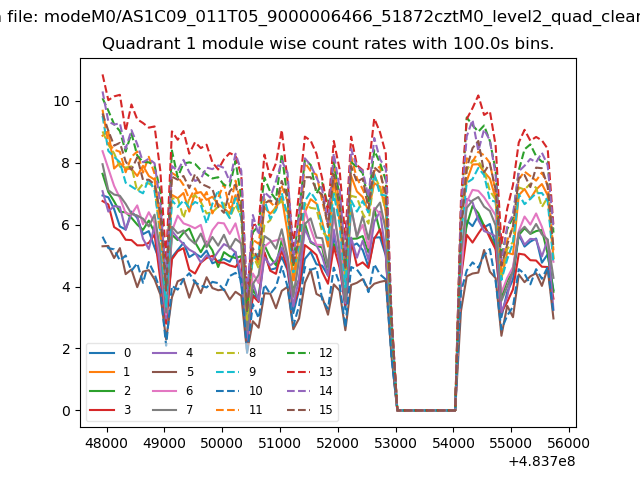
| Module-wise count rates for Quadrant A Data is divided into 100 sec bins |
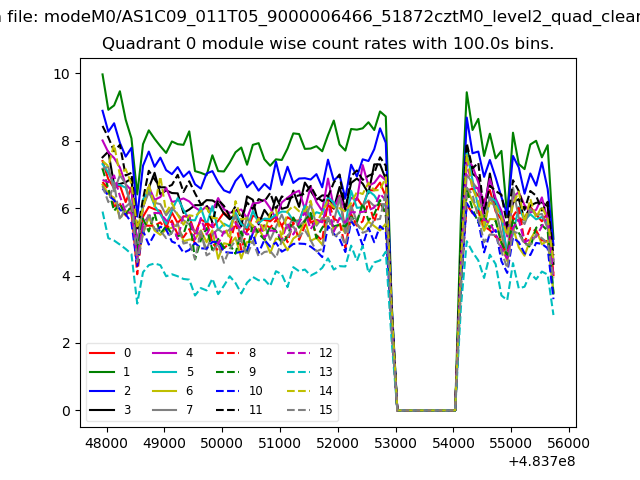 |
 |
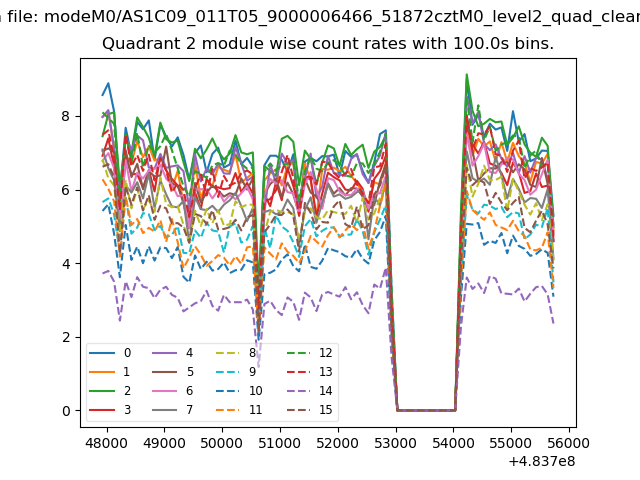
| Module-wise count rates for Quadrant B Data is divided into 100 sec bins |
 |
 |
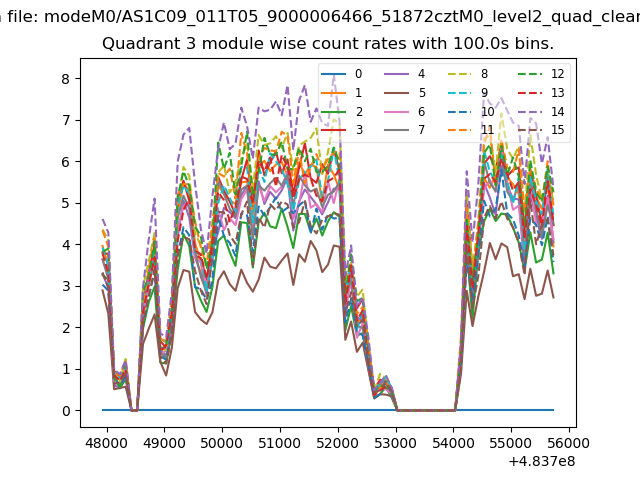
| Module-wise count rates for Quadrant C Data is divided into 100 sec bins |
 |
 |
| Module-wise count rates for Quadrant D Data is divided into 100 sec bins |
 |
 |
| Parameter | Plot |
|---|---|
| CZT HV Monitor | 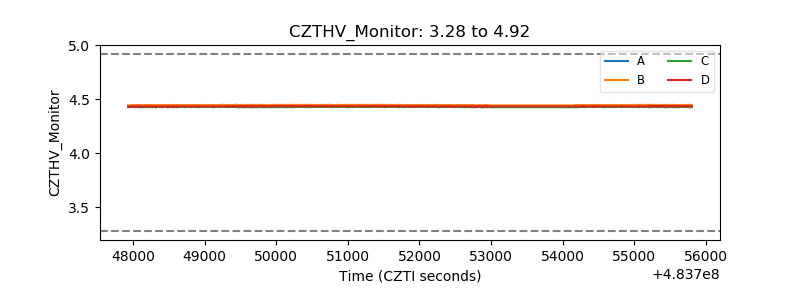 |
| D_VDD | 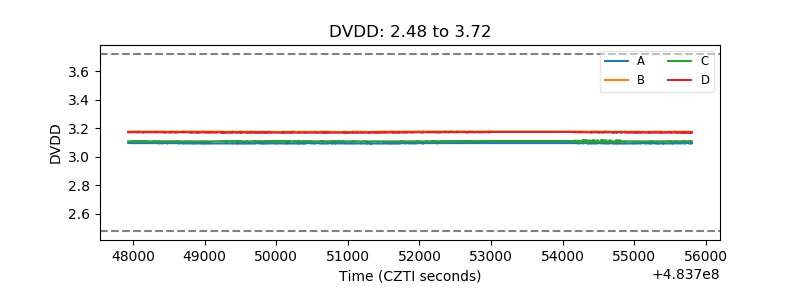 |
| Temperature 1 | 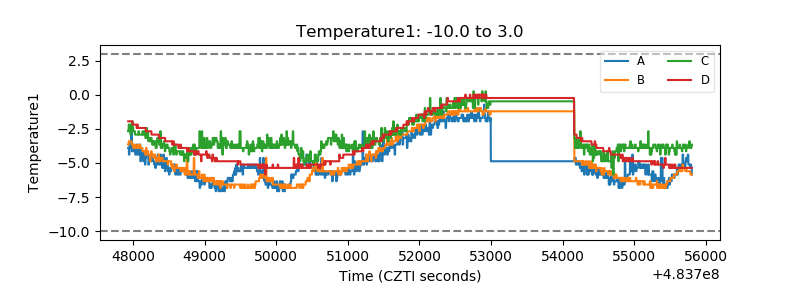 |
| Veto HV Monitor | 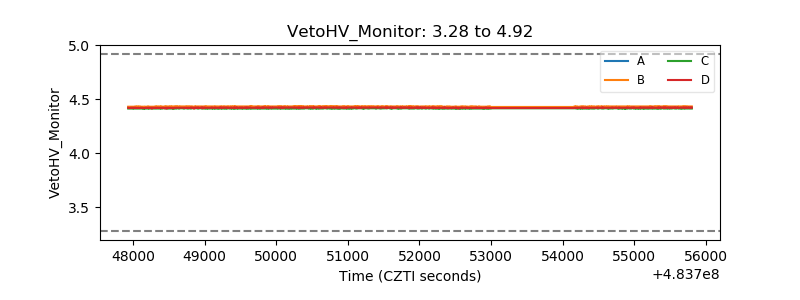 |
| Veto LLD | 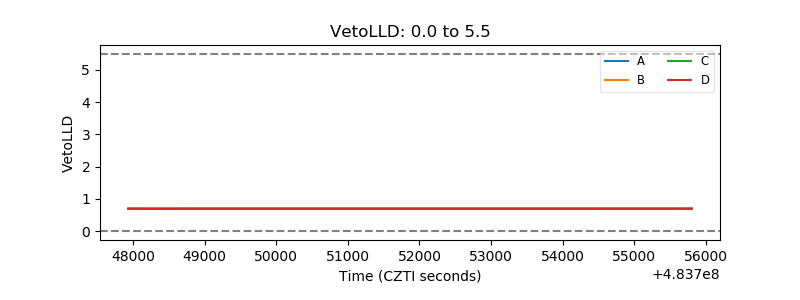 |
| Alpha Counter | 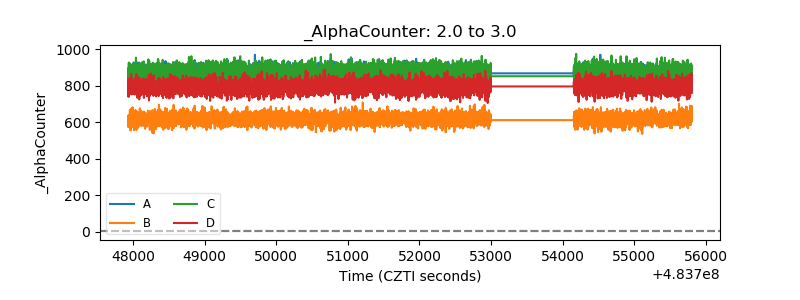 |
| _CPM_Rate | 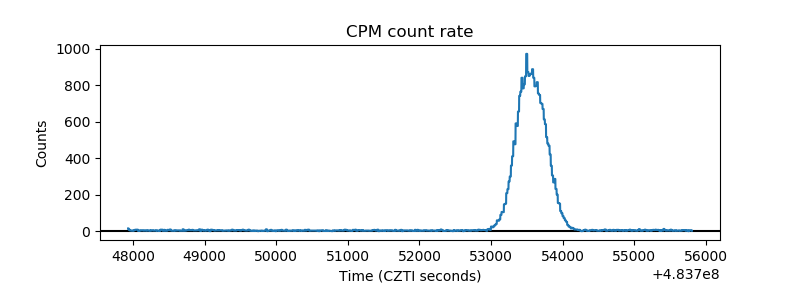 |
| CZT Counter | 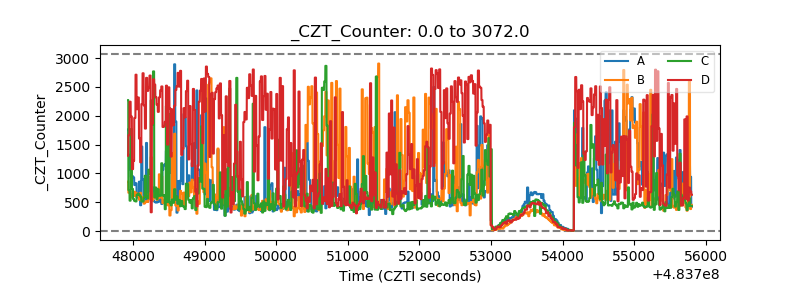 |
| +2.5 Volts monitor | 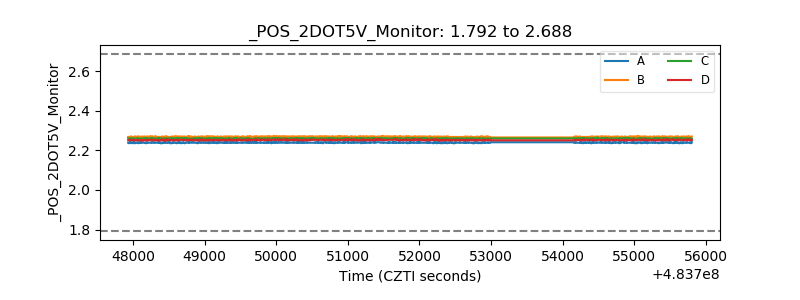 |
| +5 Volts monitor | 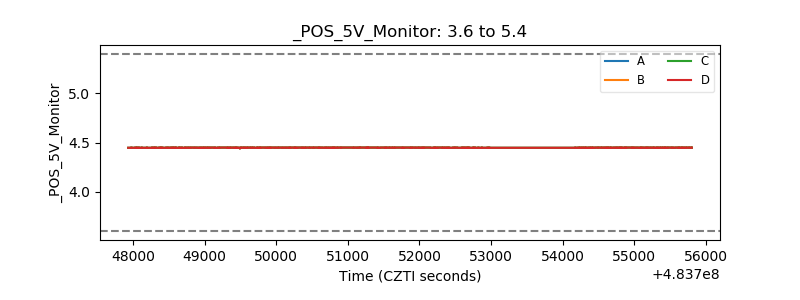 |
| _ROLL_ROT | 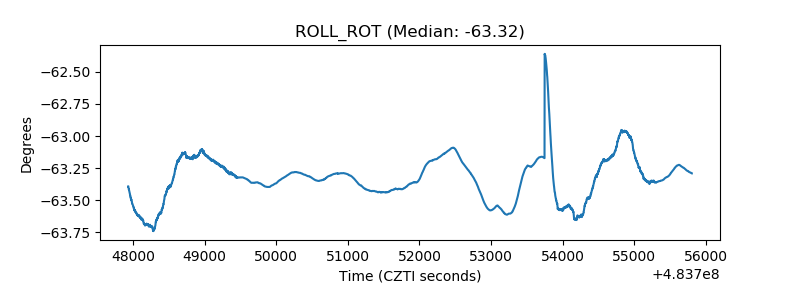 |
| _Roll_DEC | 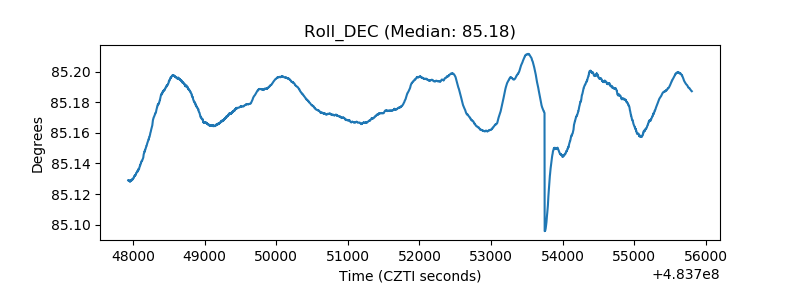 |
| _Roll_RA | 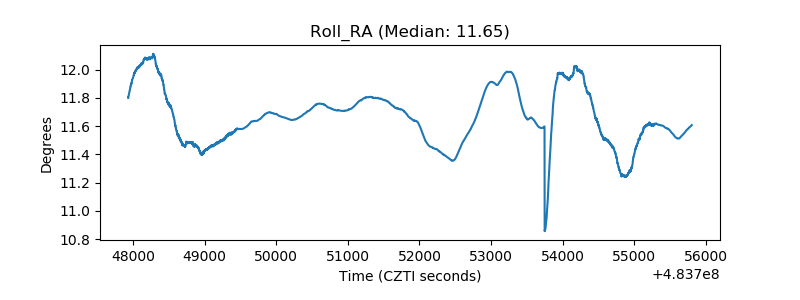 |
| Veto Counter | 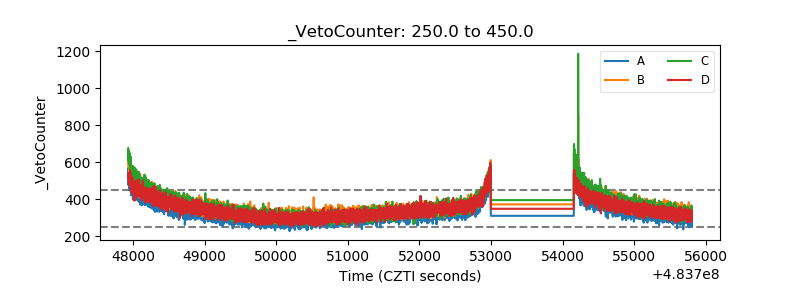 |