| Param | Original file | Final file |
|---|---|---|
| Filename | modeM0/AS1C09_011T05_9000006466_51873cztM0_level2.fits | modeM0/AS1C09_011T05_9000006466_51873cztM0_level2_quad_clean.evt |
| Size (bytes) | 612,648,000 | 86,169,600 |
| Size | 584.3 MB | 82.2 MB |
| Events in quadrant A | 6,246,575 | 553,860 |
| Events in quadrant B | 4,518,225 | 623,946 |
| Events in quadrant C | 3,547,572 | 580,123 |
| Events in quadrant D | 7,886,540 | 419,204 |
| Mode SS | |||
|---|---|---|---|
| Quadrant | BADHDUFLAG | Total packets | Discarded packets |
| A | 0 | 124 | 0 |
| B | 0 | 124 | 0 |
| C | 0 | 124 | 0 |
| D | 0 | 124 | 0 |
| Mode M0 | |||
|---|---|---|---|
| Quadrant | BADHDUFLAG | Total packets | Discarded packets |
| A | 0 | 22901 | 1 |
| B | 0 | 17672 | 1 |
| C | 0 | 14891 | 1 |
| D | 0 | 27746 | 1 |
| Mode M9 | |||
|---|---|---|---|
| Quadrant | BADHDUFLAG | Total packets | Discarded packets |
| A | 0 | 12 | 0 |
| B | 0 | 12 | 0 |
| C | 0 | 12 | 0 |
| D | 0 | 12 | 0 |
| Quadrant | Total seconds | Saturated seconds | Saturation percentage |
|---|---|---|---|
| A | 6191 | 479 | 7.737038% |
| B | 6191 | 375 | 6.057180% |
| C | 6192 | 83 | 1.340439% |
| D | 6192 | 1524 | 24.612403% |
Noise dominated data is calculated using 1-second bins in cleaned event files. If a bin has >2000 counts, and if more than 50% of those come from <1% of pixels, then it is considered to be noise-dominated and hence unusable.
| Quadrant | # 1 sec bins | Bins with >0 counts | Bins with >2000 counts | High rate bins dominated by noise | Noise dominated (total time) | Noise dominated (detector-on time) | Marked lightcurve |
|---|---|---|---|---|---|---|---|
| A | 7365 | 6196 | 327 | 327 | 4.44% | 5.28% | 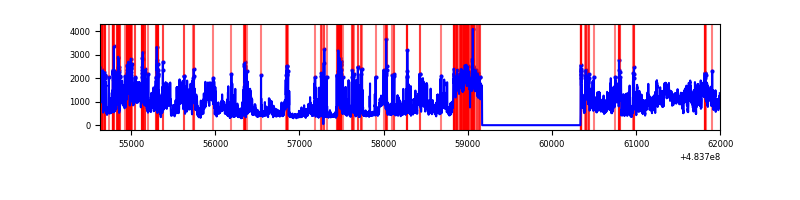 |
| B | 7365 | 6196 | 259 | 259 | 3.52% | 4.18% | 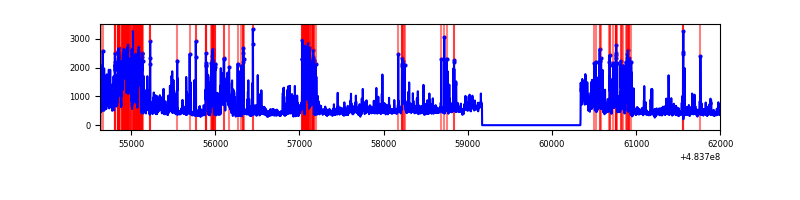 |
| C | 7366 | 6197 | 79 | 79 | 1.07% | 1.27% | 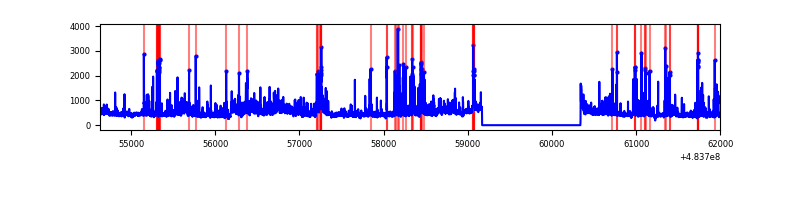 |
| D | 7366 | 6197 | 1447 | 1447 | 19.64% | 23.35% | 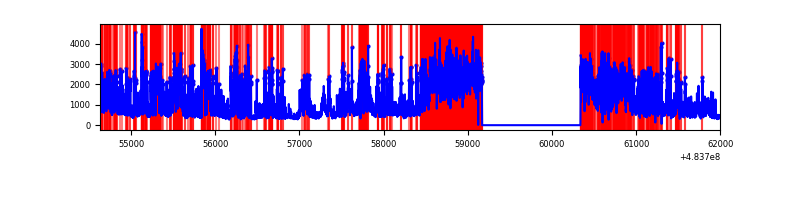 |
Top three noisy pixels from each quadrant. If the there are fewer than three noisy pixels in the level2.evt file, extra rows are filled as -1
| Pixel properties | Quadrant properties | ||||||
|---|---|---|---|---|---|---|---|
| Quadrant | DetID | PixID | Counts | Sigma | Mean | Median | Sigma |
| A | 12 | 3 | 2008579 | 12943.14 | 621 | 607 | 155.1 |
| A | 12 | 80 | 359239 | 2311.7 | 621 | 607 | 155.1 |
| A | 15 | 174 | 287073 | 1846.52 | 621 | 607 | 155.1 |
| B | 4 | 170 | 653905 | 4921.13 | 627 | 606 | 132.8 |
| B | 4 | 81 | 394820 | 2969.51 | 627 | 606 | 132.8 |
| B | 5 | 172 | 258849 | 1945.28 | 627 | 606 | 132.8 |
| C | 13 | 3 | 319212 | 1852.0 | 622 | 616 | 172.0 |
| C | 10 | 22 | 301385 | 1748.37 | 622 | 616 | 172.0 |
| C | 15 | 189 | 112229 | 648.81 | 622 | 616 | 172.0 |
| D | 11 | 129 | 4592201 | 31158.2 | 521 | 502 | 147.4 |
| D | 8 | 176 | 569319 | 3859.86 | 521 | 502 | 147.4 |
| D | 3 | 12 | 151776 | 1026.51 | 521 | 502 | 147.4 |
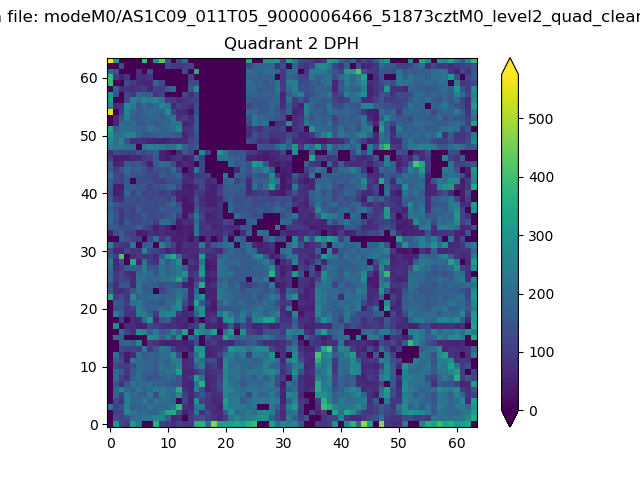
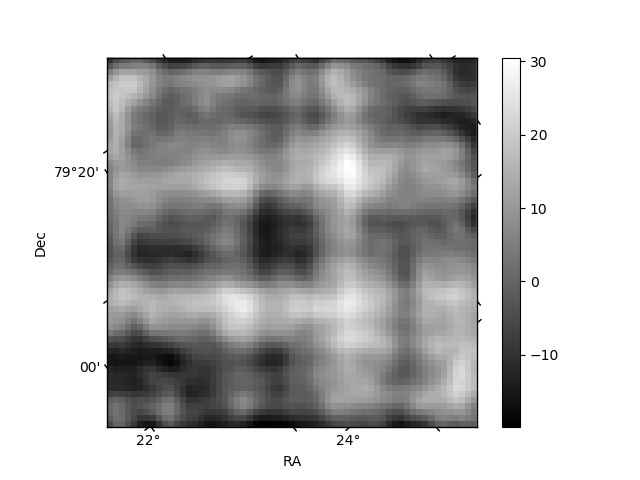
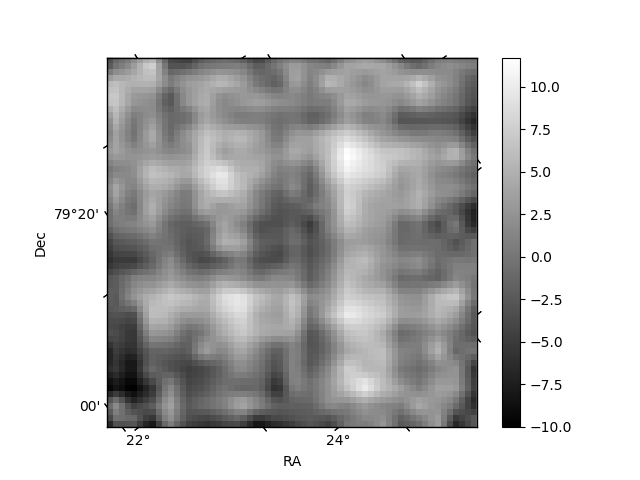
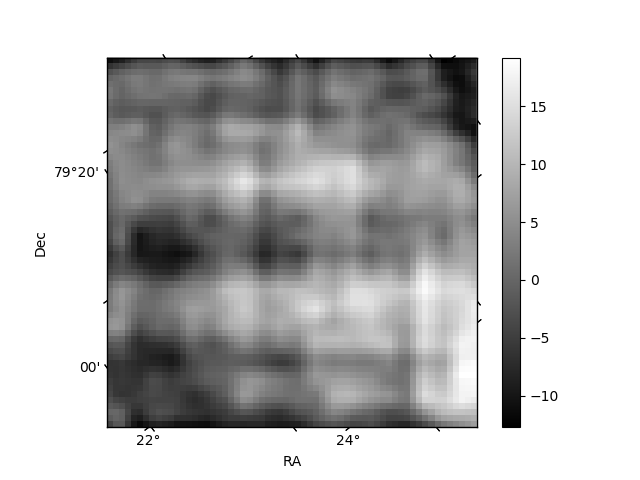
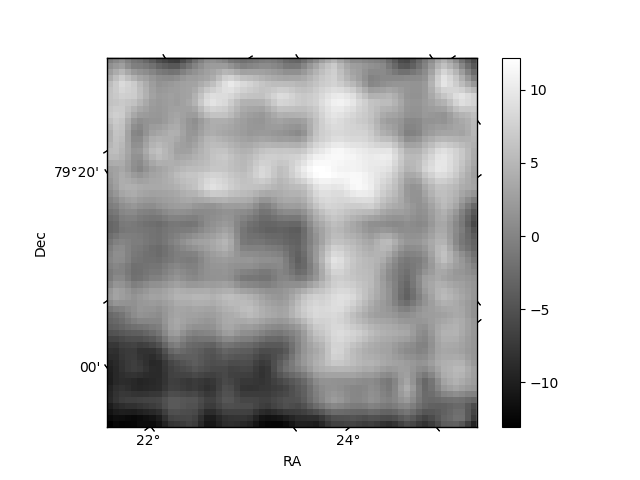
Histogram calculated using DETX and DETY for each event in the final _common_clean file
| Quadrant A | 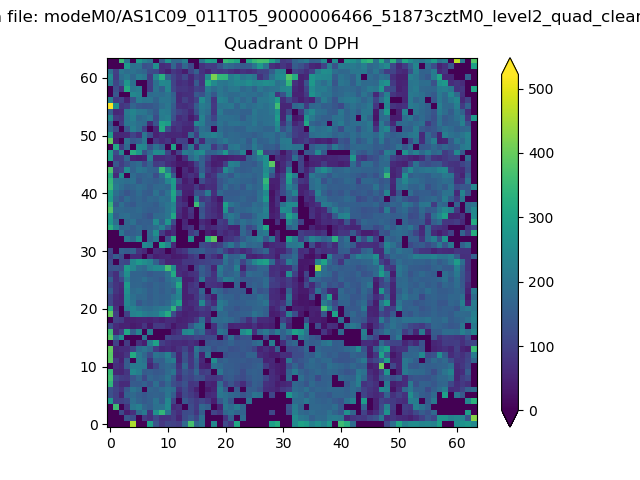 |
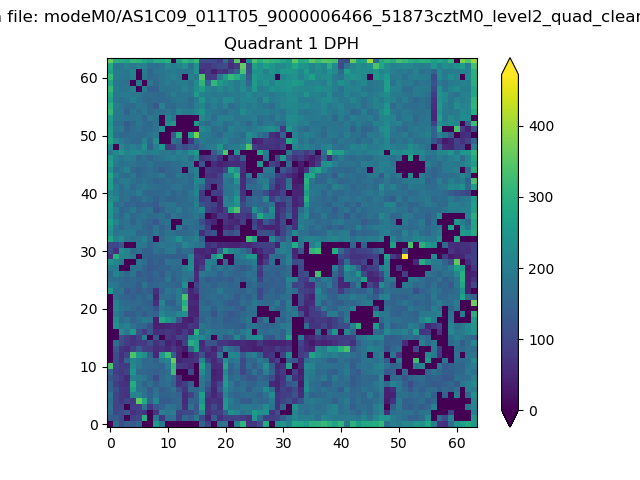 |
Quadrant B |
|---|---|---|---|
| Quadrant D | 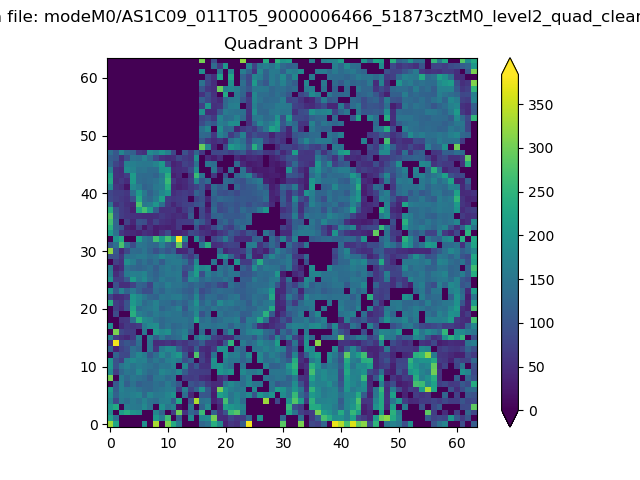 |
 |
Quadrant C |
| Plot type | Count rate plots | Images |
|---|---|---|
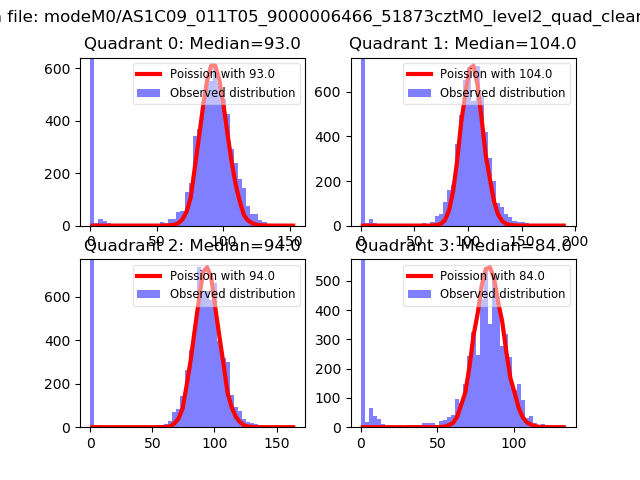
| Comparison with Poisson distribution Blue bars denote a histogram of data divided into 1 sec bins. Red curve is a Poisson curve with rate = median count rate of data. |
 |
 |
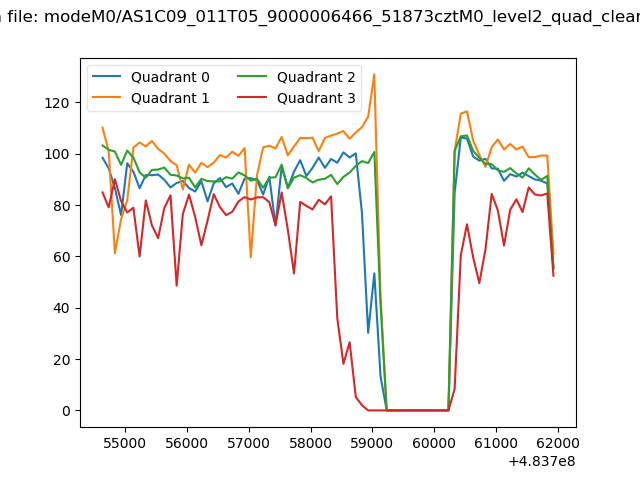
| Quadrant-wise count rates Data is divided into 100 sec bins |
 |
|
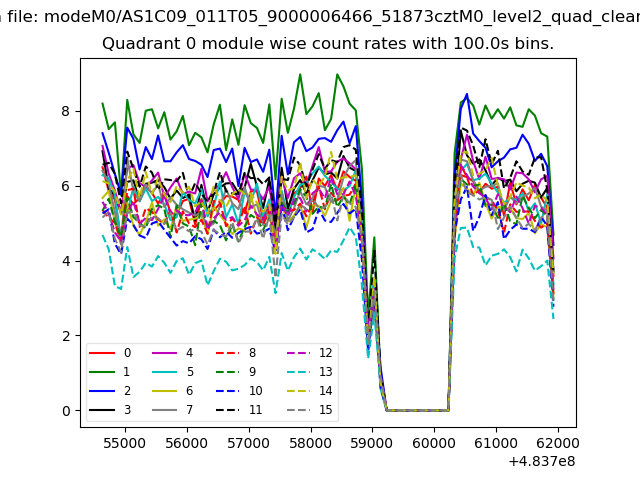
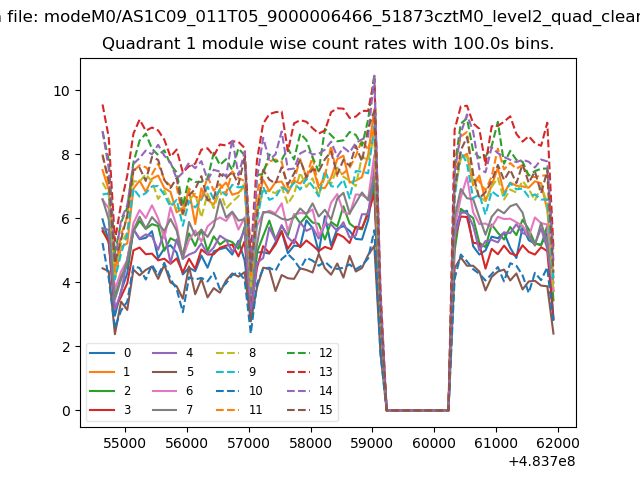
| Module-wise count rates for Quadrant A Data is divided into 100 sec bins |
 |
 |
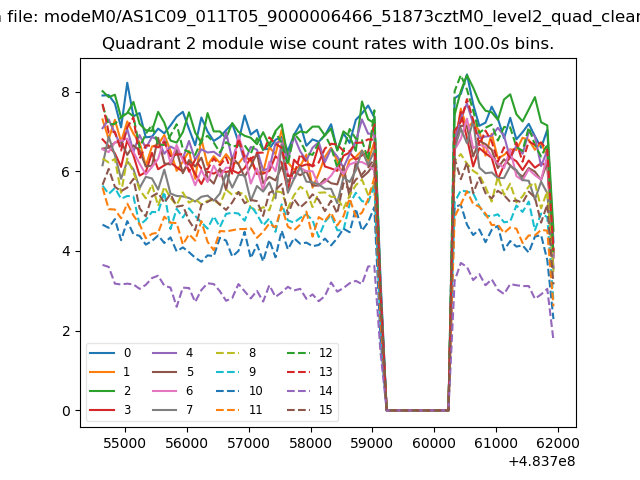
| Module-wise count rates for Quadrant B Data is divided into 100 sec bins |
 |
 |
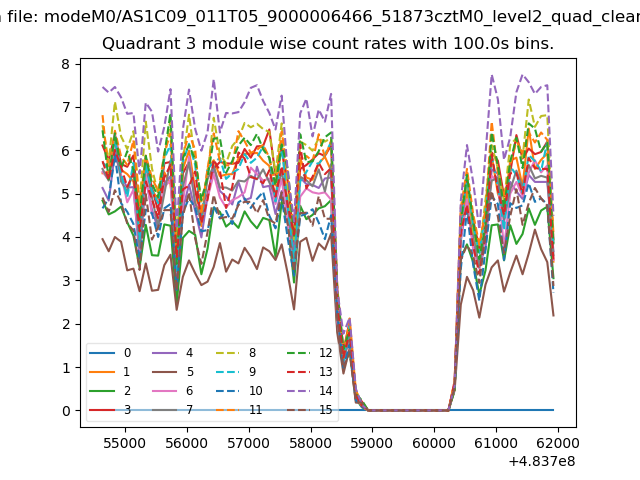
| Module-wise count rates for Quadrant C Data is divided into 100 sec bins |
 |
 |
| Module-wise count rates for Quadrant D Data is divided into 100 sec bins |
 |
 |
| Parameter | Plot |
|---|---|
| CZT HV Monitor | 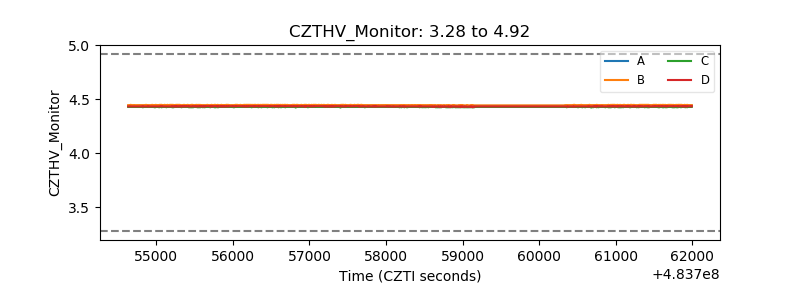 |
| D_VDD | 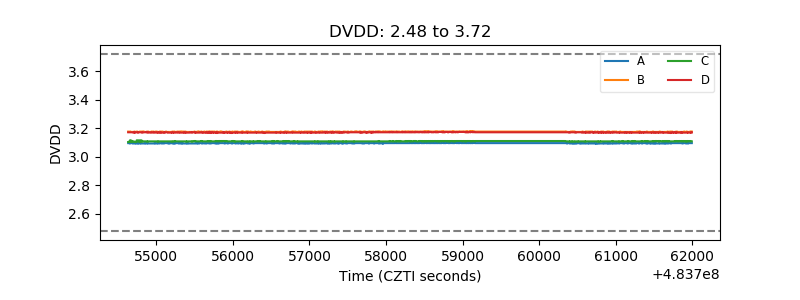 |
| Temperature 1 | 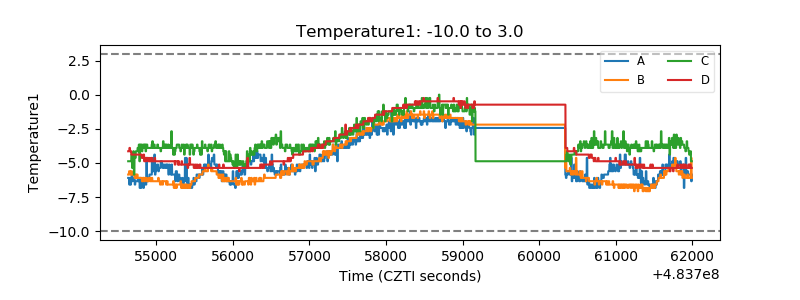 |
| Veto HV Monitor |  |
| Veto LLD | 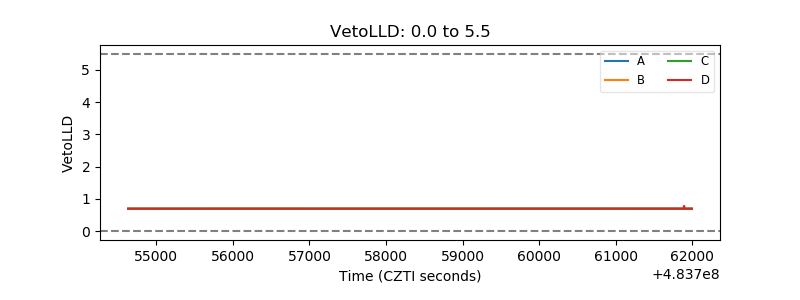 |
| Alpha Counter | 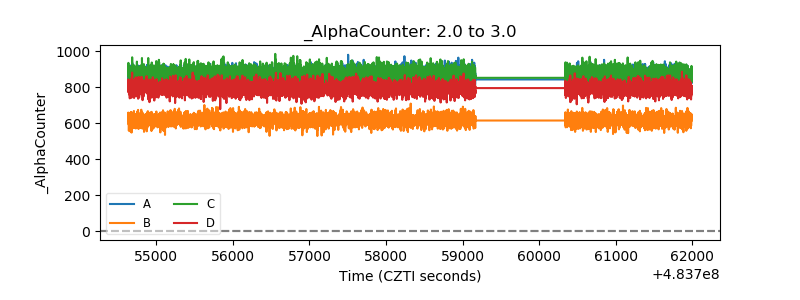 |
| _CPM_Rate | 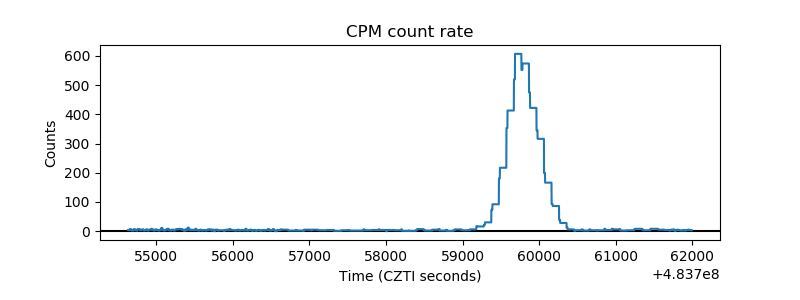 |
| CZT Counter | 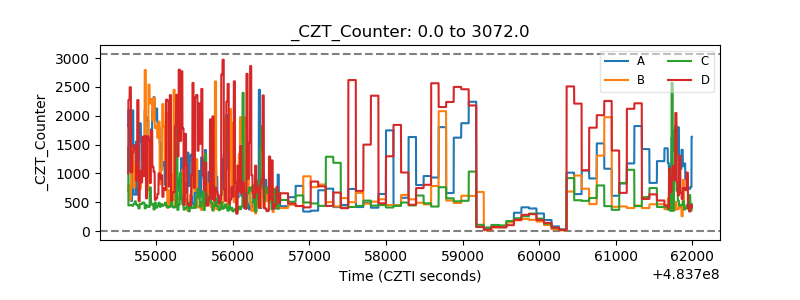 |
| +2.5 Volts monitor | 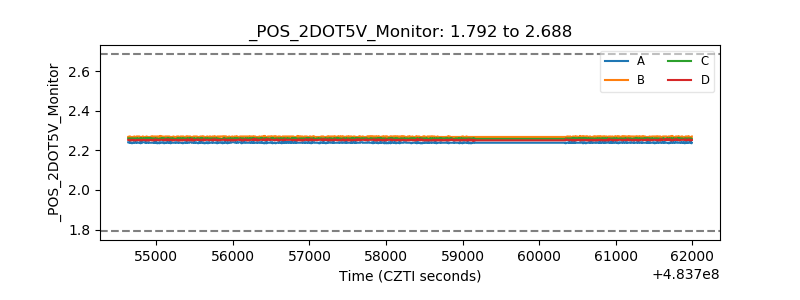 |
| +5 Volts monitor |  |
| _ROLL_ROT | 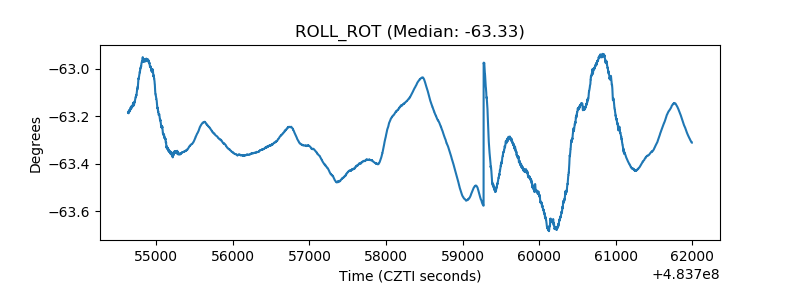 |
| _Roll_DEC | 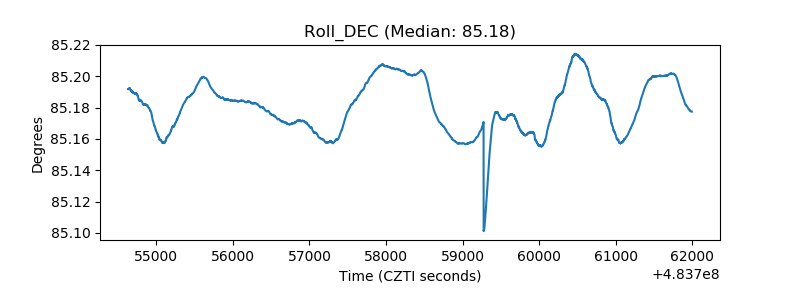 |
| _Roll_RA | 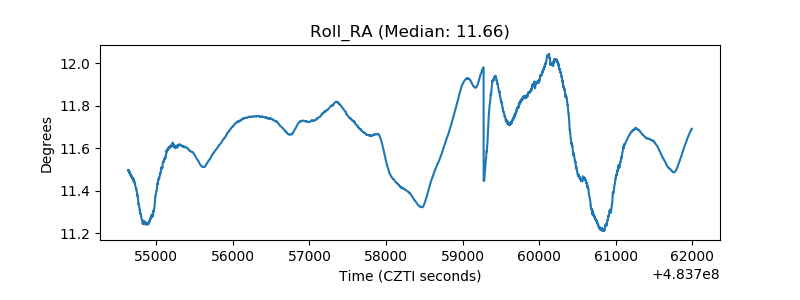 |
| Veto Counter | 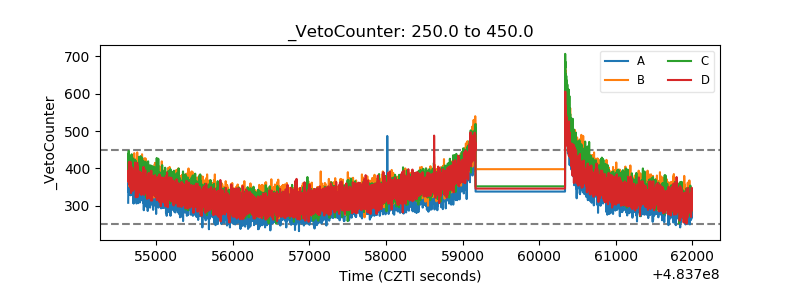 |