| Param | Original file | Final file |
|---|---|---|
| Filename | modeM0/AS1C09_011T05_9000006466_51875cztM0_level2.fits | modeM0/AS1C09_011T05_9000006466_51875cztM0_level2_quad_clean.evt |
| Size (bytes) | 686,606,400 | 82,932,480 |
| Size | 654.8 MB | 79.1 MB |
| Events in quadrant A | 6,458,456 | 562,240 |
| Events in quadrant B | 7,187,656 | 524,778 |
| Events in quadrant C | 2,984,713 | 574,256 |
| Events in quadrant D | 8,295,230 | 407,301 |
| Mode SS | |||
|---|---|---|---|
| Quadrant | BADHDUFLAG | Total packets | Discarded packets |
| A | 0 | 130 | 0 |
| B | 0 | 130 | 0 |
| C | 0 | 130 | 0 |
| D | 0 | 130 | 0 |
| Mode M0 | |||
|---|---|---|---|
| Quadrant | BADHDUFLAG | Total packets | Discarded packets |
| A | 0 | 23655 | 1 |
| B | 0 | 25651 | 1 |
| C | 0 | 13744 | 1 |
| D | 0 | 29115 | 1 |
| Mode M9 | |||
|---|---|---|---|
| Quadrant | BADHDUFLAG | Total packets | Discarded packets |
| A | 0 | 7 | 0 |
| B | 0 | 7 | 0 |
| C | 0 | 7 | 0 |
| D | 0 | 7 | 0 |
| Quadrant | Total seconds | Saturated seconds | Saturation percentage |
|---|---|---|---|
| A | 6329 | 371 | 5.861906% |
| B | 6330 | 1458 | 23.033175% |
| C | 6330 | 46 | 0.726698% |
| D | 6330 | 1706 | 26.951027% |
Noise dominated data is calculated using 1-second bins in cleaned event files. If a bin has >2000 counts, and if more than 50% of those come from <1% of pixels, then it is considered to be noise-dominated and hence unusable.
| Quadrant | # 1 sec bins | Bins with >0 counts | Bins with >2000 counts | High rate bins dominated by noise | Noise dominated (total time) | Noise dominated (detector-on time) | Marked lightcurve |
|---|---|---|---|---|---|---|---|
| A | 7044 | 6326 | 213 | 213 | 3.02% | 3.37% | 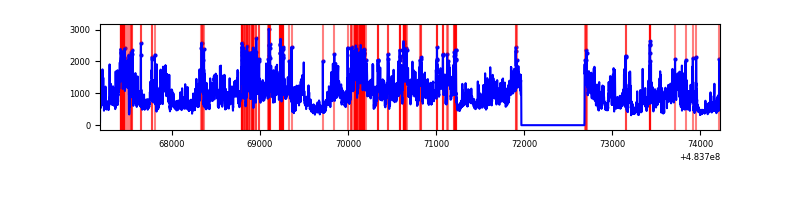 |
| B | 7045 | 6327 | 1139 | 1139 | 16.17% | 18.00% | 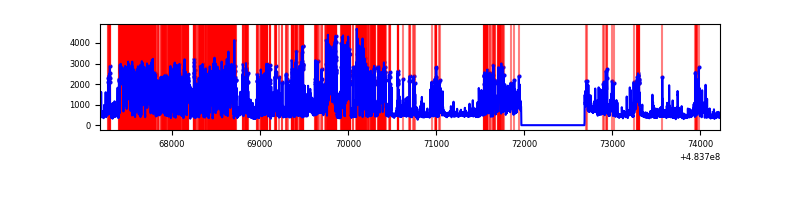 |
| C | 7045 | 6327 | 18 | 18 | 0.26% | 0.28% | 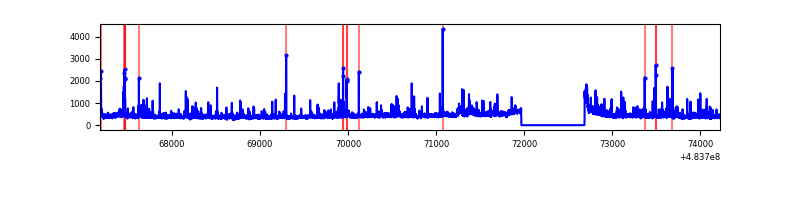 |
| D | 7045 | 6327 | 1605 | 1605 | 22.78% | 25.37% | 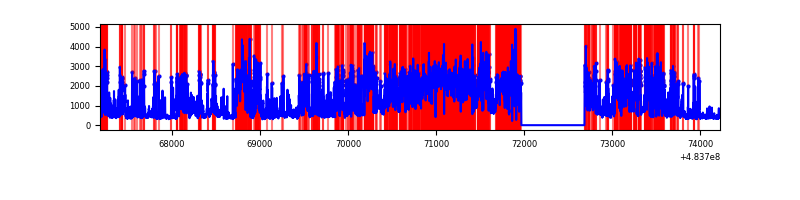 |
Top three noisy pixels from each quadrant. If the there are fewer than three noisy pixels in the level2.evt file, extra rows are filled as -1
| Pixel properties | Quadrant properties | ||||||
|---|---|---|---|---|---|---|---|
| Quadrant | DetID | PixID | Counts | Sigma | Mean | Median | Sigma |
| A | 12 | 3 | 2284688 | 14262.07 | 646 | 630 | 160.1 |
| A | 4 | 175 | 589183 | 3675.03 | 646 | 630 | 160.1 |
| A | 4 | 253 | 266173 | 1658.1 | 646 | 630 | 160.1 |
| B | 4 | 170 | 3629998 | 28370.28 | 600 | 580 | 127.9 |
| B | 1 | 255 | 263848 | 2057.9 | 600 | 580 | 127.9 |
| B | 8 | 176 | 248657 | 1939.16 | 600 | 580 | 127.9 |
| C | 13 | 3 | 86282 | 489.14 | 635 | 629 | 175.1 |
| C | 15 | 231 | 75441 | 427.23 | 635 | 629 | 175.1 |
| C | 15 | 224 | 51813 | 292.3 | 635 | 629 | 175.1 |
| D | 11 | 129 | 4565420 | 29310.29 | 555 | 535 | 155.7 |
| D | 8 | 176 | 530291 | 3401.47 | 555 | 535 | 155.7 |
| D | 3 | 12 | 350274 | 2245.61 | 555 | 535 | 155.7 |
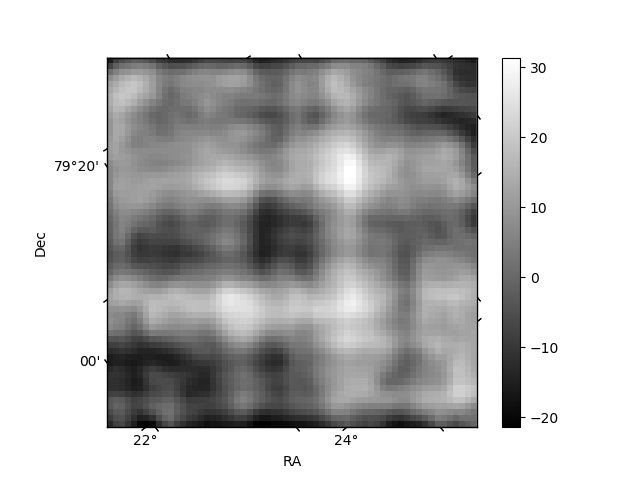
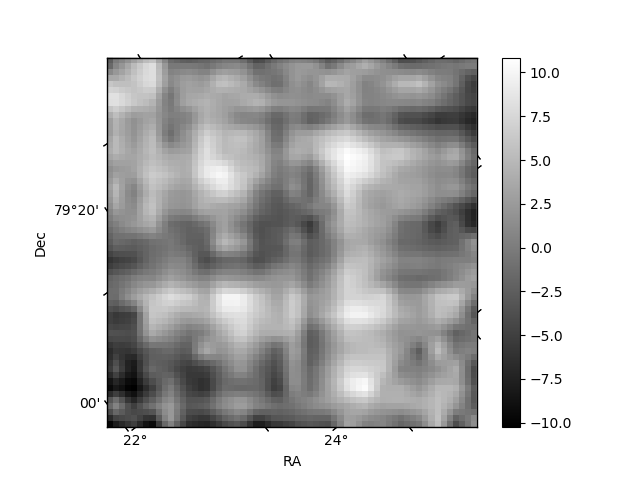
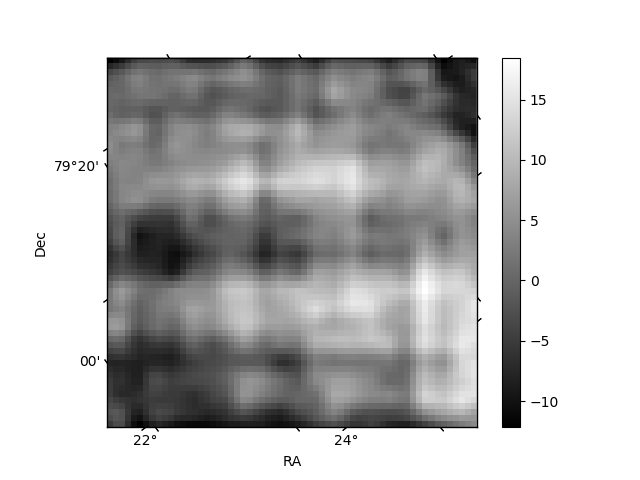
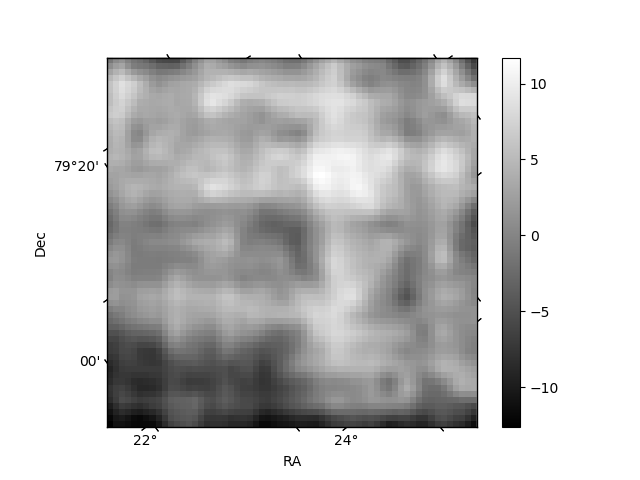
Histogram calculated using DETX and DETY for each event in the final _common_clean file
| Quadrant A | 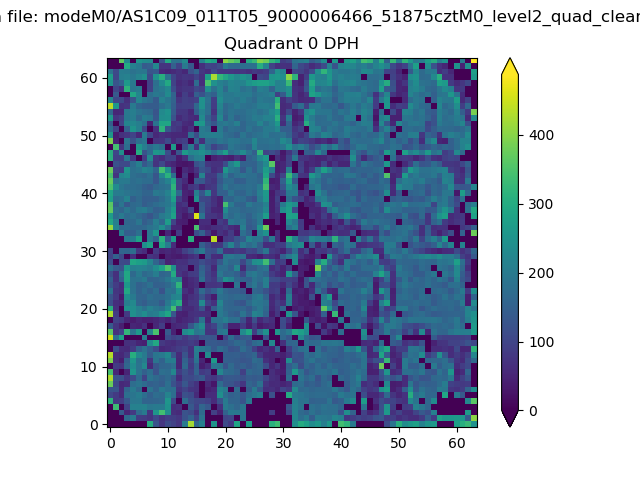 |
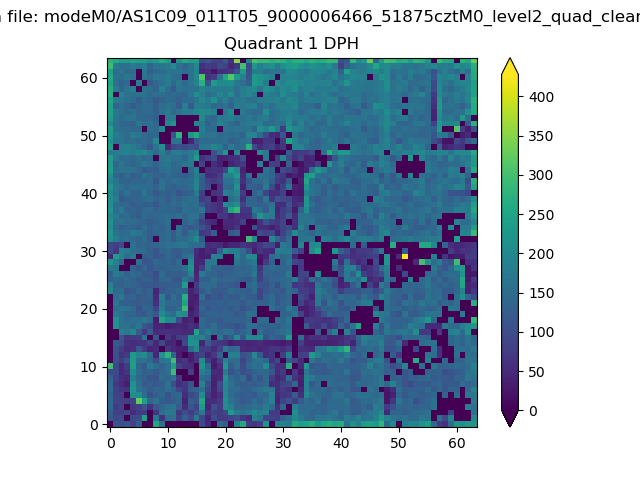 |
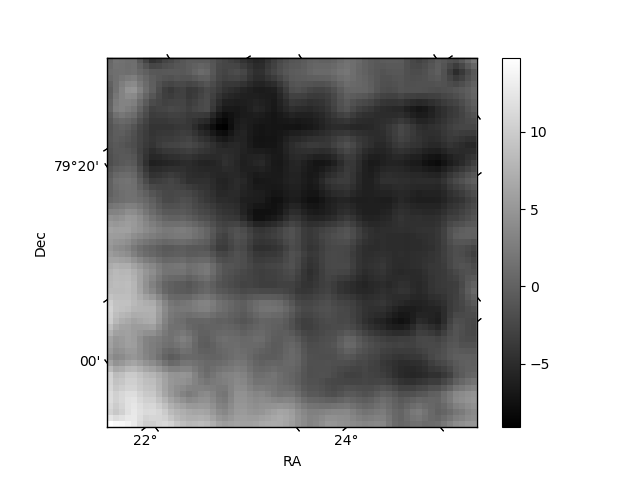
Quadrant B |
|---|---|---|---|
| Quadrant D | 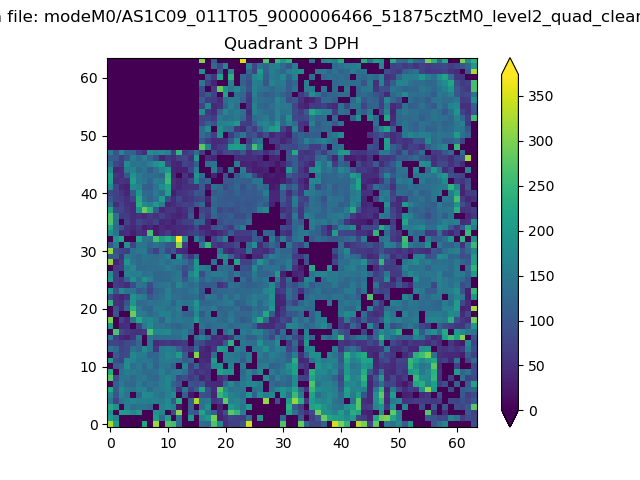 |
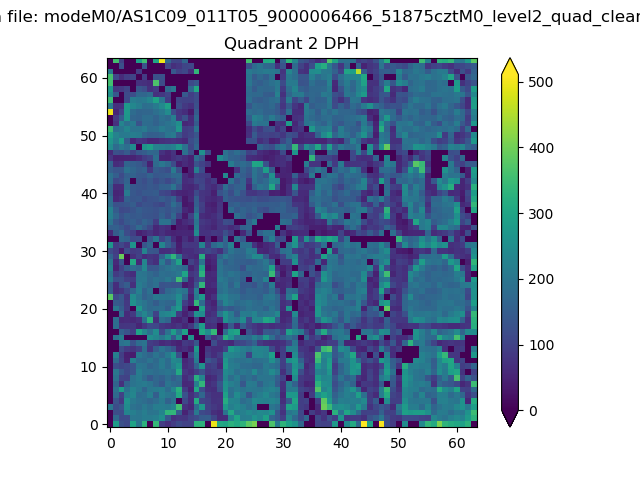 |
Quadrant C |
| Plot type | Count rate plots | Images |
|---|---|---|
| Comparison with Poisson distribution Blue bars denote a histogram of data divided into 1 sec bins. Red curve is a Poisson curve with rate = median count rate of data. |
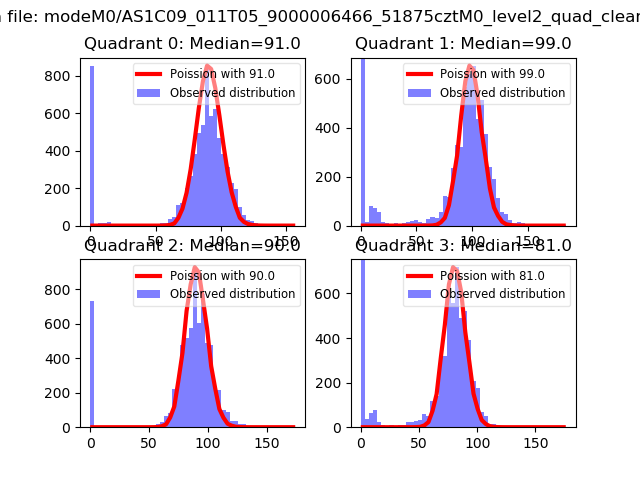 |
 |
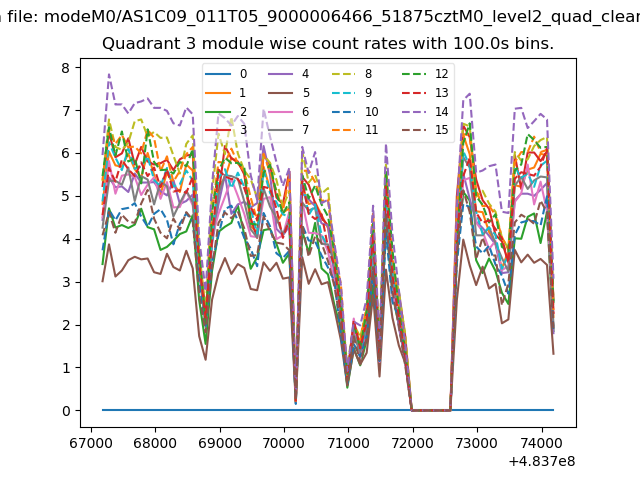
| Quadrant-wise count rates Data is divided into 100 sec bins |
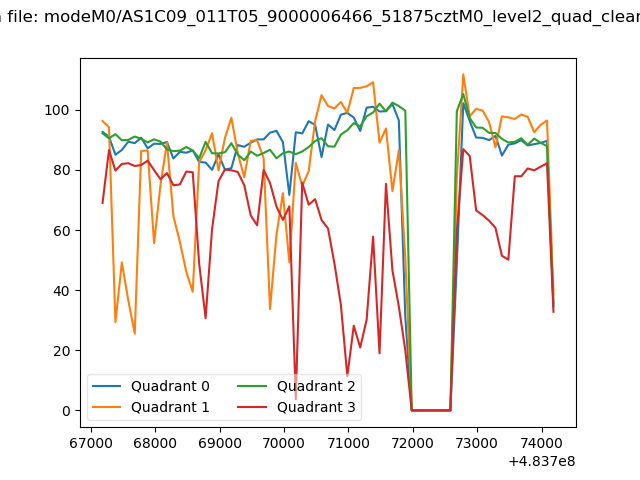 |
|
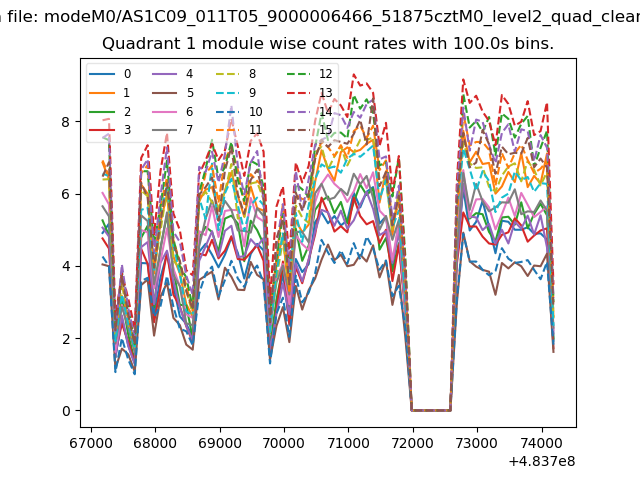
| Module-wise count rates for Quadrant A Data is divided into 100 sec bins |
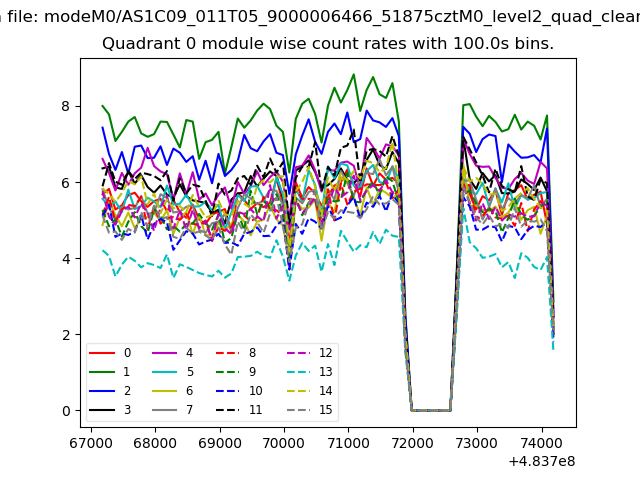 |
 |
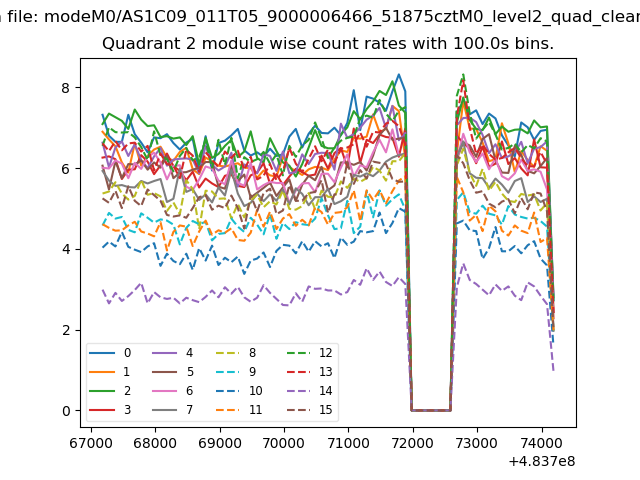
| Module-wise count rates for Quadrant B Data is divided into 100 sec bins |
 |
 |
| Module-wise count rates for Quadrant C Data is divided into 100 sec bins |
 |
 |
| Module-wise count rates for Quadrant D Data is divided into 100 sec bins |
 |
 |
| Parameter | Plot |
|---|---|
| CZT HV Monitor | 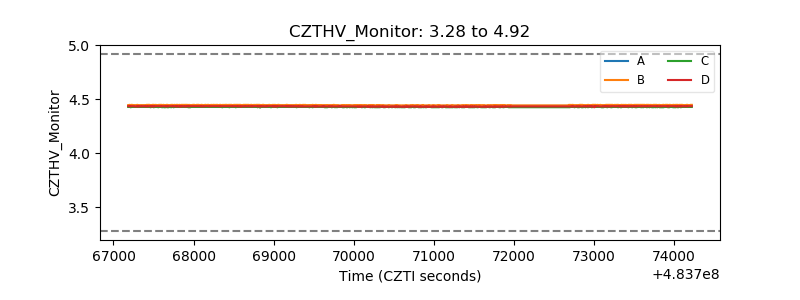 |
| D_VDD | 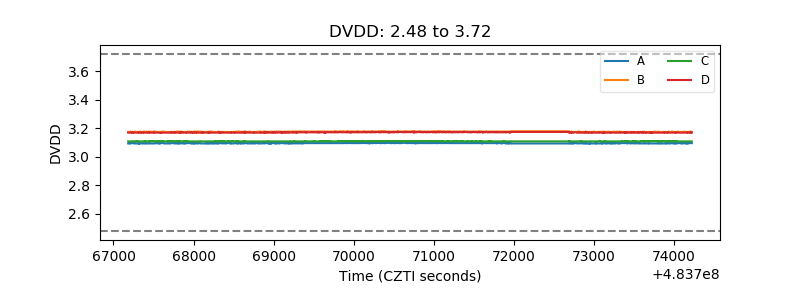 |
| Temperature 1 | 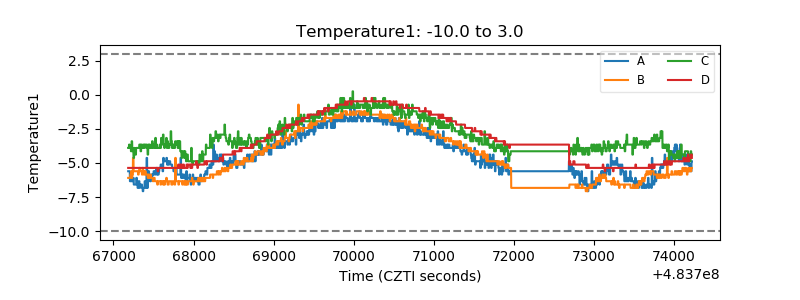 |
| Veto HV Monitor | 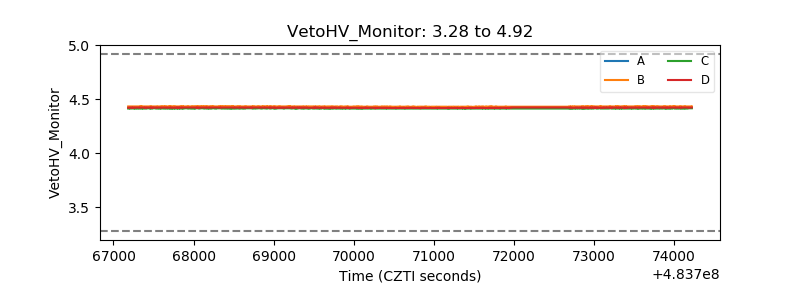 |
| Veto LLD | 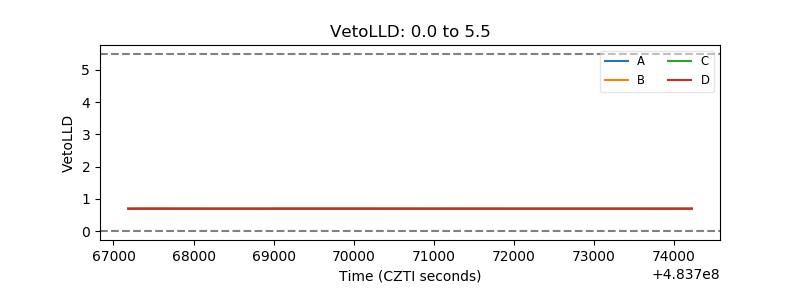 |
| Alpha Counter | 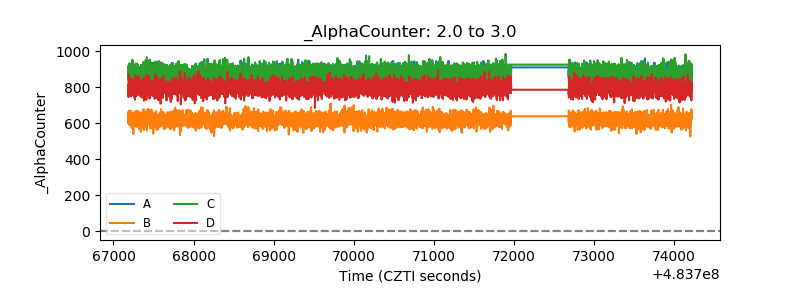 |
| _CPM_Rate | 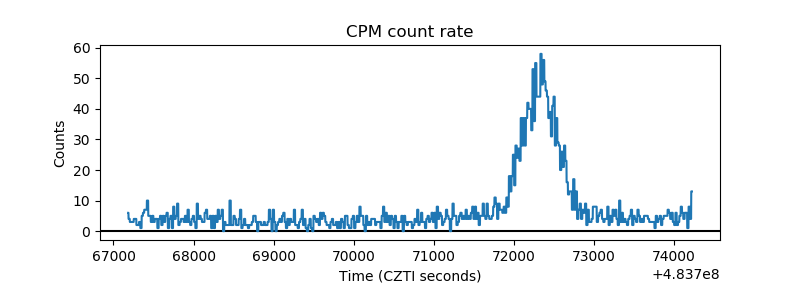 |
| CZT Counter | 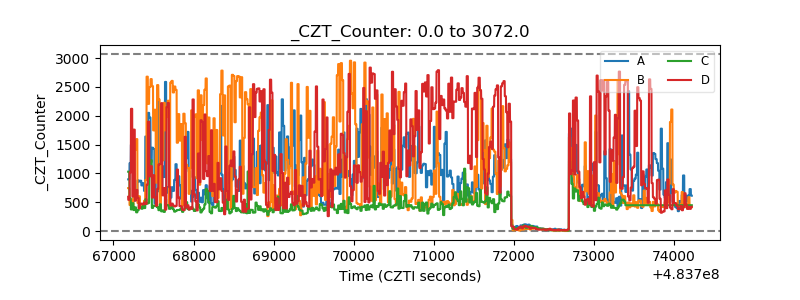 |
| +2.5 Volts monitor | 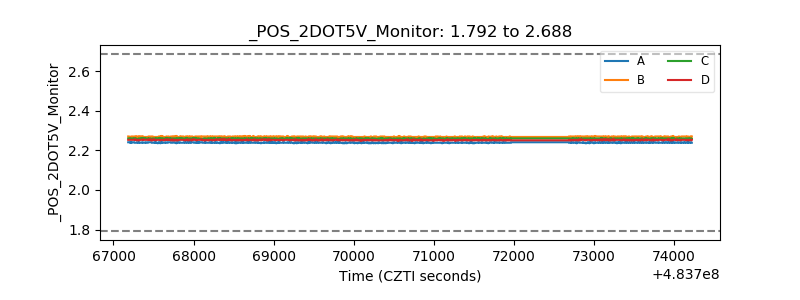 |
| +5 Volts monitor | 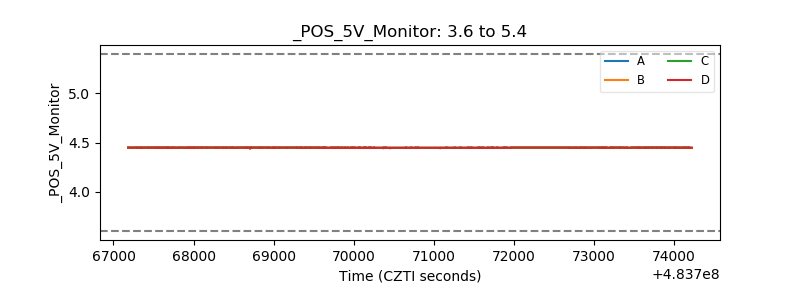 |
| _ROLL_ROT | 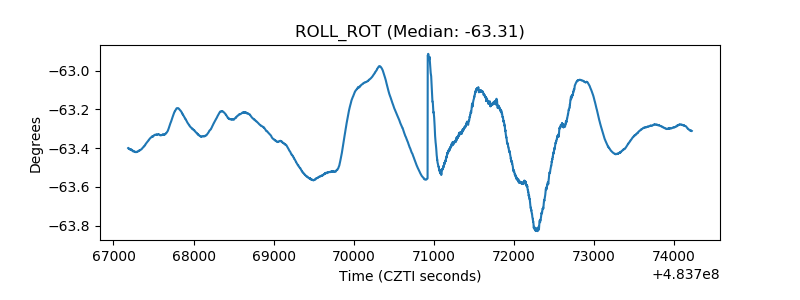 |
| _Roll_DEC | 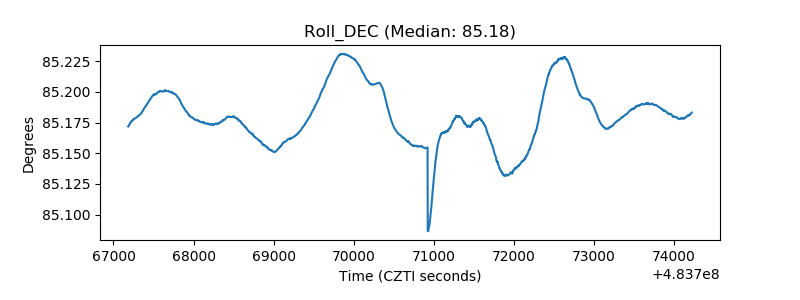 |
| _Roll_RA | 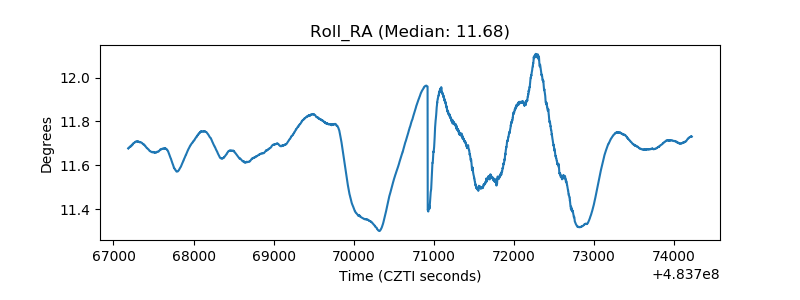 |
| Veto Counter | 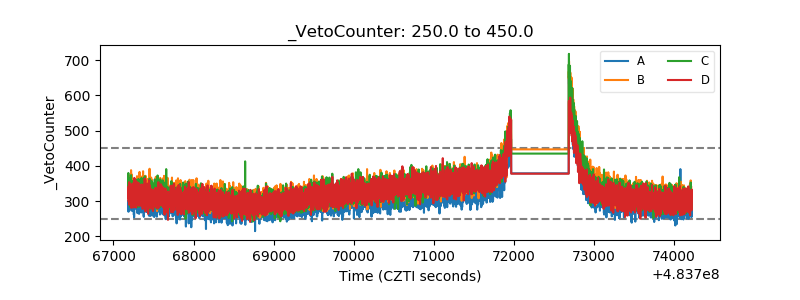 |