| Param | Original file | Final file |
|---|---|---|
| Filename | modeM0/AS1C09_011T05_9000006466_51876cztM0_level2.fits | modeM0/AS1C09_011T05_9000006466_51876cztM0_level2_quad_clean.evt |
| Size (bytes) | 751,887,360 | 91,517,760 |
| Size | 717.1 MB | 87.3 MB |
| Events in quadrant A | 6,692,873 | 607,553 |
| Events in quadrant B | 5,434,394 | 673,163 |
| Events in quadrant C | 3,768,435 | 627,318 |
| Events in quadrant D | 11,390,708 | 371,555 |
| Mode SS | |||
|---|---|---|---|
| Quadrant | BADHDUFLAG | Total packets | Discarded packets |
| A | 0 | 142 | 0 |
| B | 0 | 142 | 0 |
| C | 0 | 142 | 0 |
| D | 0 | 142 | 0 |
| Mode M0 | |||
|---|---|---|---|
| Quadrant | BADHDUFLAG | Total packets | Discarded packets |
| A | 0 | 24770 | 1 |
| B | 0 | 21087 | 1 |
| C | 0 | 16645 | 1 |
| D | 0 | 38712 | 1 |
| Mode M9 | |||
|---|---|---|---|
| Quadrant | BADHDUFLAG | Total packets | Discarded packets |
| A | 0 | 1 | 0 |
| B | 0 | 1 | 0 |
| C | 0 | 1 | 0 |
| D | 0 | 1 | 0 |
| Quadrant | Total seconds | Saturated seconds | Saturation percentage |
|---|---|---|---|
| A | 7052 | 672 | 9.529212% |
| B | 7053 | 537 | 7.613781% |
| C | 7053 | 179 | 2.537927% |
| D | 7053 | 2944 | 41.741103% |
Noise dominated data is calculated using 1-second bins in cleaned event files. If a bin has >2000 counts, and if more than 50% of those come from <1% of pixels, then it is considered to be noise-dominated and hence unusable.
| Quadrant | # 1 sec bins | Bins with >0 counts | Bins with >2000 counts | High rate bins dominated by noise | Noise dominated (total time) | Noise dominated (detector-on time) | Marked lightcurve |
|---|---|---|---|---|---|---|---|
| A | 7142 | 7053 | 416 | 416 | 5.82% | 5.90% | 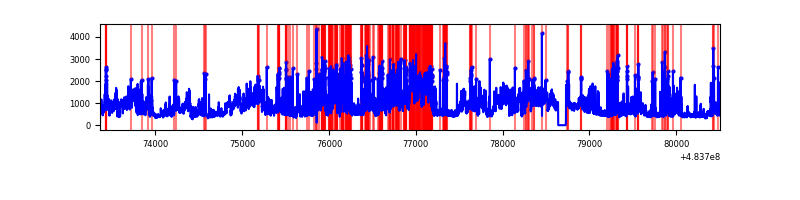 |
| B | 7143 | 7054 | 162 | 162 | 2.27% | 2.30% | 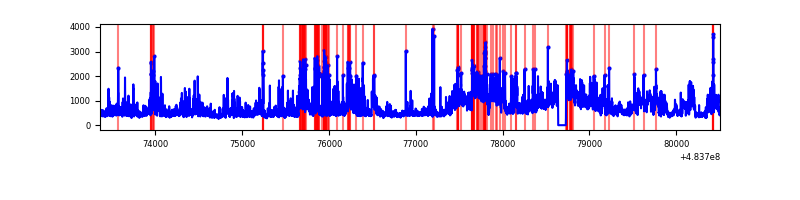 |
| C | 7143 | 7054 | 102 | 102 | 1.43% | 1.45% | 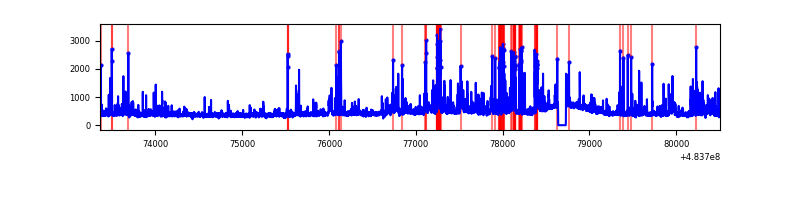 |
| D | 7143 | 7054 | 2569 | 2569 | 35.97% | 36.42% | 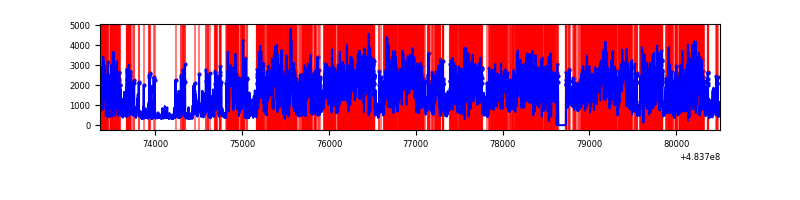 |
Top three noisy pixels from each quadrant. If the there are fewer than three noisy pixels in the level2.evt file, extra rows are filled as -1
| Pixel properties | Quadrant properties | ||||||
|---|---|---|---|---|---|---|---|
| Quadrant | DetID | PixID | Counts | Sigma | Mean | Median | Sigma |
| A | 4 | 175 | 1290405 | 7117.34 | 731 | 713 | 181.2 |
| A | 11 | 3 | 961556 | 5302.54 | 731 | 713 | 181.2 |
| A | 12 | 3 | 661078 | 3644.31 | 731 | 713 | 181.2 |
| B | 4 | 170 | 1508954 | 9549.34 | 730 | 702 | 157.9 |
| B | 1 | 255 | 202161 | 1275.51 | 730 | 702 | 157.9 |
| B | 12 | 32 | 142235 | 896.1 | 730 | 702 | 157.9 |
| C | 15 | 178 | 340627 | 1719.77 | 719 | 713 | 197.7 |
| C | 15 | 192 | 193713 | 976.47 | 719 | 713 | 197.7 |
| C | 13 | 3 | 122982 | 618.61 | 719 | 713 | 197.7 |
| D | 11 | 129 | 6427226 | 39527.95 | 582 | 559 | 162.6 |
| D | 6 | 42 | 1516208 | 9322.17 | 582 | 559 | 162.6 |
| D | 8 | 176 | 541852 | 3329.28 | 582 | 559 | 162.6 |
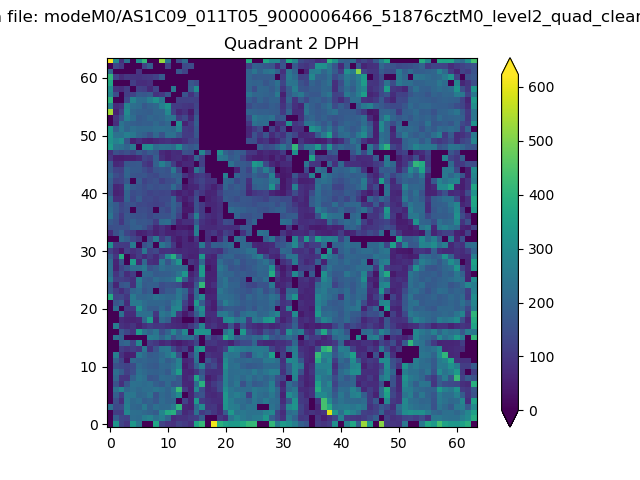
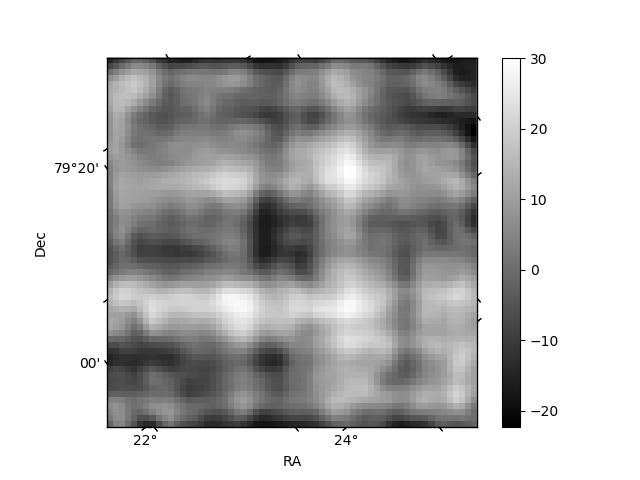
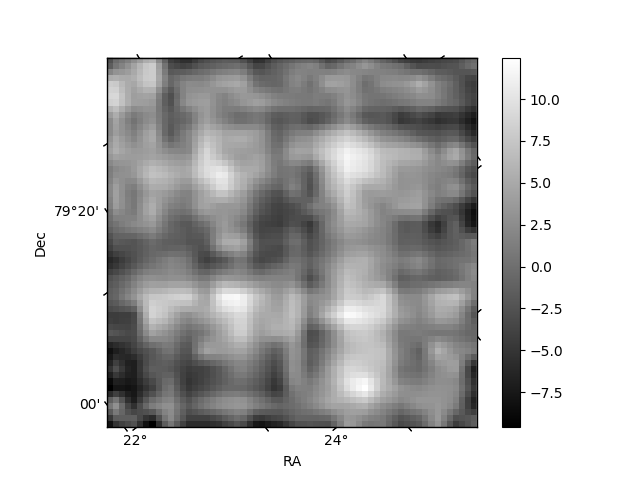
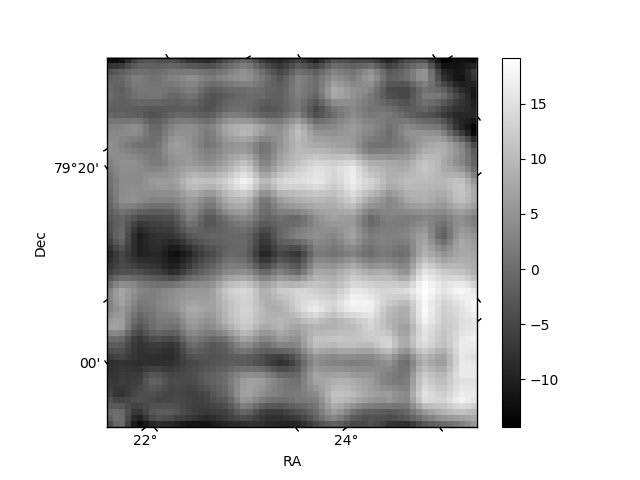
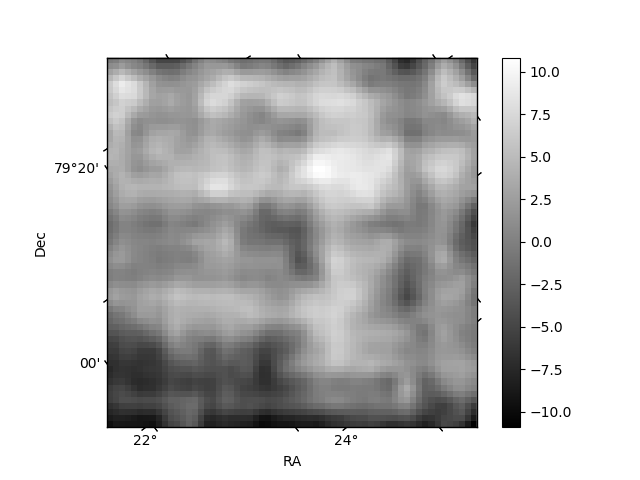
Histogram calculated using DETX and DETY for each event in the final _common_clean file
| Quadrant A | 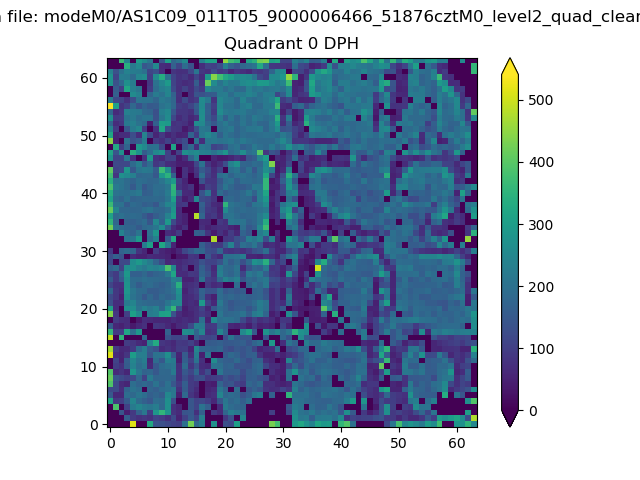 |
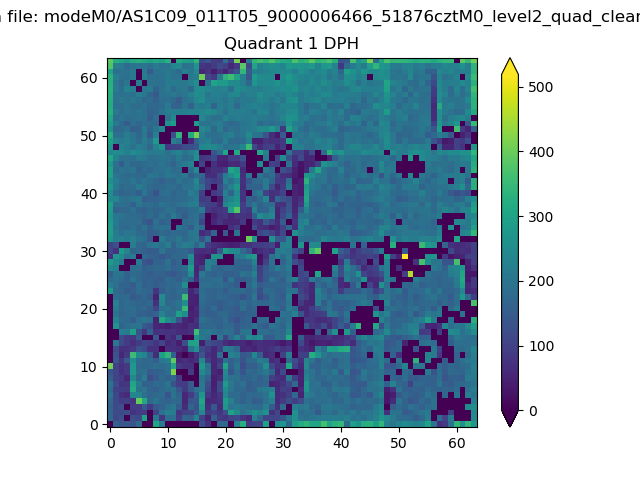 |
Quadrant B |
|---|---|---|---|
| Quadrant D | 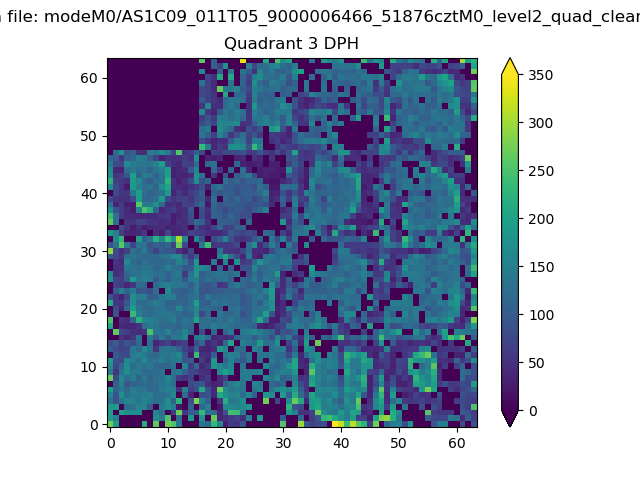 |
 |
Quadrant C |
| Plot type | Count rate plots | Images |
|---|---|---|
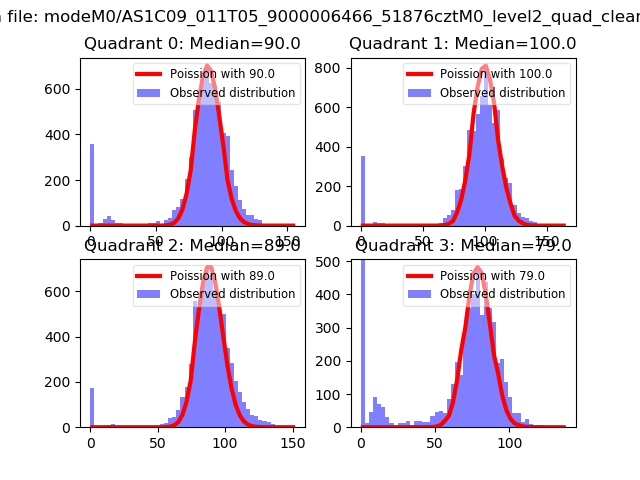
| Comparison with Poisson distribution Blue bars denote a histogram of data divided into 1 sec bins. Red curve is a Poisson curve with rate = median count rate of data. |
 |
 |
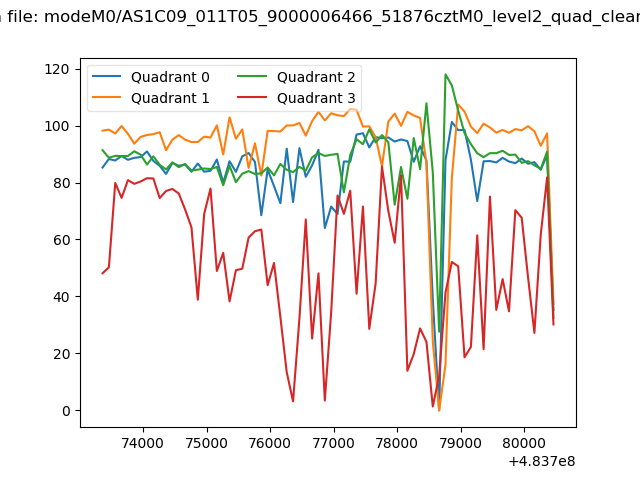
| Quadrant-wise count rates Data is divided into 100 sec bins |
 |
|
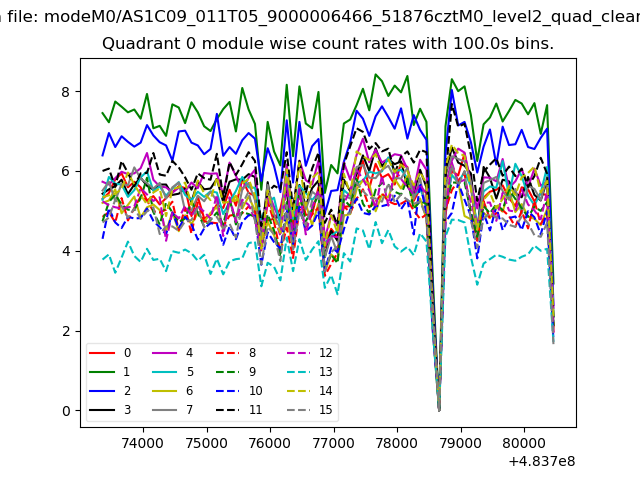
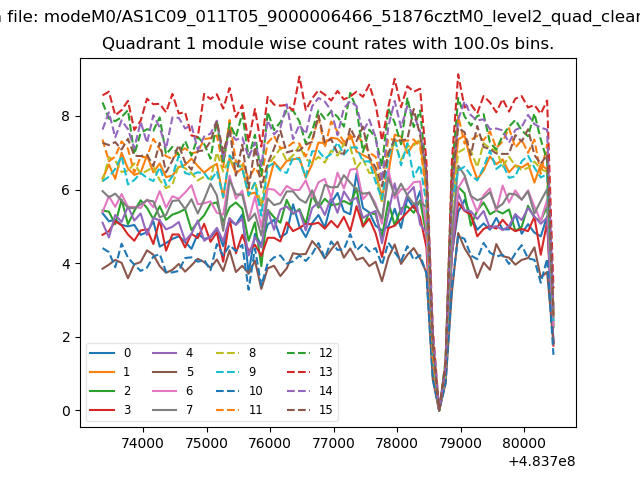
| Module-wise count rates for Quadrant A Data is divided into 100 sec bins |
 |
 |
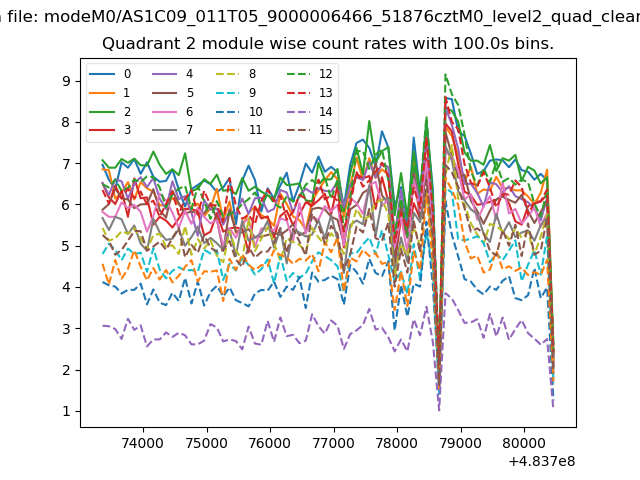
| Module-wise count rates for Quadrant B Data is divided into 100 sec bins |
 |
 |
| Module-wise count rates for Quadrant C Data is divided into 100 sec bins |
 |
 |
| Module-wise count rates for Quadrant D Data is divided into 100 sec bins |
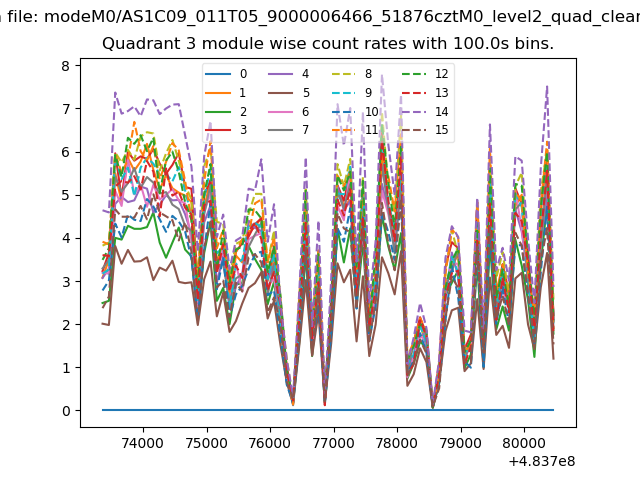 |
 |
| Parameter | Plot |
|---|---|
| CZT HV Monitor | 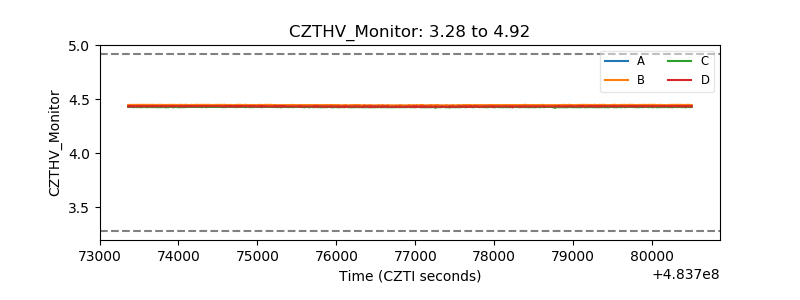 |
| D_VDD | 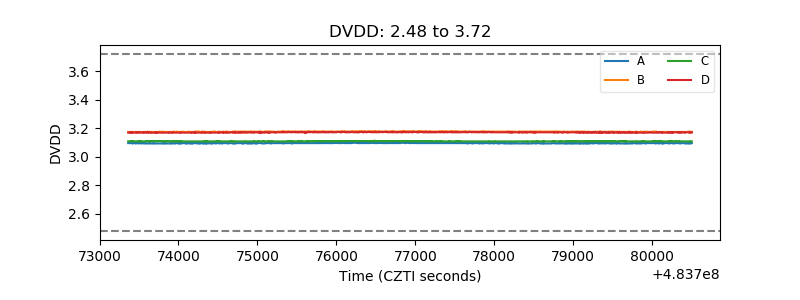 |
| Temperature 1 | 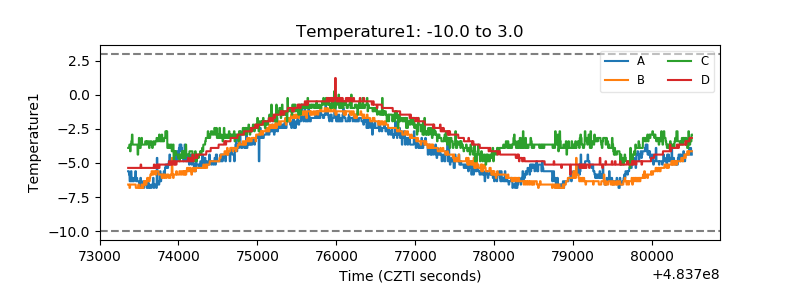 |
| Veto HV Monitor | 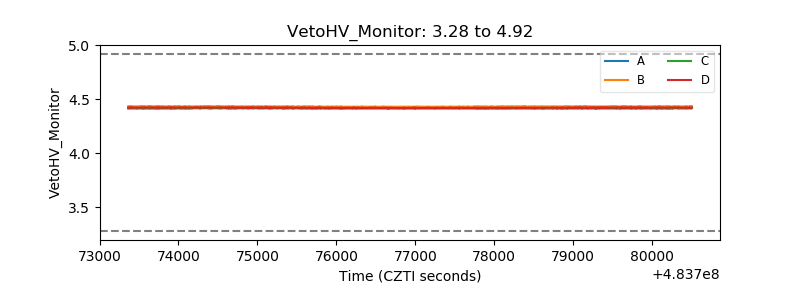 |
| Veto LLD | 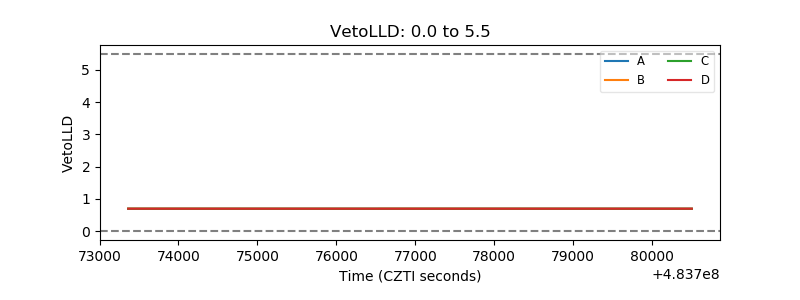 |
| Alpha Counter | 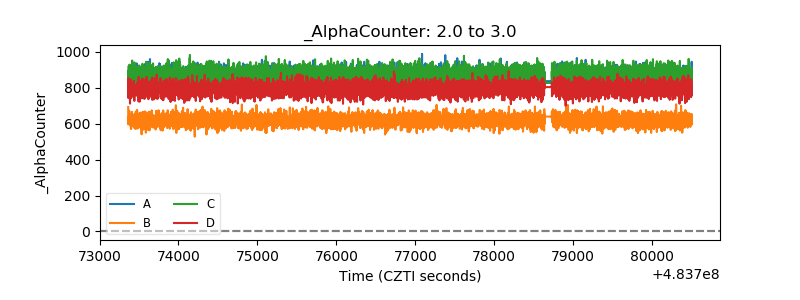 |
| _CPM_Rate | 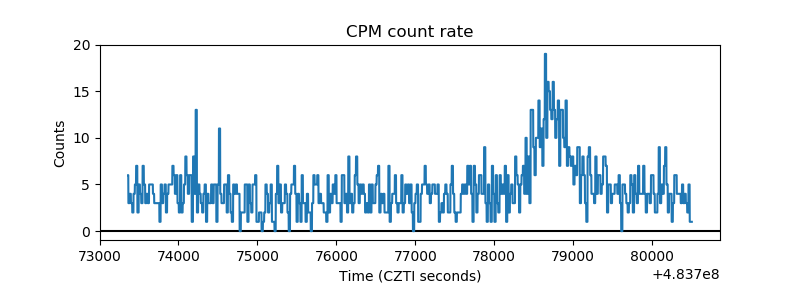 |
| CZT Counter | 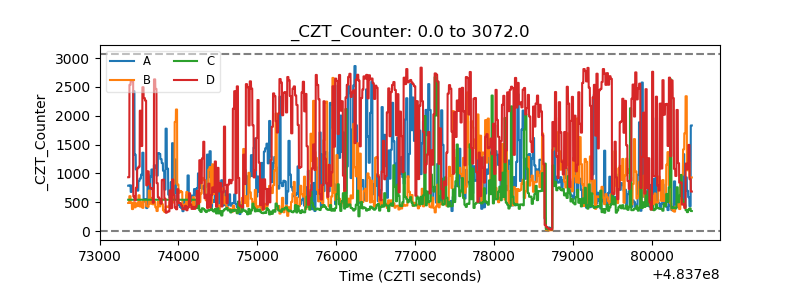 |
| +2.5 Volts monitor | 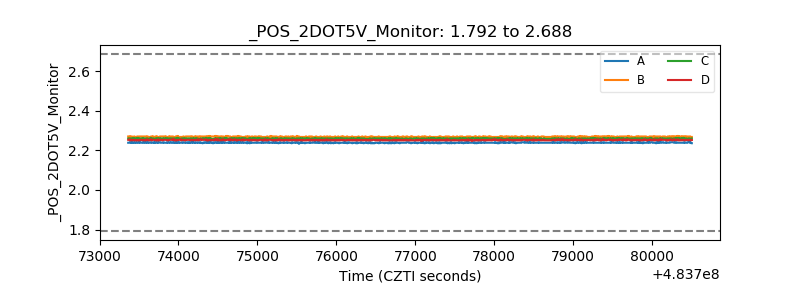 |
| +5 Volts monitor |  |
| _ROLL_ROT | 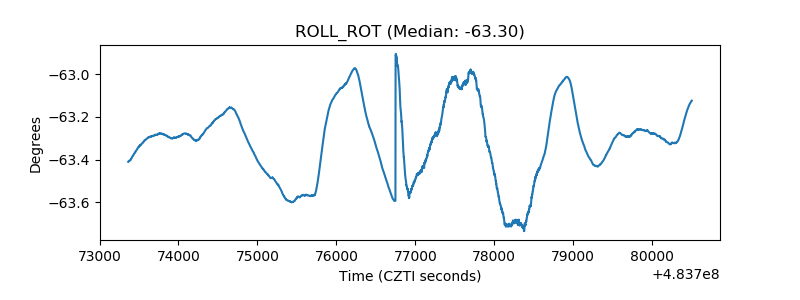 |
| _Roll_DEC | 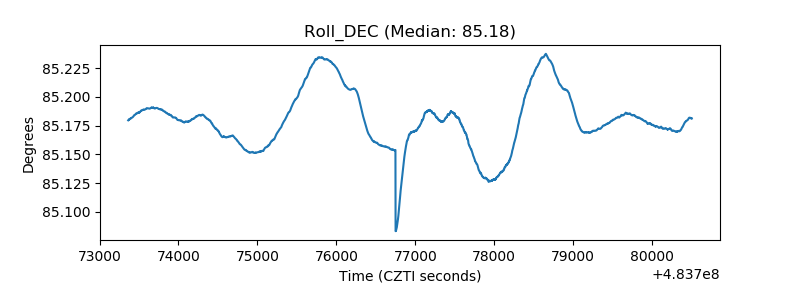 |
| _Roll_RA | 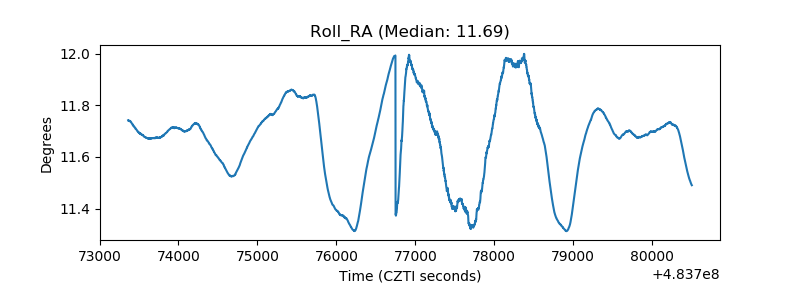 |
| Veto Counter | 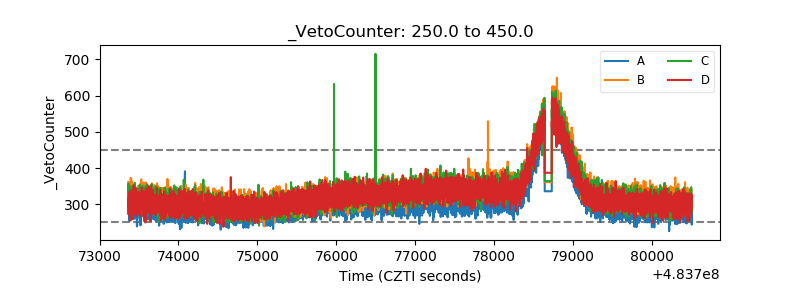 |