| Param | Original file | Final file |
|---|---|---|
| Filename | modeM0/AS1C09_011T05_9000006466_51877cztM0_level2.fits | modeM0/AS1C09_011T05_9000006466_51877cztM0_level2_quad_clean.evt |
| Size (bytes) | 3,009,228,480 | 363,954,240 |
| Size | 2.8 GB | 347.1 MB |
| Events in quadrant A | 26,947,525 | 2,505,753 |
| Events in quadrant B | 24,012,611 | 2,668,459 |
| Events in quadrant C | 15,817,807 | 2,537,782 |
| Events in quadrant D | 42,445,998 | 1,370,187 |
| Mode SS | |||
|---|---|---|---|
| Quadrant | BADHDUFLAG | Total packets | Discarded packets |
| A | 0 | 570 | 0 |
| B | 0 | 570 | 0 |
| C | 0 | 570 | 0 |
| D | 0 | 570 | 0 |
| Mode M0 | |||
|---|---|---|---|
| Quadrant | BADHDUFLAG | Total packets | Discarded packets |
| A | 0 | 99793 | 4 |
| B | 0 | 90955 | 4 |
| C | 0 | 67719 | 4 |
| D | 0 | 145669 | 4 |
| Mode M9 | |||
|---|---|---|---|
| Quadrant | BADHDUFLAG | Total packets | Discarded packets |
| A | 0 | 31 | 0 |
| B | 0 | 31 | 0 |
| C | 0 | 31 | 0 |
| D | 0 | 31 | 0 |
| Quadrant | Total seconds | Saturated seconds | Saturation percentage |
|---|---|---|---|
| A | 28158 | 1935 | 6.871937% |
| B | 28159 | 2897 | 10.288007% |
| C | 28159 | 544 | 1.931887% |
| D | 28159 | 10833 | 38.470826% |
Noise dominated data is calculated using 1-second bins in cleaned event files. If a bin has >2000 counts, and if more than 50% of those come from <1% of pixels, then it is considered to be noise-dominated and hence unusable.
| Quadrant | # 1 sec bins | Bins with >0 counts | Bins with >2000 counts | High rate bins dominated by noise | Noise dominated (total time) | Noise dominated (detector-on time) | Marked lightcurve |
|---|---|---|---|---|---|---|---|
| A | 31178 | 28158 | 1182 | 1182 | 3.79% | 4.20% | 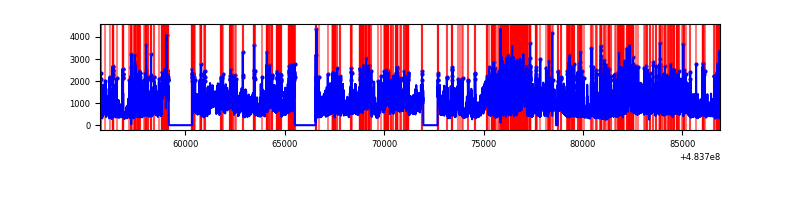 |
| B | 31179 | 28159 | 1883 | 1883 | 6.04% | 6.69% | 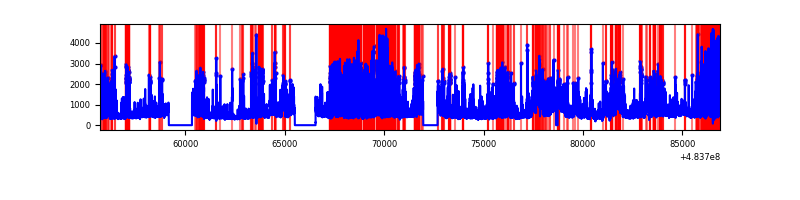 |
| C | 31179 | 28159 | 334 | 334 | 1.07% | 1.19% | 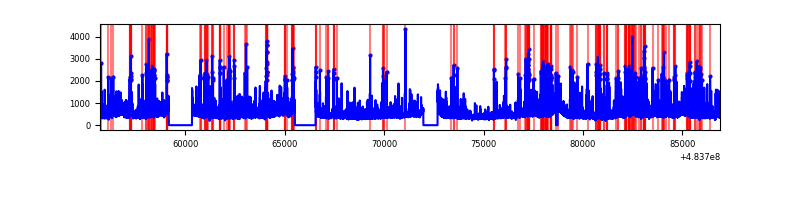 |
| D | 31179 | 28158 | 9412 | 9412 | 30.19% | 33.43% | 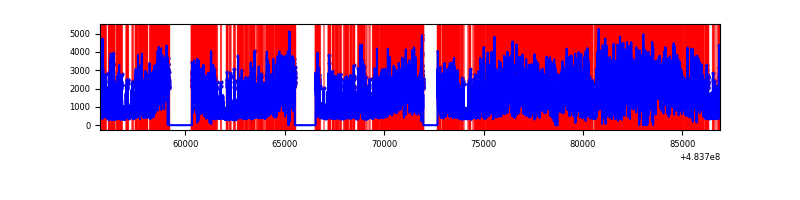 |
Top three noisy pixels from each quadrant. If the there are fewer than three noisy pixels in the level2.evt file, extra rows are filled as -1
| Pixel properties | Quadrant properties | ||||||
|---|---|---|---|---|---|---|---|
| Quadrant | DetID | PixID | Counts | Sigma | Mean | Median | Sigma |
| A | 12 | 3 | 5398988 | 7460.16 | 2905 | 2825 | 723.3 |
| A | 4 | 175 | 3703834 | 5116.62 | 2905 | 2825 | 723.3 |
| A | 11 | 3 | 1715764 | 2368.13 | 2905 | 2825 | 723.3 |
| B | 4 | 170 | 6848350 | 11452.27 | 2844 | 2743 | 597.8 |
| B | 12 | 32 | 1307389 | 2182.59 | 2844 | 2743 | 597.8 |
| B | 10 | 44 | 586590 | 976.74 | 2844 | 2743 | 597.8 |
| C | 15 | 192 | 860299 | 1093.82 | 2850 | 2818 | 783.9 |
| C | 13 | 3 | 838909 | 1066.53 | 2850 | 2818 | 783.9 |
| C | 15 | 178 | 705788 | 896.72 | 2850 | 2818 | 783.9 |
| D | 11 | 129 | 24438200 | 39033.57 | 2252 | 2167 | 626.0 |
| D | 6 | 42 | 3579947 | 5715.07 | 2252 | 2167 | 626.0 |
| D | 8 | 176 | 2355547 | 3759.24 | 2252 | 2167 | 626.0 |
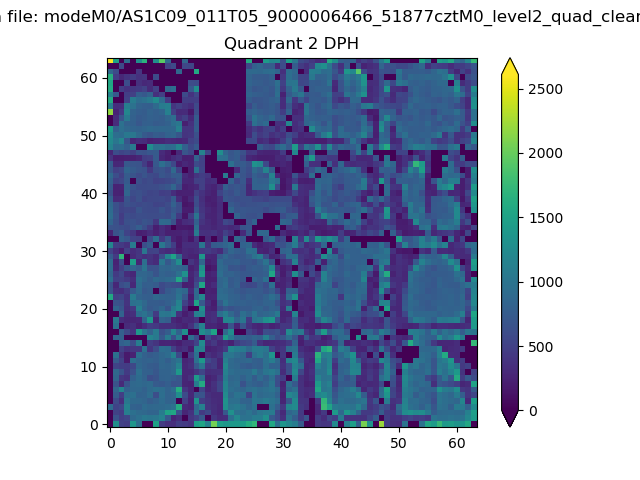
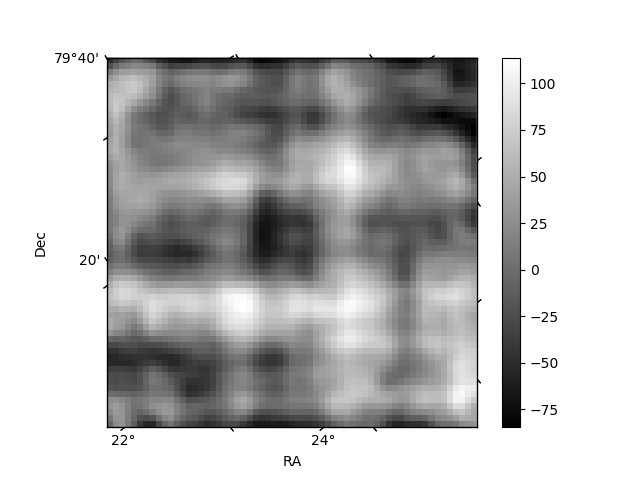
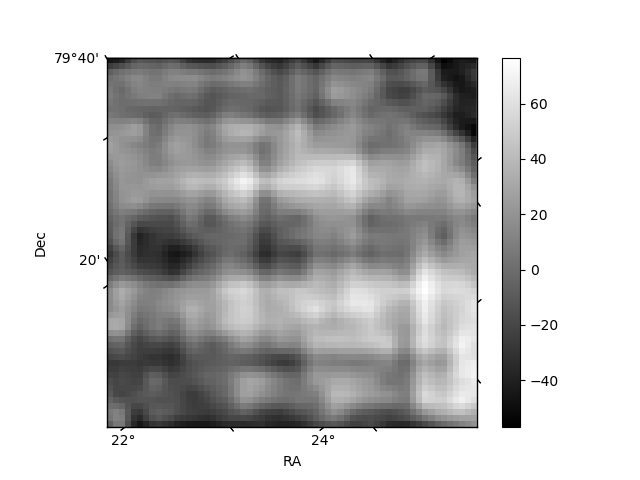
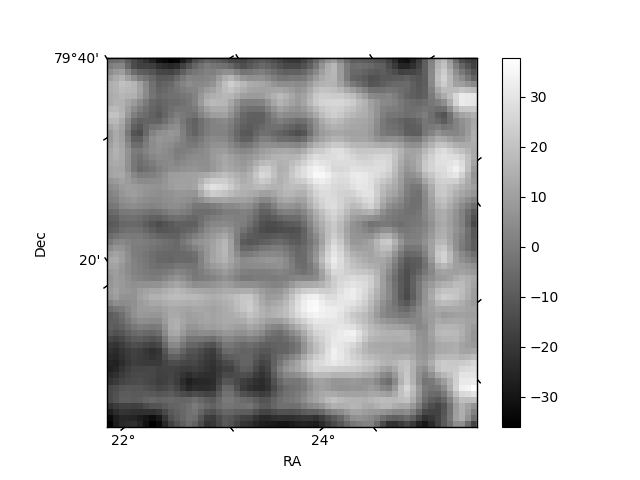
Histogram calculated using DETX and DETY for each event in the final _common_clean file
| Quadrant A | 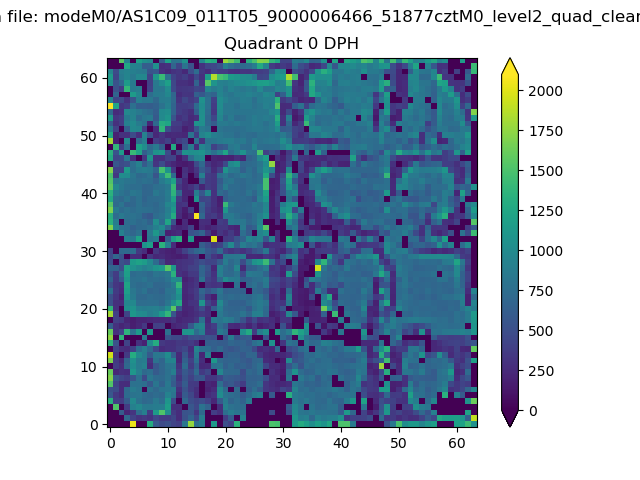 |
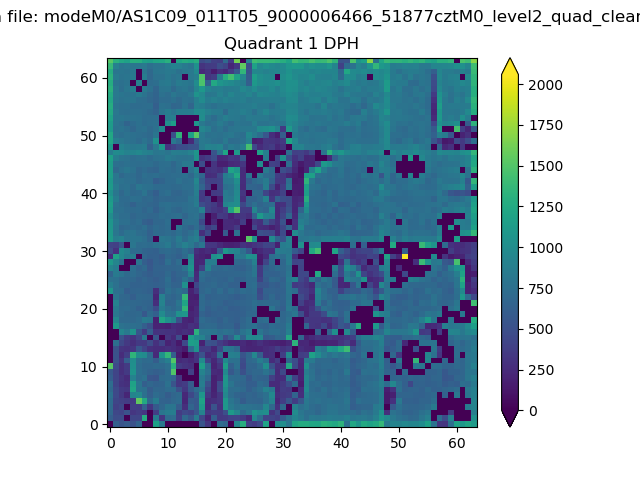 |
Quadrant B |
|---|---|---|---|
| Quadrant D | 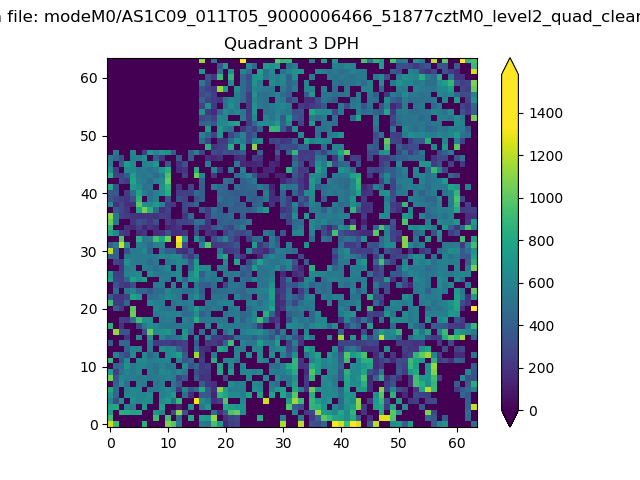 |
 |
Quadrant C |
| Plot type | Count rate plots | Images |
|---|---|---|
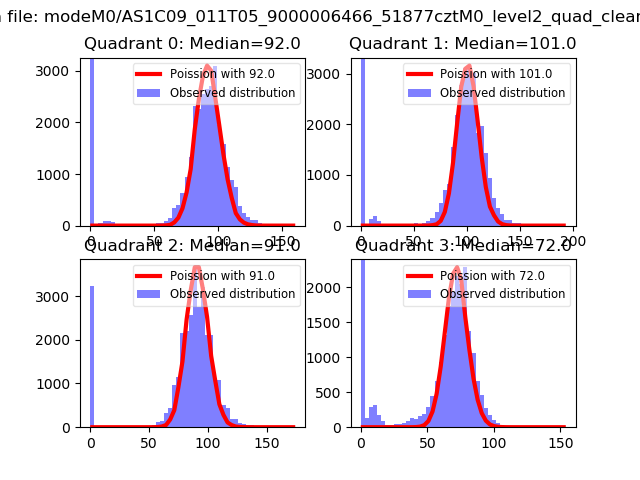
| Comparison with Poisson distribution Blue bars denote a histogram of data divided into 1 sec bins. Red curve is a Poisson curve with rate = median count rate of data. |
 |
 |
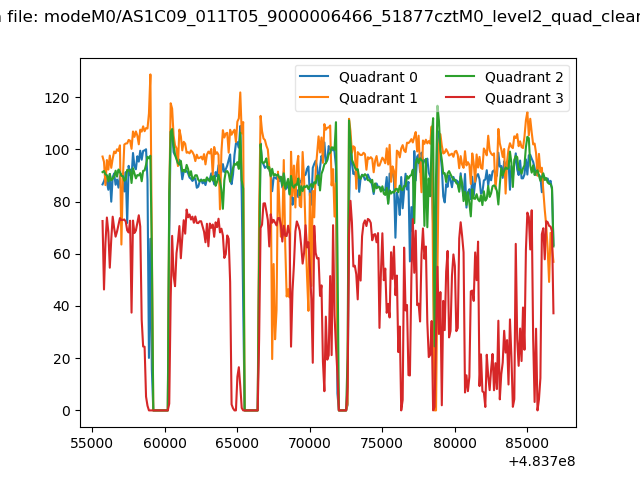
| Quadrant-wise count rates Data is divided into 100 sec bins |
 |
|
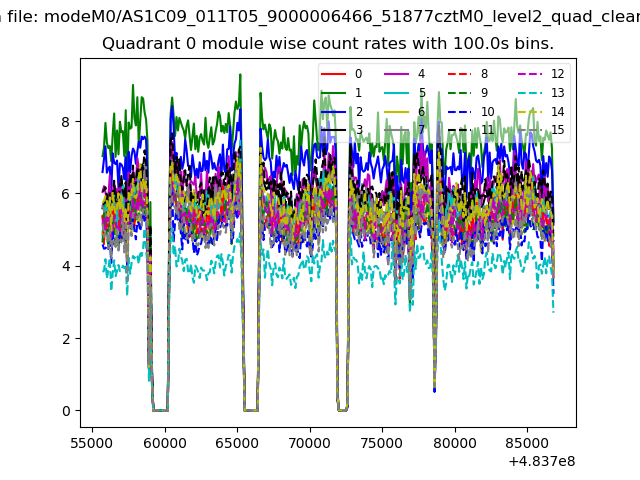
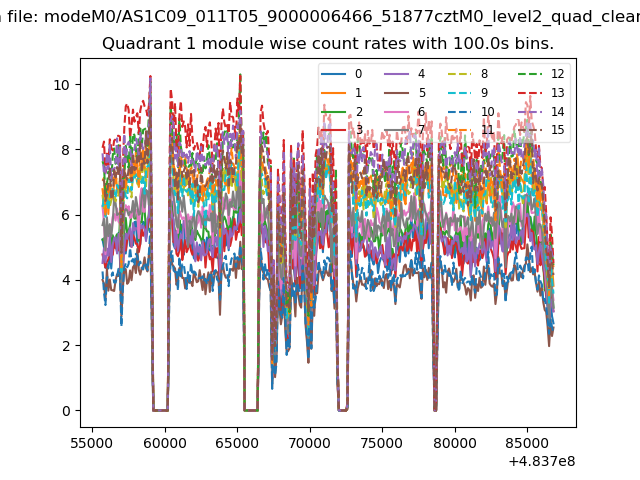
| Module-wise count rates for Quadrant A Data is divided into 100 sec bins |
 |
 |
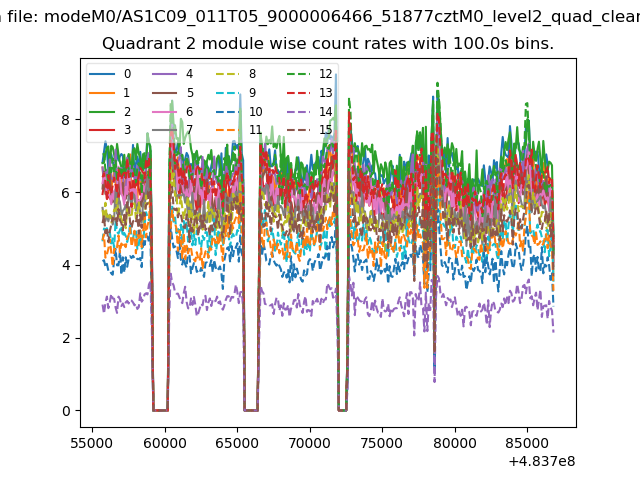
| Module-wise count rates for Quadrant B Data is divided into 100 sec bins |
 |
 |
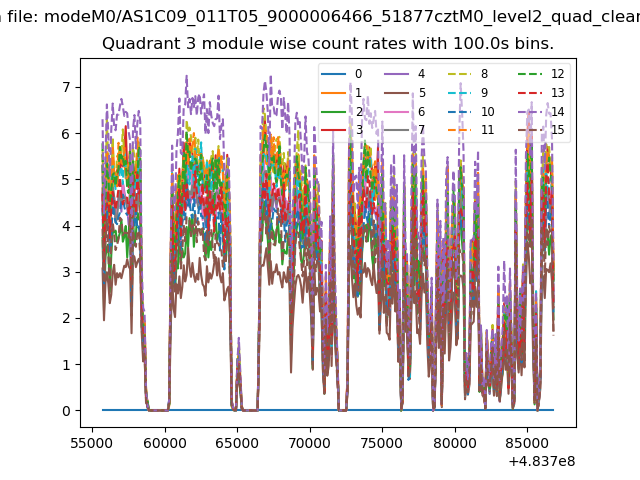
| Module-wise count rates for Quadrant C Data is divided into 100 sec bins |
 |
 |
| Module-wise count rates for Quadrant D Data is divided into 100 sec bins |
 |
 |
| Parameter | Plot |
|---|---|
| CZT HV Monitor | 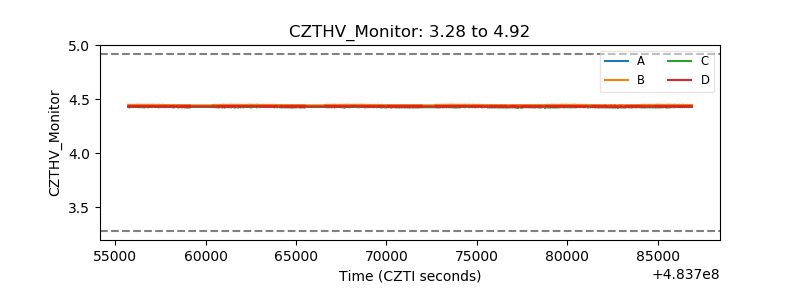 |
| D_VDD | 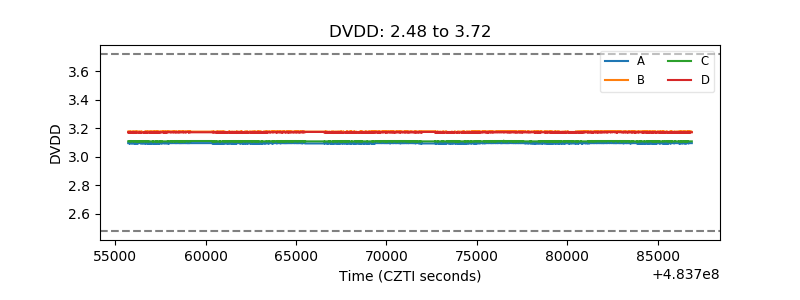 |
| Temperature 1 | 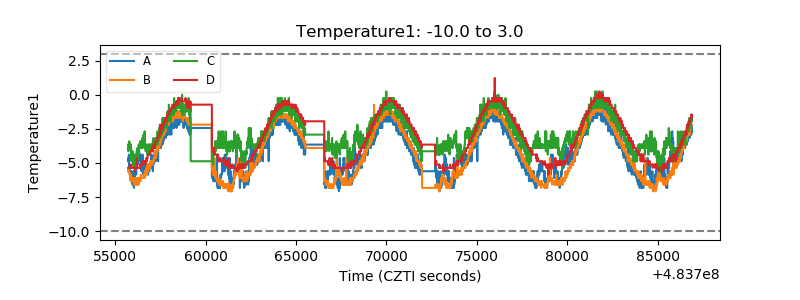 |
| Veto HV Monitor | 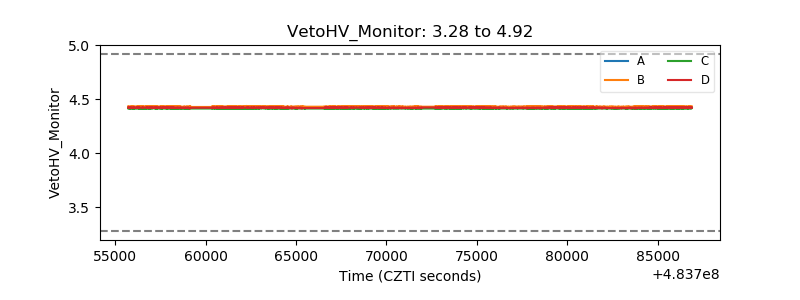 |
| Veto LLD | 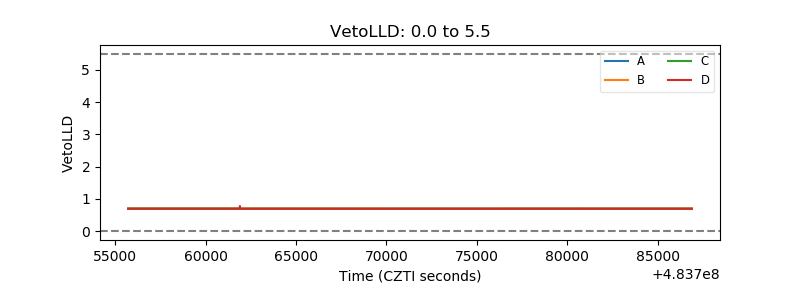 |
| Alpha Counter | 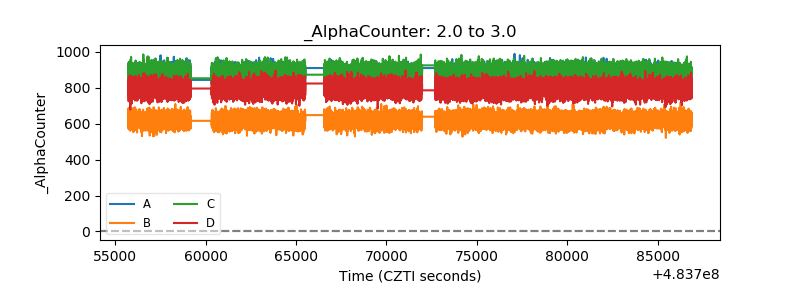 |
| _CPM_Rate | 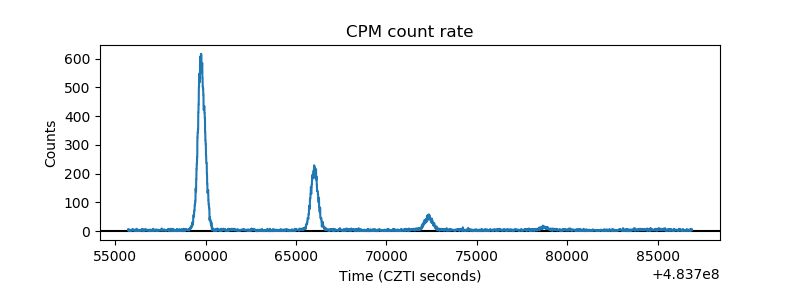 |
| CZT Counter | 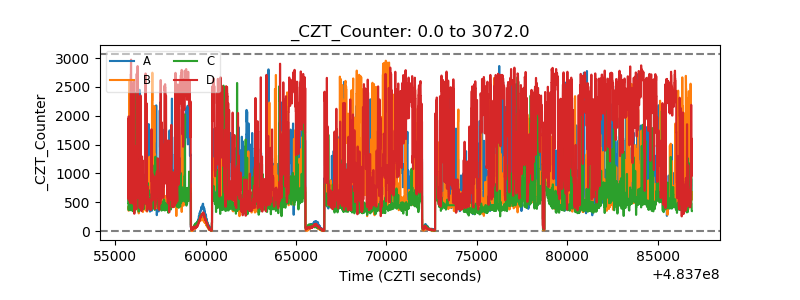 |
| +2.5 Volts monitor | 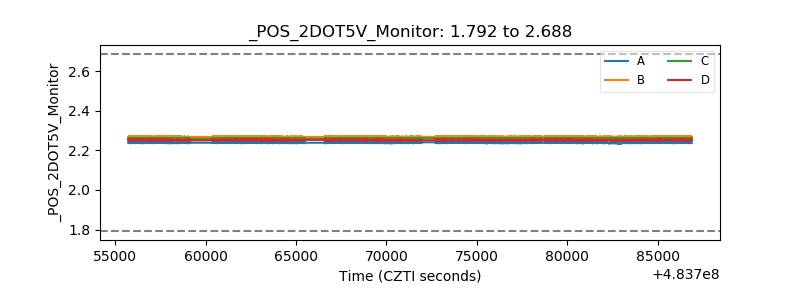 |
| +5 Volts monitor | 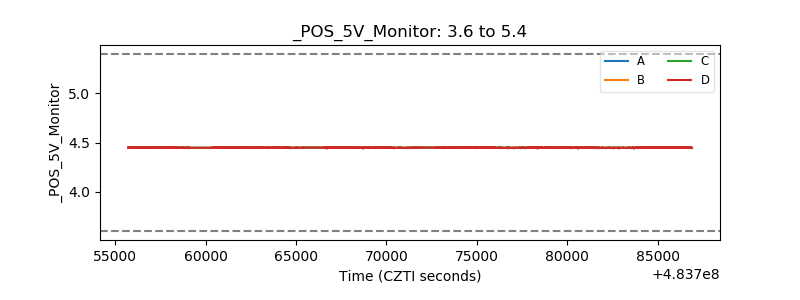 |
| _ROLL_ROT | 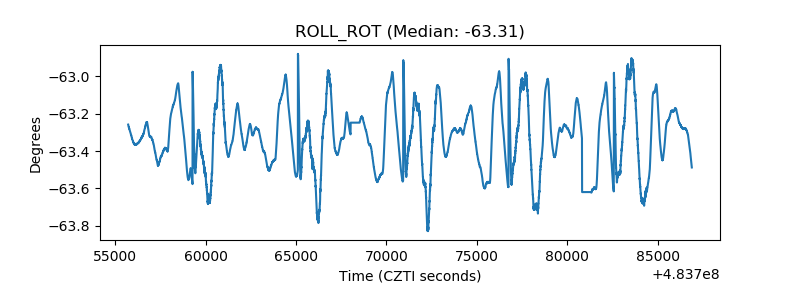 |
| _Roll_DEC | 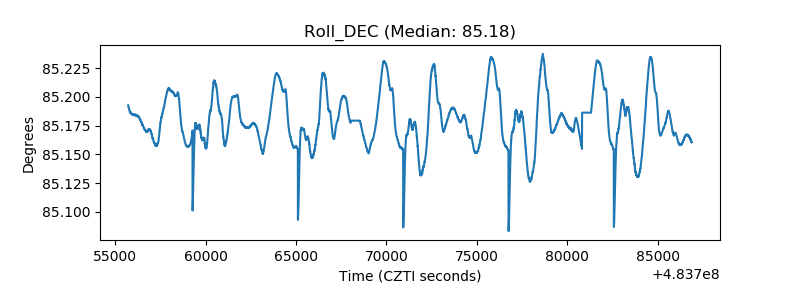 |
| _Roll_RA | 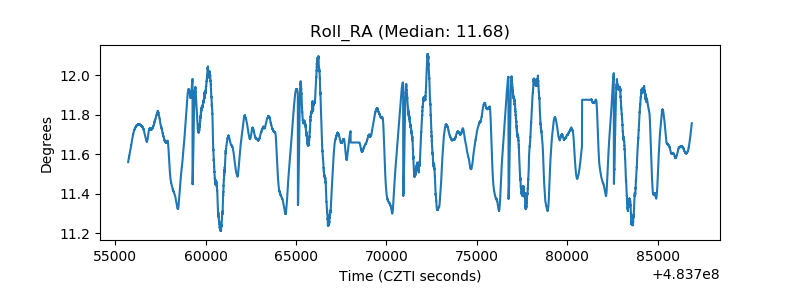 |
| Veto Counter | 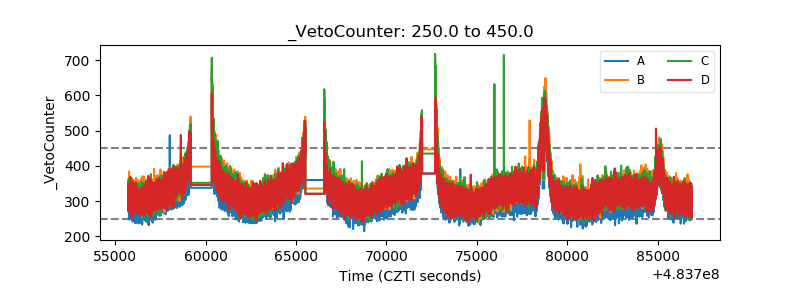 |