| Param | Original file | Final file |
|---|---|---|
| Filename | modeM0/AS1C09_011T05_9000006466_51878cztM0_level2.fits | modeM0/AS1C09_011T05_9000006466_51878cztM0_level2_quad_clean.evt |
| Size (bytes) | 761,650,560 | 94,593,600 |
| Size | 726.4 MB | 90.2 MB |
| Events in quadrant A | 5,930,787 | 646,898 |
| Events in quadrant B | 5,669,141 | 680,021 |
| Events in quadrant C | 5,112,923 | 621,715 |
| Events in quadrant D | 10,922,901 | 412,900 |
| Mode SS | |||
|---|---|---|---|
| Quadrant | BADHDUFLAG | Total packets | Discarded packets |
| A | 0 | 144 | 0 |
| B | 0 | 144 | 0 |
| C | 0 | 144 | 0 |
| D | 0 | 144 | 0 |
| Mode M0 | |||
|---|---|---|---|
| Quadrant | BADHDUFLAG | Total packets | Discarded packets |
| A | 0 | 22626 | 0 |
| B | 0 | 21813 | 0 |
| C | 0 | 20272 | 0 |
| D | 0 | 37449 | 0 |
| Quadrant | Total seconds | Saturated seconds | Saturation percentage |
|---|---|---|---|
| A | 7214 | 246 | 3.410036% |
| B | 7215 | 627 | 8.690229% |
| C | 7215 | 314 | 4.352044% |
| D | 7215 | 2586 | 35.841996% |
Noise dominated data is calculated using 1-second bins in cleaned event files. If a bin has >2000 counts, and if more than 50% of those come from <1% of pixels, then it is considered to be noise-dominated and hence unusable.
| Quadrant | # 1 sec bins | Bins with >0 counts | Bins with >2000 counts | High rate bins dominated by noise | Noise dominated (total time) | Noise dominated (detector-on time) | Marked lightcurve |
|---|---|---|---|---|---|---|---|
| A | 7214 | 7214 | 194 | 194 | 2.69% | 2.69% | 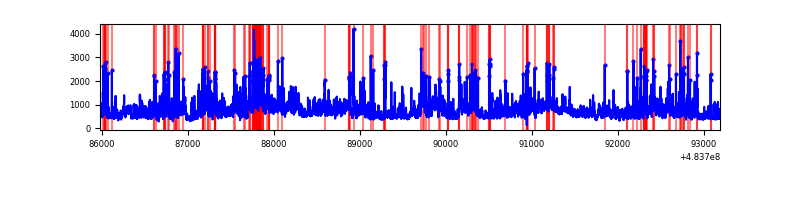 |
| B | 7215 | 7215 | 407 | 407 | 5.64% | 5.64% | 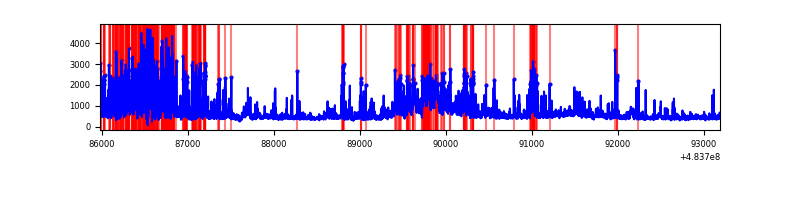 |
| C | 7215 | 7215 | 256 | 256 | 3.55% | 3.55% | 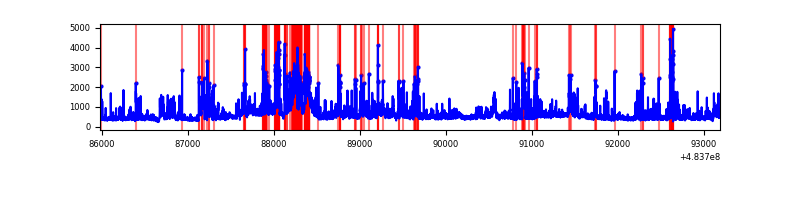 |
| D | 7215 | 7214 | 2233 | 2233 | 30.95% | 30.95% | 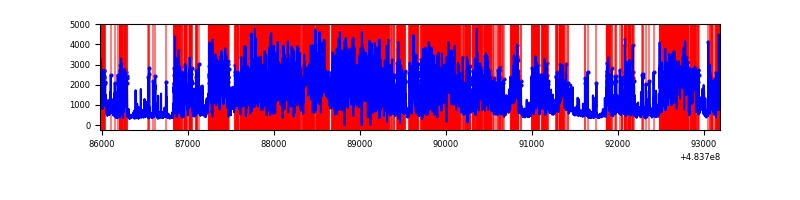 |
Top three noisy pixels from each quadrant. If the there are fewer than three noisy pixels in the level2.evt file, extra rows are filled as -1
| Pixel properties | Quadrant properties | ||||||
|---|---|---|---|---|---|---|---|
| Quadrant | DetID | PixID | Counts | Sigma | Mean | Median | Sigma |
| A | 4 | 175 | 1441484 | 7794.4 | 745 | 728 | 184.8 |
| A | 11 | 3 | 430004 | 2322.36 | 745 | 728 | 184.8 |
| A | 4 | 3 | 201113 | 1084.07 | 745 | 728 | 184.8 |
| B | 12 | 32 | 1380547 | 8901.84 | 725 | 699 | 155.0 |
| B | 10 | 44 | 482743 | 3109.82 | 725 | 699 | 155.0 |
| B | 4 | 170 | 128589 | 825.06 | 725 | 699 | 155.0 |
| C | 15 | 192 | 369775 | 1880.35 | 716 | 711 | 196.3 |
| C | 1 | 60 | 362383 | 1842.69 | 716 | 711 | 196.3 |
| C | 14 | 254 | 257363 | 1307.62 | 716 | 711 | 196.3 |
| D | 11 | 129 | 4484914 | 26347.02 | 604 | 581 | 170.2 |
| D | 6 | 42 | 1288207 | 7565.25 | 604 | 581 | 170.2 |
| D | 0 | 5 | 780166 | 4580.33 | 604 | 581 | 170.2 |
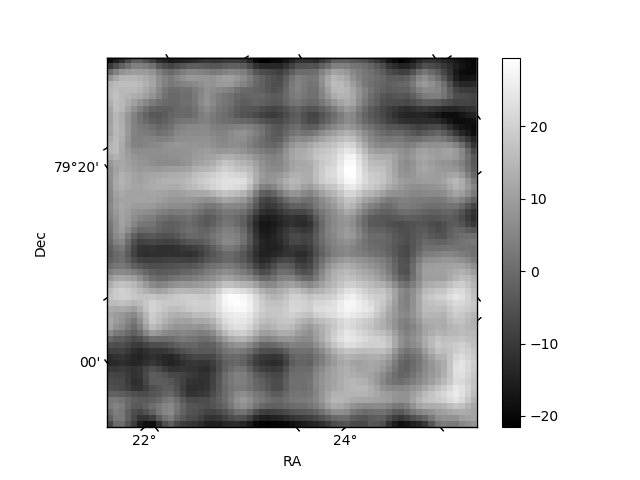
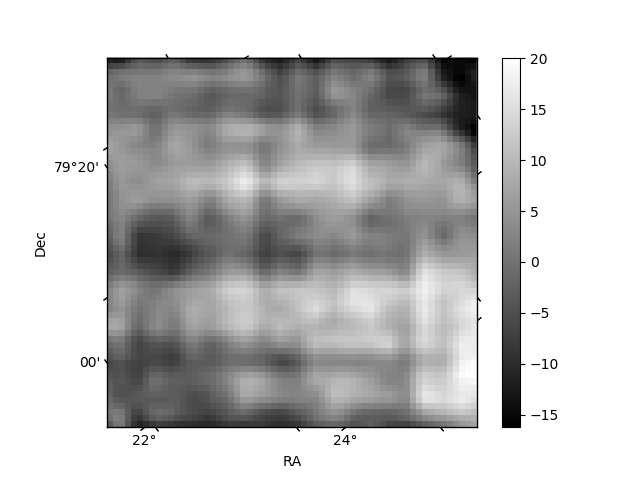
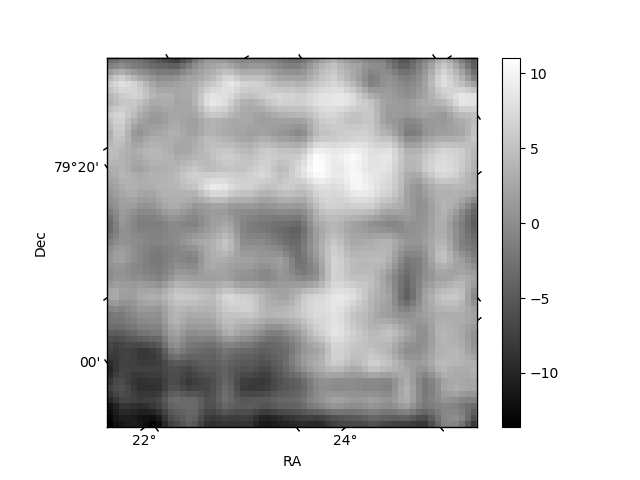
Histogram calculated using DETX and DETY for each event in the final _common_clean file
| Quadrant A | 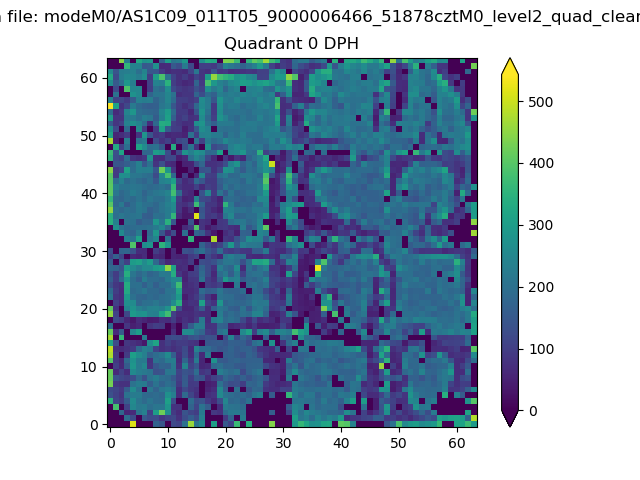 |
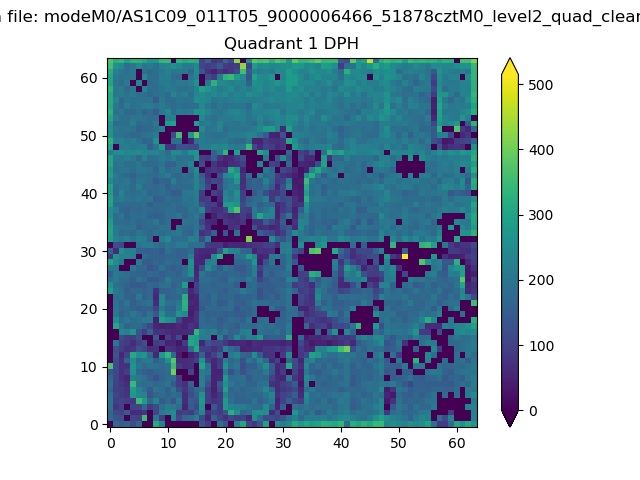 |
Quadrant B |
|---|---|---|---|
| Quadrant D | 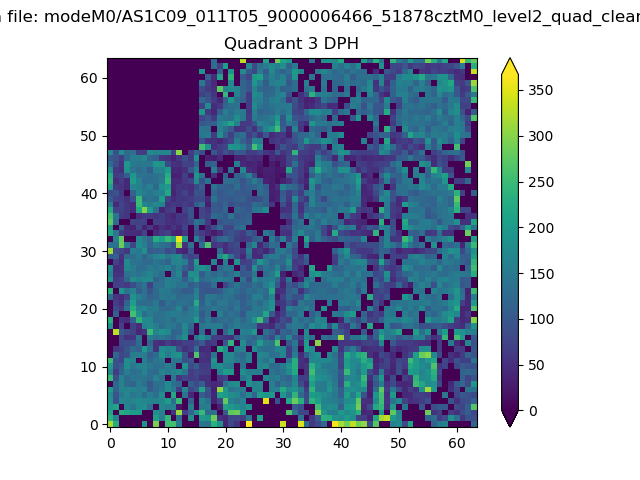 |
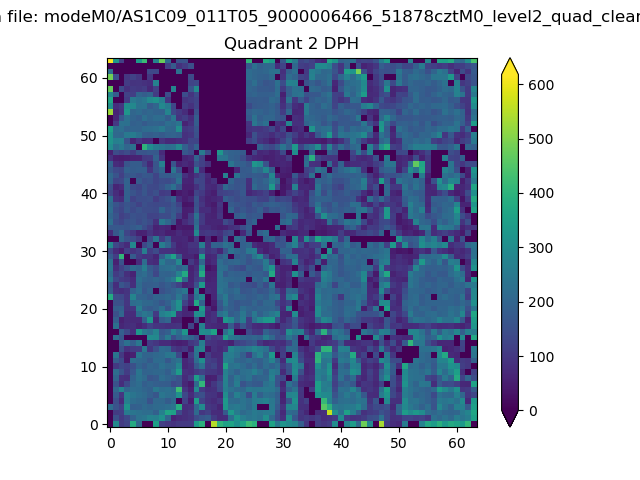 |
Quadrant C |
| Plot type | Count rate plots | Images |
|---|---|---|
| Comparison with Poisson distribution Blue bars denote a histogram of data divided into 1 sec bins. Red curve is a Poisson curve with rate = median count rate of data. |
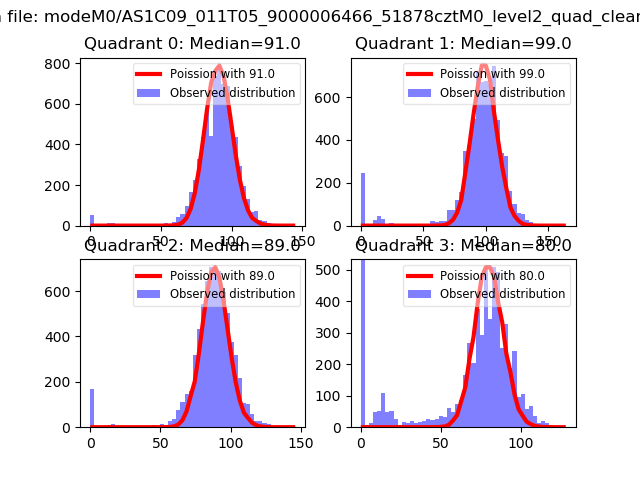 |
 |
| Quadrant-wise count rates Data is divided into 100 sec bins |
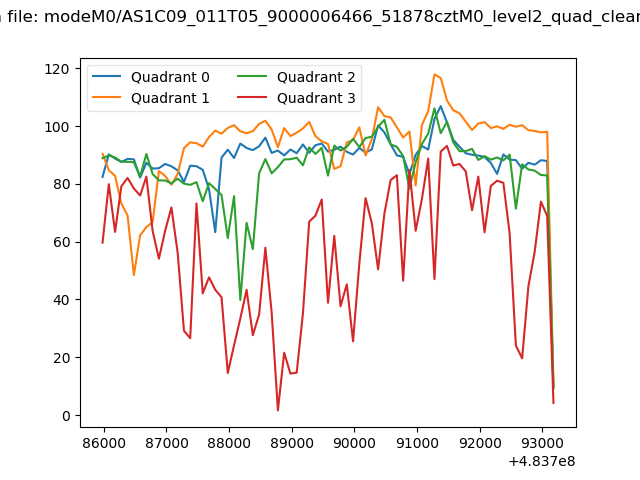 |
|
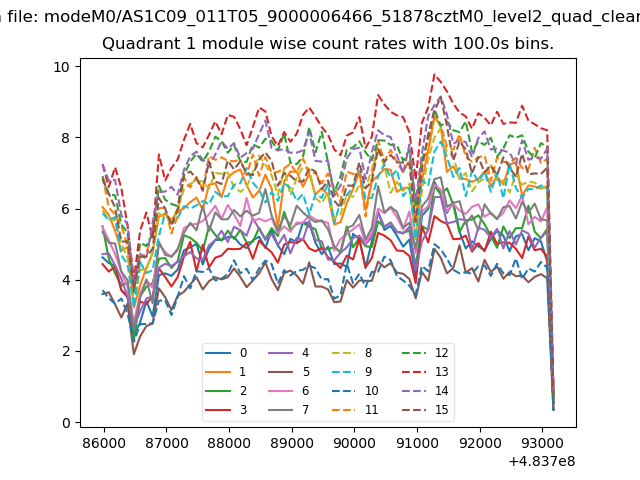
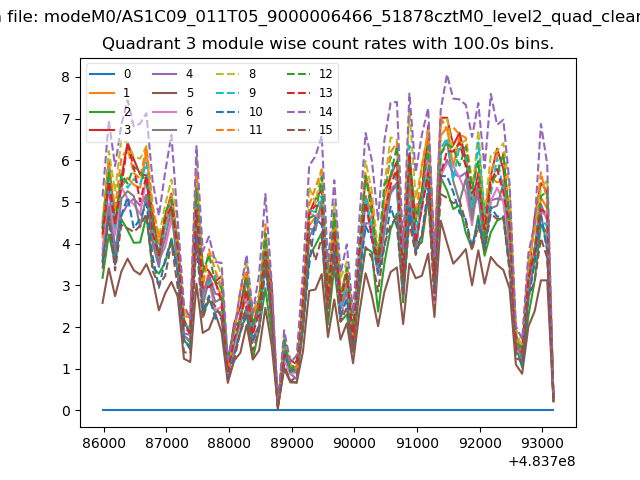
| Module-wise count rates for Quadrant A Data is divided into 100 sec bins |
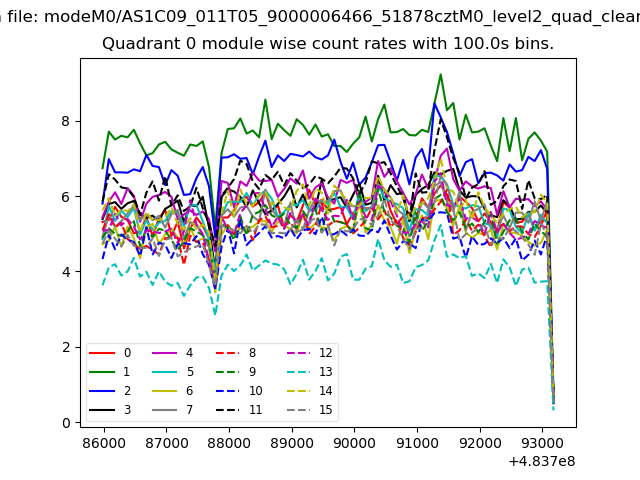 |
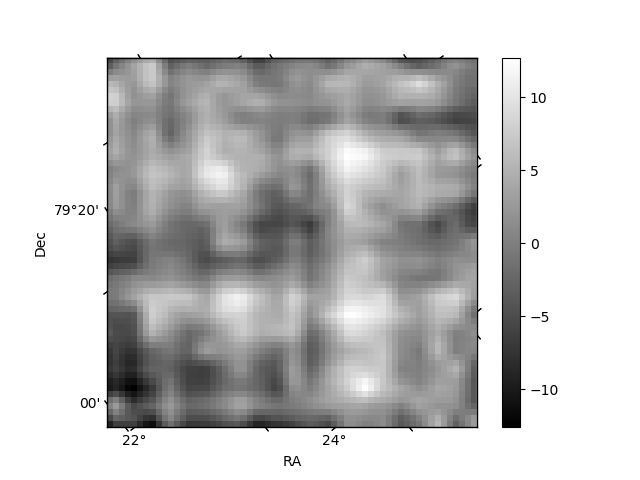 |
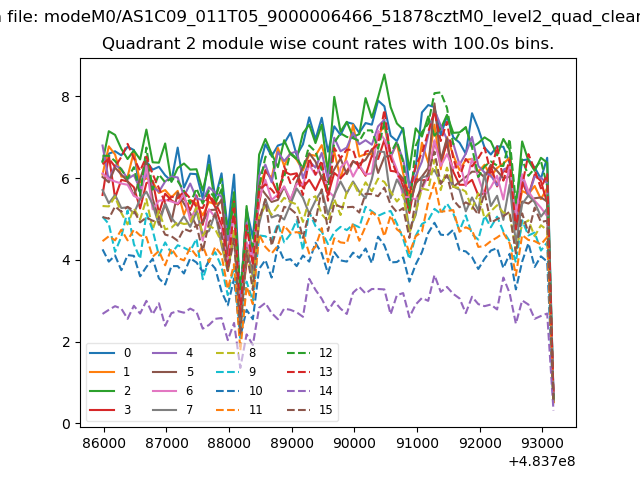
| Module-wise count rates for Quadrant B Data is divided into 100 sec bins |
 |
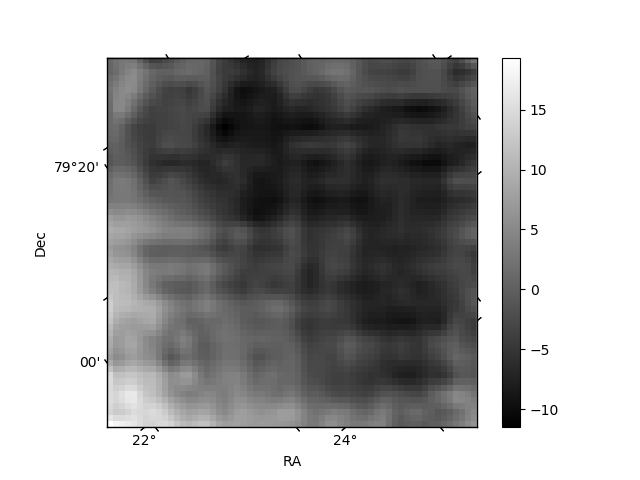 |
| Module-wise count rates for Quadrant C Data is divided into 100 sec bins |
 |
 |
| Module-wise count rates for Quadrant D Data is divided into 100 sec bins |
 |
 |
| Parameter | Plot |
|---|---|
| CZT HV Monitor | 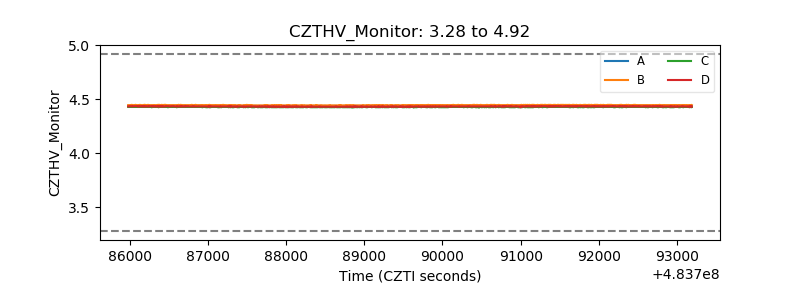 |
| D_VDD | 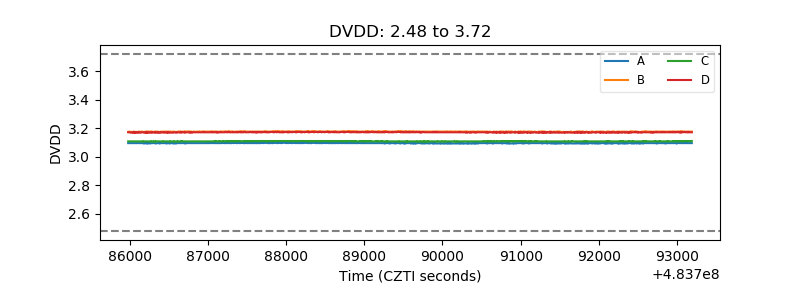 |
| Temperature 1 | 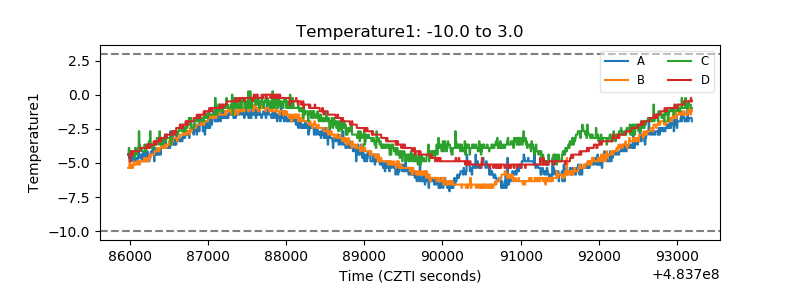 |
| Veto HV Monitor | 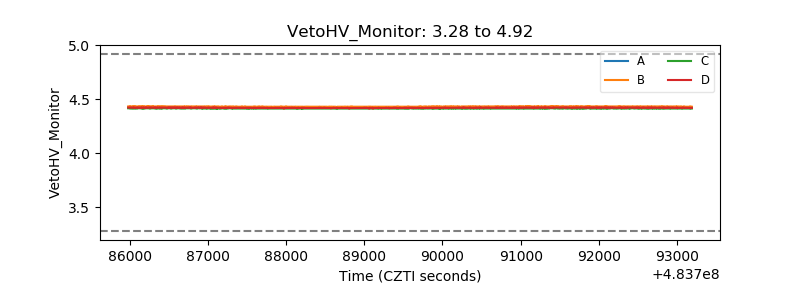 |
| Veto LLD | 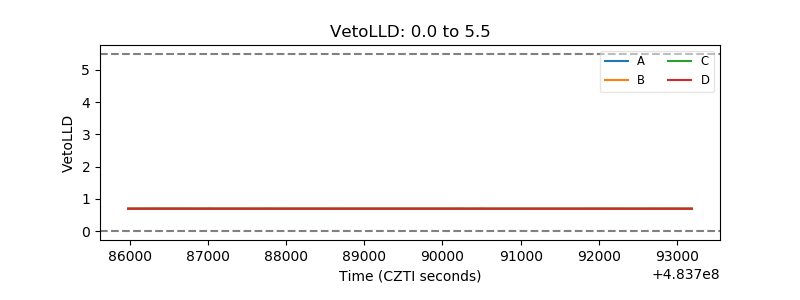 |
| Alpha Counter | 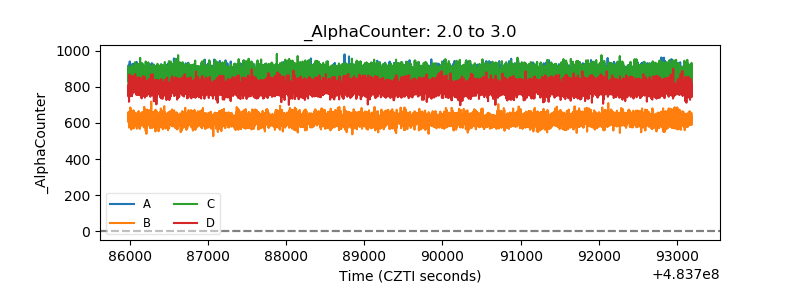 |
| _CPM_Rate | 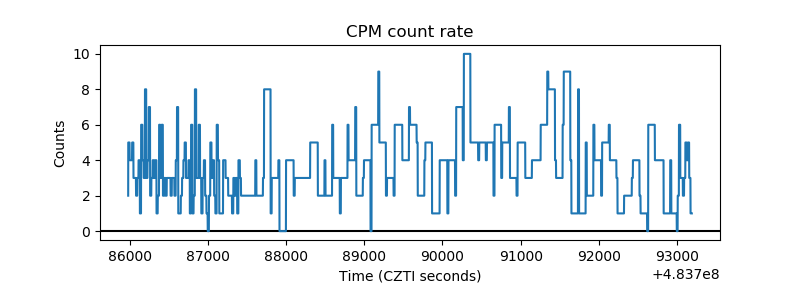 |
| CZT Counter | 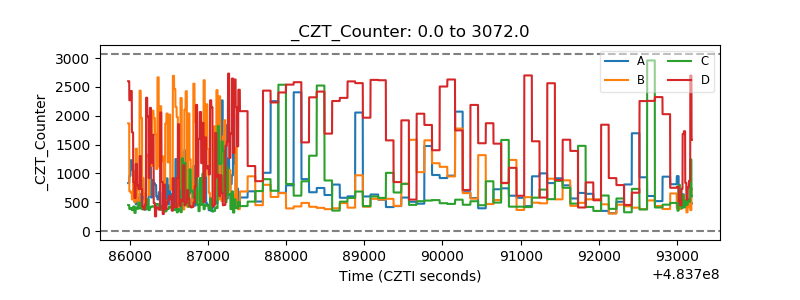 |
| +2.5 Volts monitor | 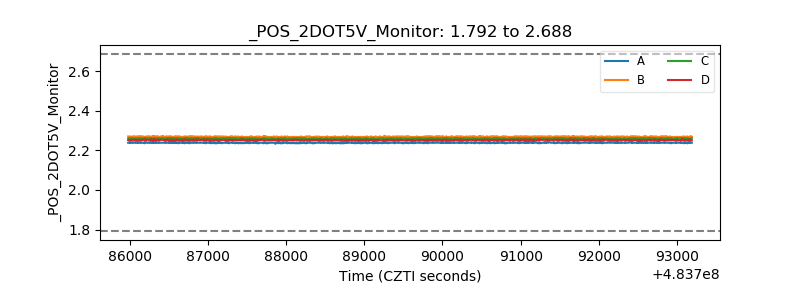 |
| +5 Volts monitor |  |
| _ROLL_ROT | 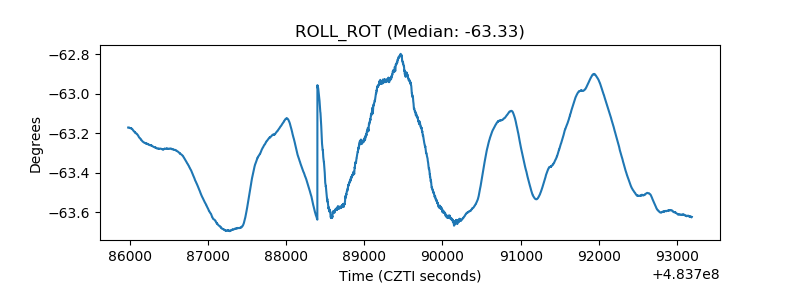 |
| _Roll_DEC | 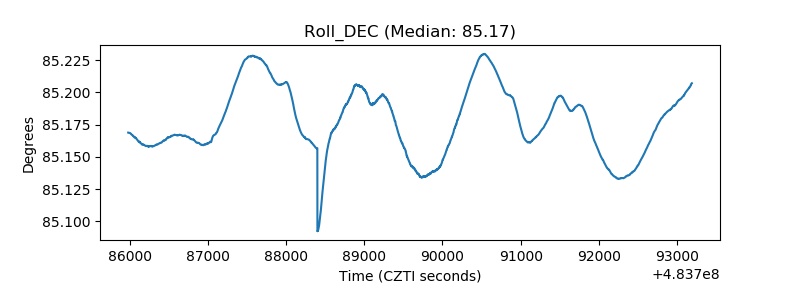 |
| _Roll_RA | 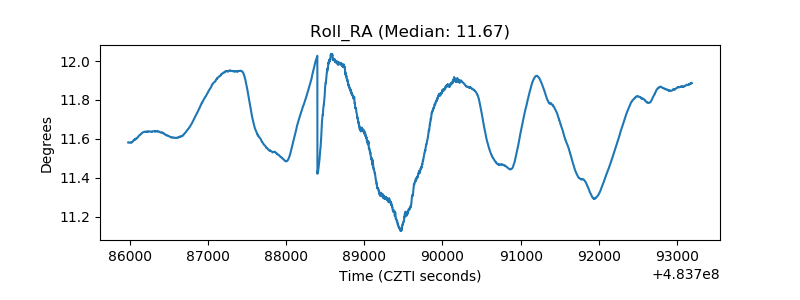 |
| Veto Counter | 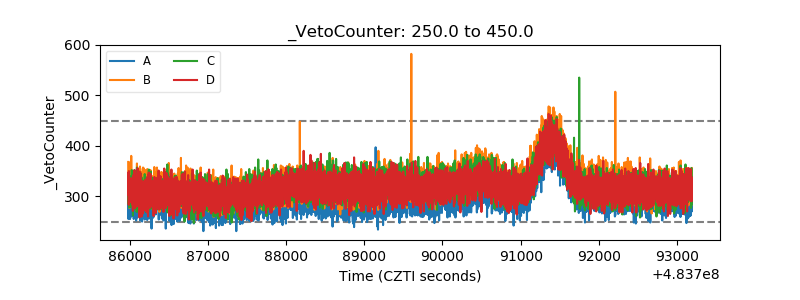 |