| Param | Original file | Final file |
|---|---|---|
| Filename | modeM0/AS1C09_011T05_9000006466_51881cztM0_level2.fits | modeM0/AS1C09_011T05_9000006466_51881cztM0_level2_quad_clean.evt |
| Size (bytes) | 2,100,424,320 | 234,460,800 |
| Size | 2.0 GB | 223.6 MB |
| Events in quadrant A | 16,051,469 | 1,604,741 |
| Events in quadrant B | 13,402,383 | 1,815,480 |
| Events in quadrant C | 14,300,040 | 1,568,577 |
| Events in quadrant D | 32,539,223 | 805,826 |
| Mode SS | |||
|---|---|---|---|
| Quadrant | BADHDUFLAG | Total packets | Discarded packets |
| A | 0 | 382 | 0 |
| B | 0 | 382 | 0 |
| C | 0 | 382 | 0 |
| D | 0 | 382 | 0 |
| Mode M0 | |||
|---|---|---|---|
| Quadrant | BADHDUFLAG | Total packets | Discarded packets |
| A | 0 | 60655 | 2 |
| B | 0 | 52759 | 2 |
| C | 0 | 55745 | 3 |
| D | 0 | 109636 | 2 |
| Mode M9 | |||
|---|---|---|---|
| Quadrant | BADHDUFLAG | Total packets | Discarded packets |
| A | 0 | 10 | 0 |
| B | 0 | 10 | 0 |
| C | 0 | 10 | 0 |
| D | 0 | 10 | 0 |
| Quadrant | Total seconds | Saturated seconds | Saturation percentage |
|---|---|---|---|
| A | 18907 | 1318 | 6.970963% |
| B | 18908 | 972 | 5.140681% |
| C | 18907 | 1128 | 5.966044% |
| D | 18907 | 9778 | 51.716296% |
Noise dominated data is calculated using 1-second bins in cleaned event files. If a bin has >2000 counts, and if more than 50% of those come from <1% of pixels, then it is considered to be noise-dominated and hence unusable.
| Quadrant | # 1 sec bins | Bins with >0 counts | Bins with >2000 counts | High rate bins dominated by noise | Noise dominated (total time) | Noise dominated (detector-on time) | Marked lightcurve |
|---|---|---|---|---|---|---|---|
| A | 19897 | 18909 | 901 | 901 | 4.53% | 4.76% | 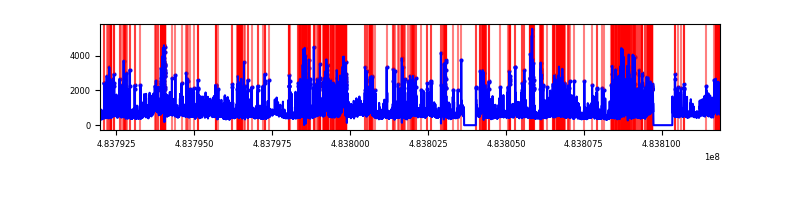 |
| B | 19898 | 18910 | 483 | 483 | 2.43% | 2.55% | 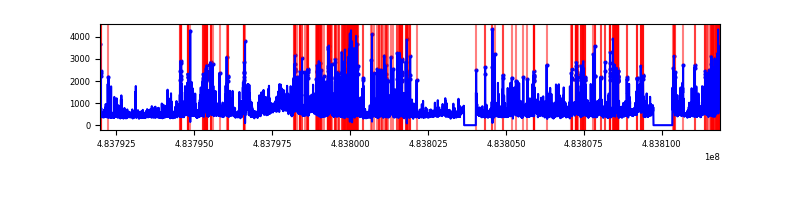 |
| C | 19897 | 18909 | 913 | 913 | 4.59% | 4.83% | 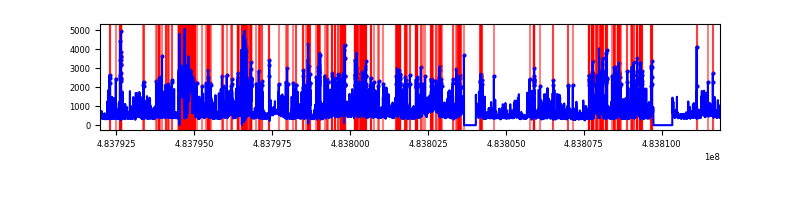 |
| D | 19897 | 18908 | 7549 | 7549 | 37.94% | 39.92% | 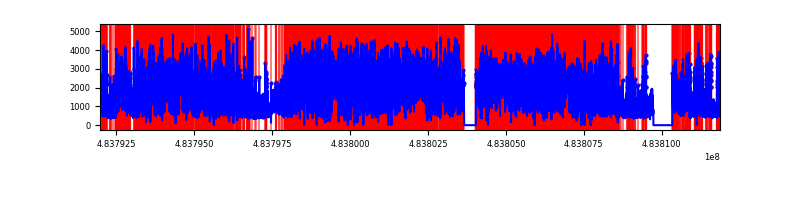 |
Top three noisy pixels from each quadrant. If the there are fewer than three noisy pixels in the level2.evt file, extra rows are filled as -1
| Pixel properties | Quadrant properties | ||||||
|---|---|---|---|---|---|---|---|
| Quadrant | DetID | PixID | Counts | Sigma | Mean | Median | Sigma |
| A | 11 | 3 | 1554111 | 3163.47 | 1961 | 1913 | 490.7 |
| A | 12 | 3 | 1016173 | 2067.12 | 1961 | 1913 | 490.7 |
| A | 4 | 175 | 936667 | 1905.08 | 1961 | 1913 | 490.7 |
| B | 4 | 170 | 1632268 | 3890.39 | 1969 | 1900 | 419.1 |
| B | 10 | 44 | 1214068 | 2892.48 | 1969 | 1900 | 419.1 |
| B | 1 | 223 | 723134 | 1721.01 | 1969 | 1900 | 419.1 |
| C | 15 | 192 | 1296274 | 2457.52 | 1921 | 1904 | 526.7 |
| C | 15 | 147 | 946962 | 1794.31 | 1921 | 1904 | 526.7 |
| C | 15 | 178 | 775344 | 1468.47 | 1921 | 1904 | 526.7 |
| D | 11 | 129 | 12333336 | 30483.96 | 1427 | 1369 | 404.5 |
| D | 12 | 17 | 6498129 | 16059.64 | 1427 | 1369 | 404.5 |
| D | 6 | 42 | 1700721 | 4200.71 | 1427 | 1369 | 404.5 |
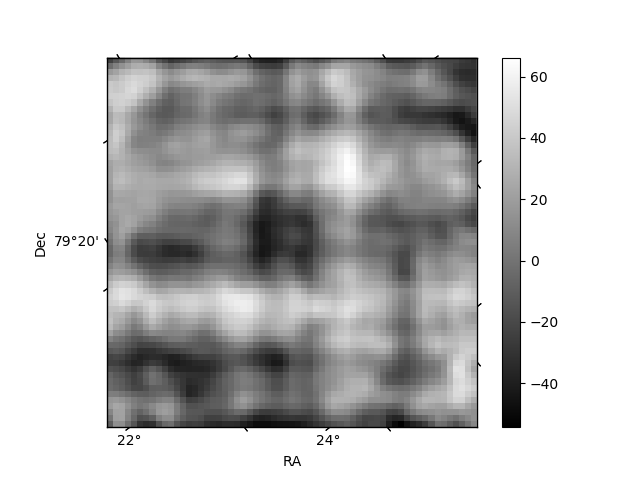
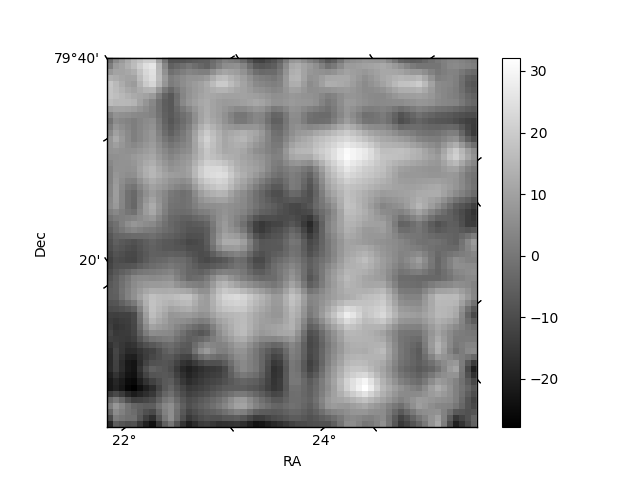
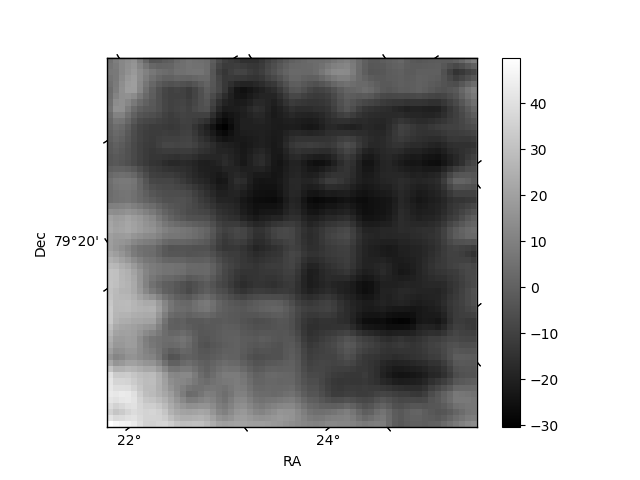
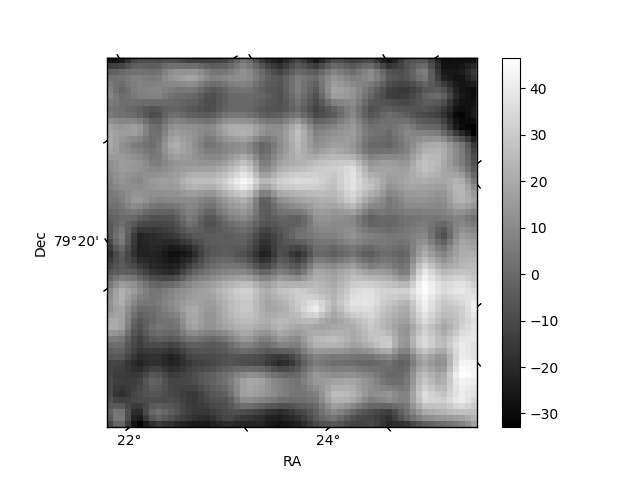
Histogram calculated using DETX and DETY for each event in the final _common_clean file
| Quadrant A | 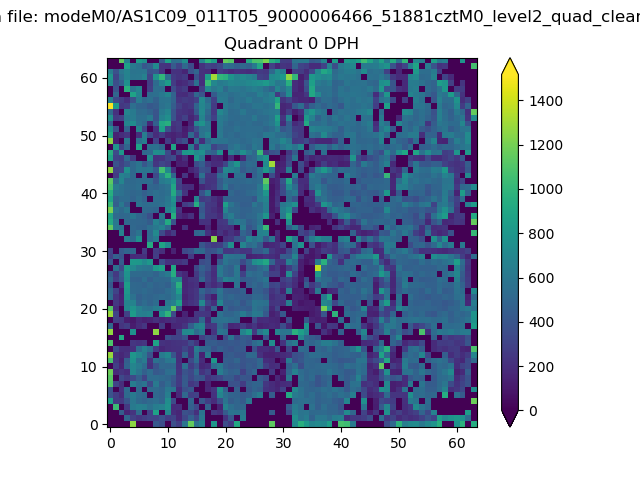 |
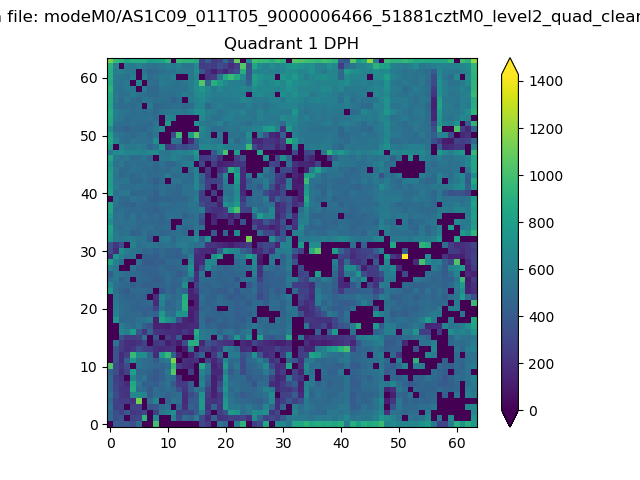 |
Quadrant B |
|---|---|---|---|
| Quadrant D | 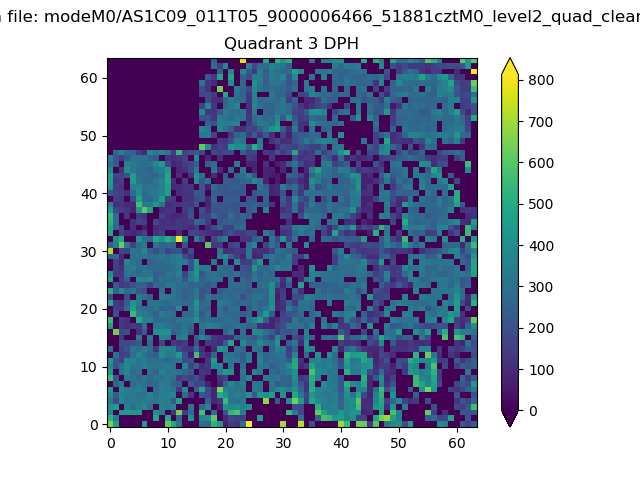 |
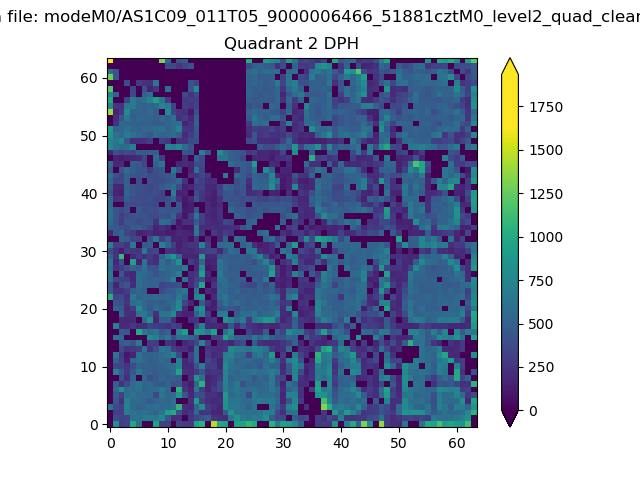 |
Quadrant C |
| Plot type | Count rate plots | Images |
|---|---|---|
| Comparison with Poisson distribution Blue bars denote a histogram of data divided into 1 sec bins. Red curve is a Poisson curve with rate = median count rate of data. |
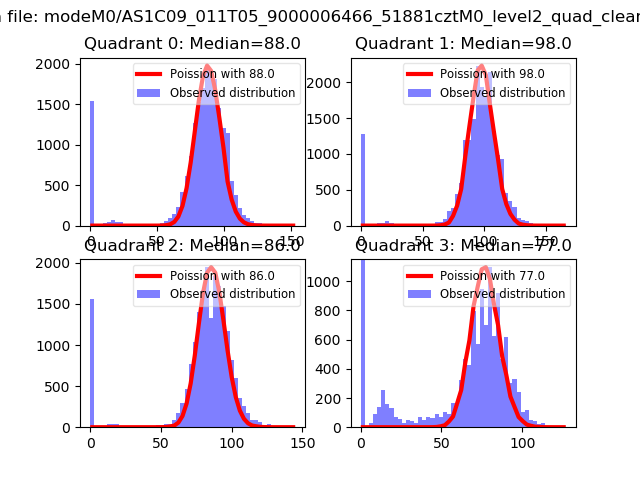 |
 |
| Quadrant-wise count rates Data is divided into 100 sec bins |
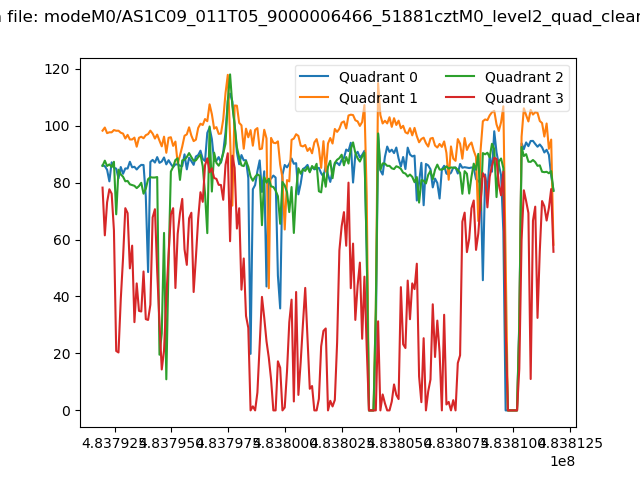 |
|
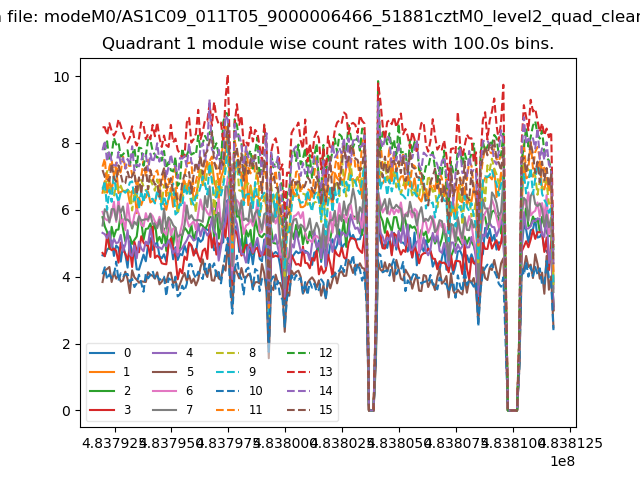
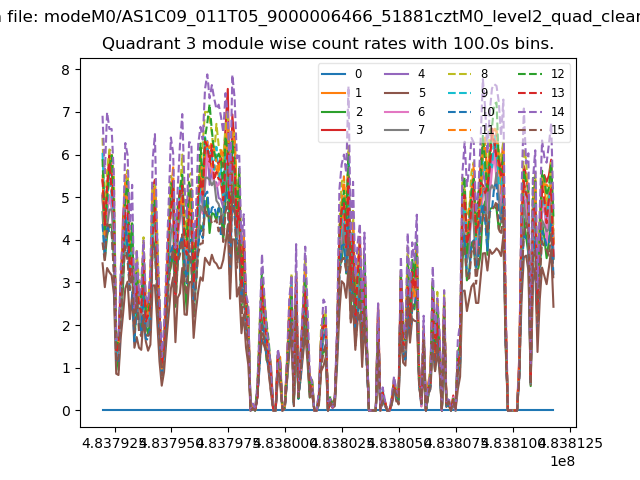
| Module-wise count rates for Quadrant A Data is divided into 100 sec bins |
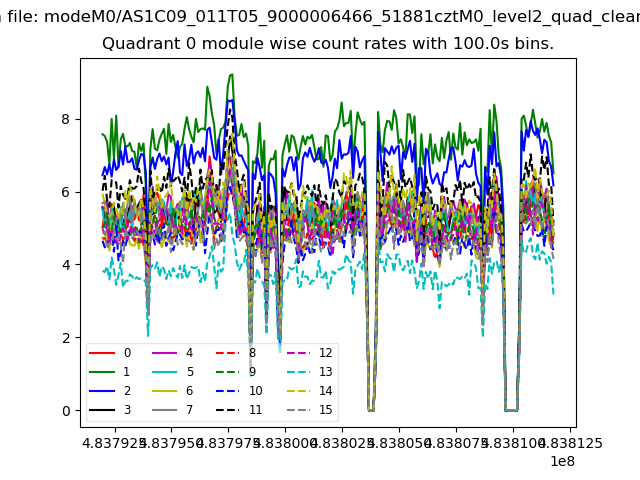 |
 |
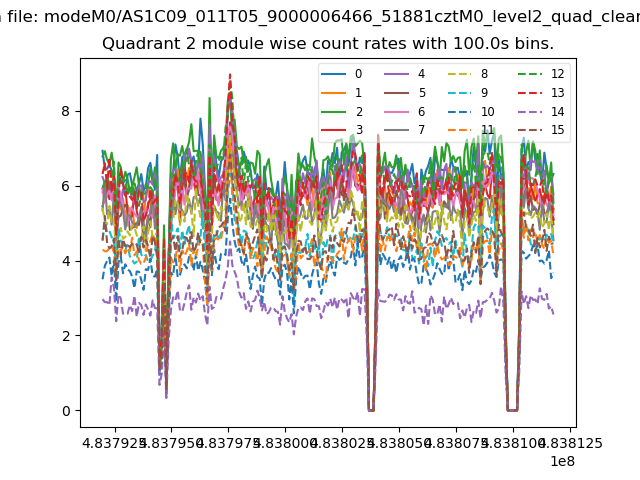
| Module-wise count rates for Quadrant B Data is divided into 100 sec bins |
 |
 |
| Module-wise count rates for Quadrant C Data is divided into 100 sec bins |
 |
 |
| Module-wise count rates for Quadrant D Data is divided into 100 sec bins |
 |
 |
| Parameter | Plot |
|---|---|
| CZT HV Monitor | 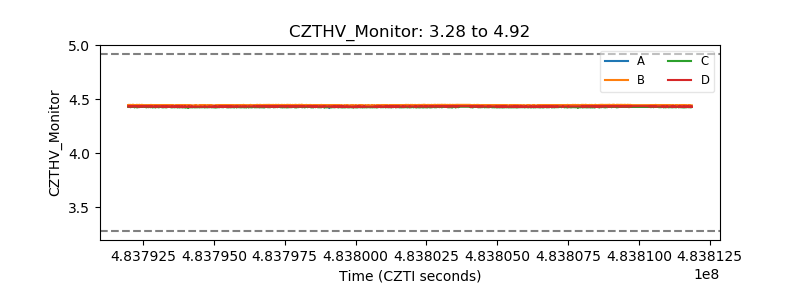 |
| D_VDD | 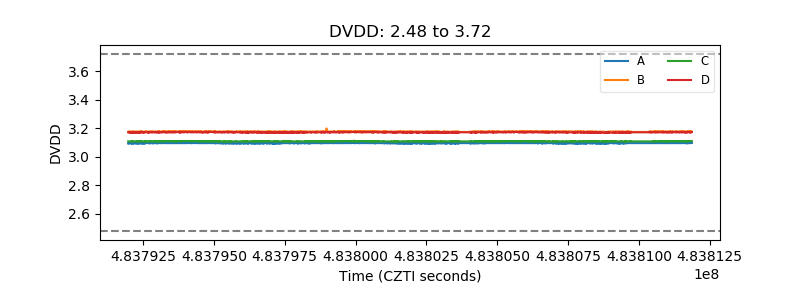 |
| Temperature 1 | 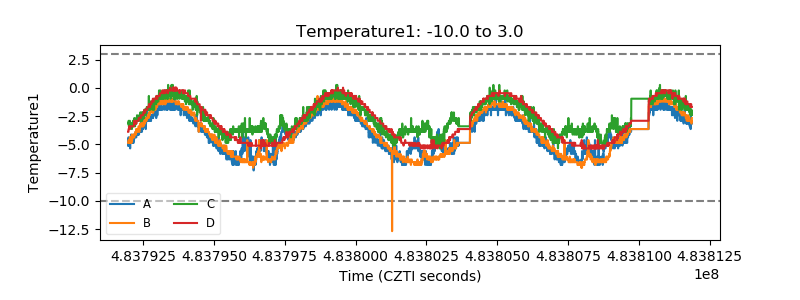 |
| Veto HV Monitor | 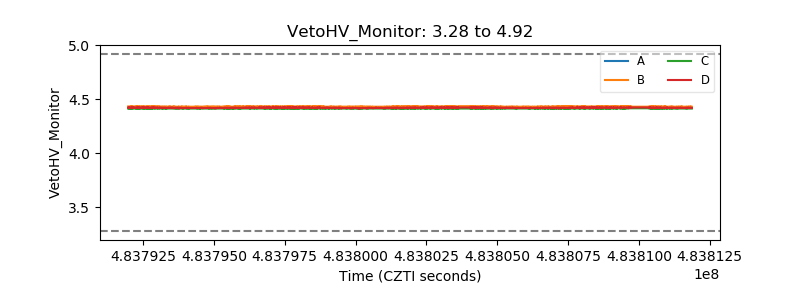 |
| Veto LLD | 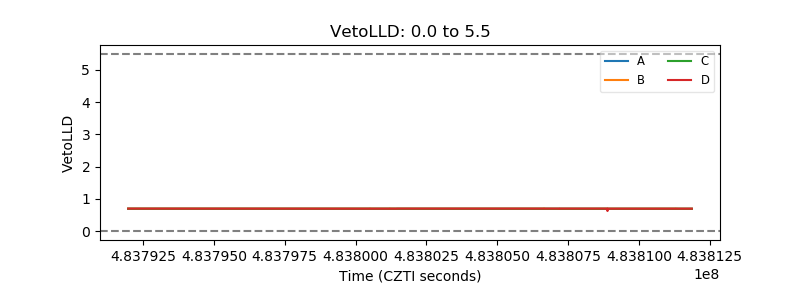 |
| Alpha Counter | 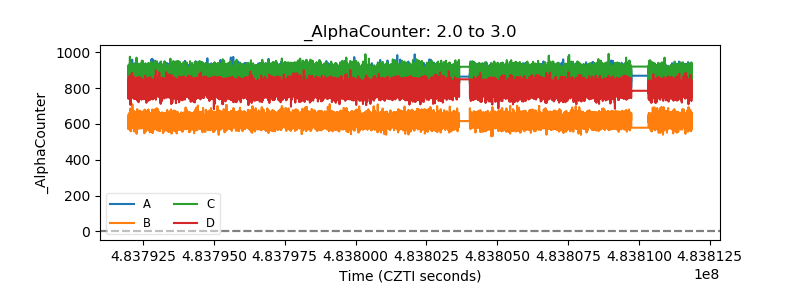 |
| _CPM_Rate | 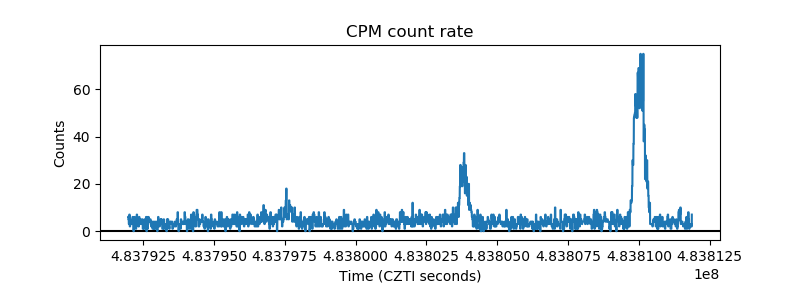 |
| CZT Counter | 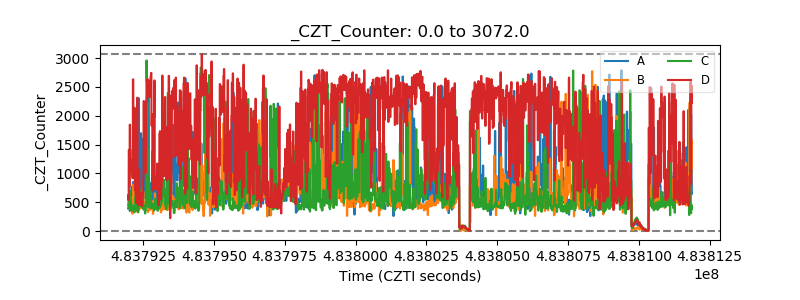 |
| +2.5 Volts monitor | 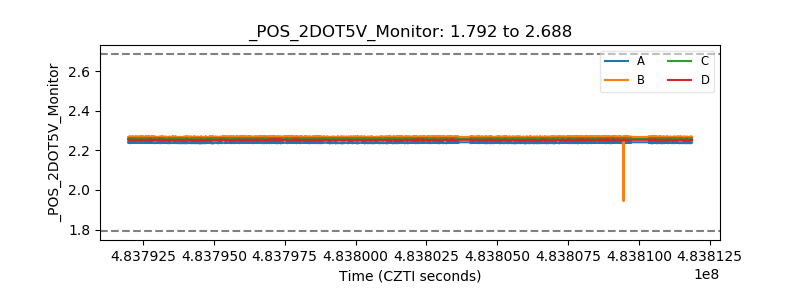 |
| +5 Volts monitor |  |
| _ROLL_ROT | 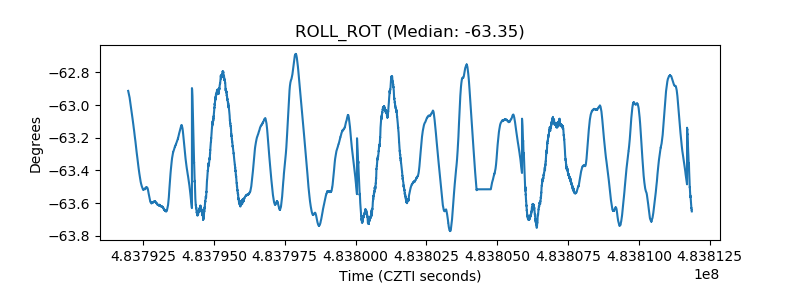 |
| _Roll_DEC | 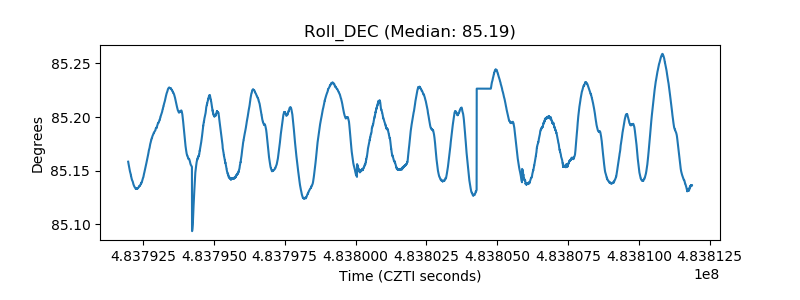 |
| _Roll_RA | 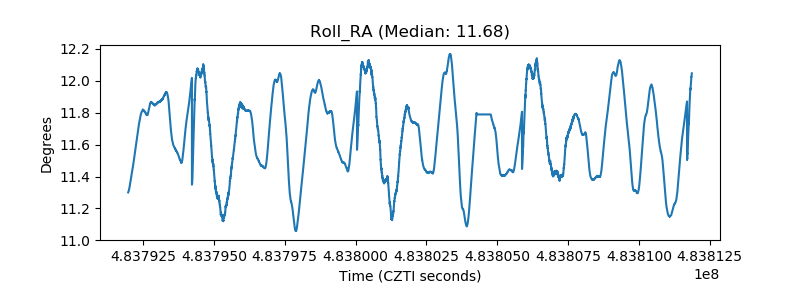 |
| Veto Counter | 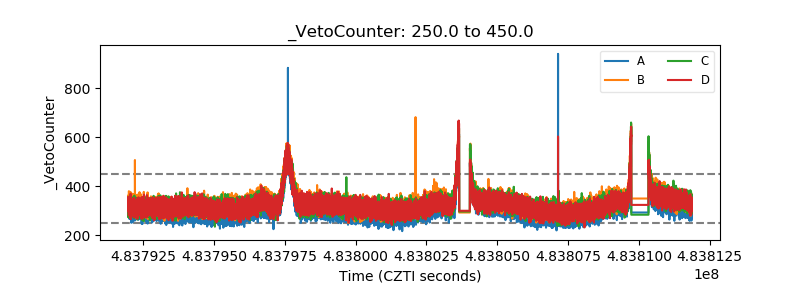 |