| Param | Original file | Final file |
|---|---|---|
| Filename | modeM0/AS1C09_011T05_9000006466_51882cztM0_level2.fits | modeM0/AS1C09_011T05_9000006466_51882cztM0_level2_quad_clean.evt |
| Size (bytes) | 709,205,760 | 87,209,280 |
| Size | 676.4 MB | 83.2 MB |
| Events in quadrant A | 5,848,441 | 605,370 |
| Events in quadrant B | 5,132,255 | 649,974 |
| Events in quadrant C | 3,874,902 | 598,595 |
| Events in quadrant D | 10,883,538 | 324,642 |
| Mode SS | |||
|---|---|---|---|
| Quadrant | BADHDUFLAG | Total packets | Discarded packets |
| A | 0 | 132 | 0 |
| B | 0 | 132 | 0 |
| C | 0 | 132 | 0 |
| D | 0 | 132 | 0 |
| Mode M0 | |||
|---|---|---|---|
| Quadrant | BADHDUFLAG | Total packets | Discarded packets |
| A | 0 | 21988 | 1 |
| B | 0 | 19710 | 1 |
| C | 0 | 16069 | 1 |
| D | 0 | 36953 | 9 |
| Mode M9 | |||
|---|---|---|---|
| Quadrant | BADHDUFLAG | Total packets | Discarded packets |
| A | 0 | 9 | 0 |
| B | 0 | 9 | 0 |
| C | 0 | 9 | 0 |
| D | 0 | 9 | 0 |
| Quadrant | Total seconds | Saturated seconds | Saturation percentage |
|---|---|---|---|
| A | 6629 | 268 | 4.042842% |
| B | 6629 | 358 | 5.400513% |
| C | 6629 | 94 | 1.418012% |
| D | 6629 | 3083 | 46.507769% |
Noise dominated data is calculated using 1-second bins in cleaned event files. If a bin has >2000 counts, and if more than 50% of those come from <1% of pixels, then it is considered to be noise-dominated and hence unusable.
| Quadrant | # 1 sec bins | Bins with >0 counts | Bins with >2000 counts | High rate bins dominated by noise | Noise dominated (total time) | Noise dominated (detector-on time) | Marked lightcurve |
|---|---|---|---|---|---|---|---|
| A | 7444 | 6630 | 228 | 228 | 3.06% | 3.44% | 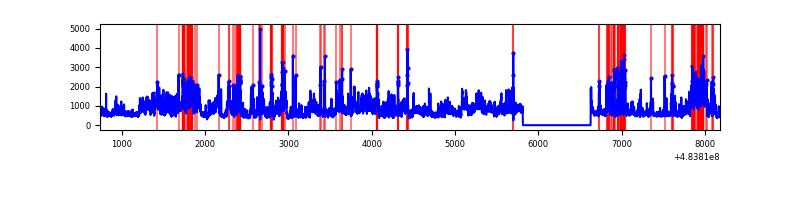 |
| B | 7444 | 6630 | 203 | 203 | 2.73% | 3.06% | 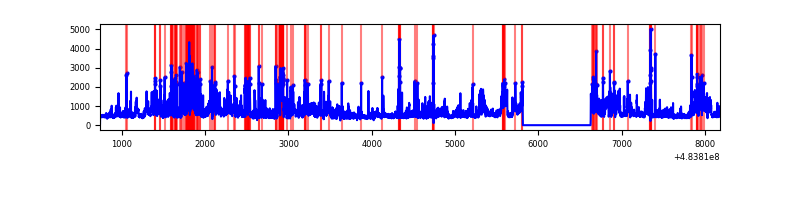 |
| C | 7444 | 6630 | 56 | 56 | 0.75% | 0.84% | 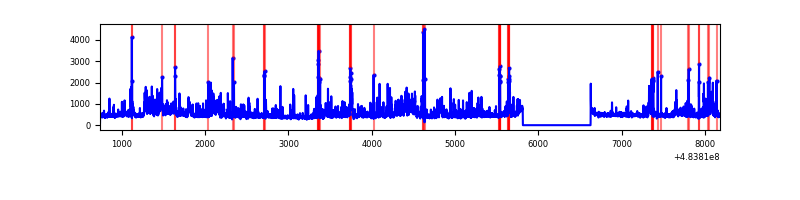 |
| D | 7443 | 6628 | 2353 | 2353 | 31.61% | 35.50% | 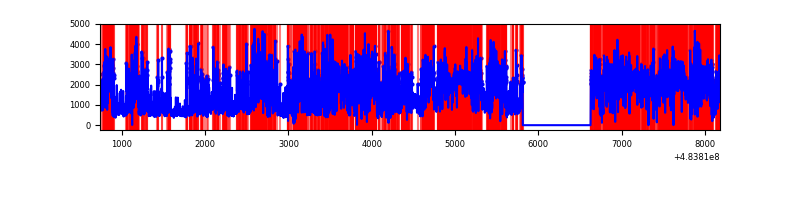 |
Top three noisy pixels from each quadrant. If the there are fewer than three noisy pixels in the level2.evt file, extra rows are filled as -1
| Pixel properties | Quadrant properties | ||||||
|---|---|---|---|---|---|---|---|
| Quadrant | DetID | PixID | Counts | Sigma | Mean | Median | Sigma |
| A | 12 | 3 | 1014445 | 5904.97 | 690 | 674 | 171.7 |
| A | 4 | 175 | 561515 | 3266.76 | 690 | 674 | 171.7 |
| A | 5 | 241 | 379839 | 2208.54 | 690 | 674 | 171.7 |
| B | 4 | 170 | 1182737 | 8073.57 | 685 | 662 | 146.4 |
| B | 1 | 223 | 264277 | 1800.49 | 685 | 662 | 146.4 |
| B | 10 | 44 | 210512 | 1433.27 | 685 | 662 | 146.4 |
| C | 15 | 192 | 388610 | 2071.17 | 685 | 678 | 187.3 |
| C | 14 | 245 | 121280 | 643.9 | 685 | 678 | 187.3 |
| C | 13 | 3 | 120424 | 639.33 | 685 | 678 | 187.3 |
| D | 12 | 17 | 3371073 | 23590.18 | 510 | 492 | 142.9 |
| D | 11 | 129 | 2697871 | 18878.54 | 510 | 492 | 142.9 |
| D | 0 | 18 | 868870 | 6077.64 | 510 | 492 | 142.9 |
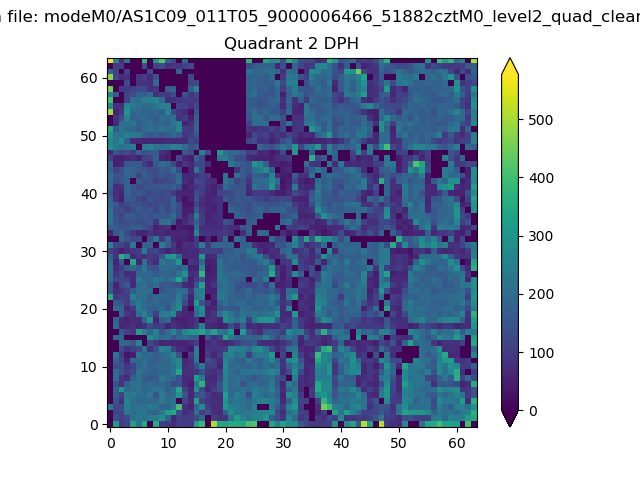
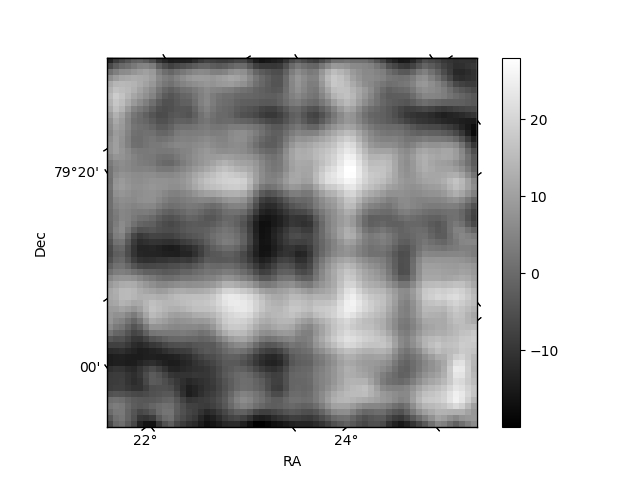
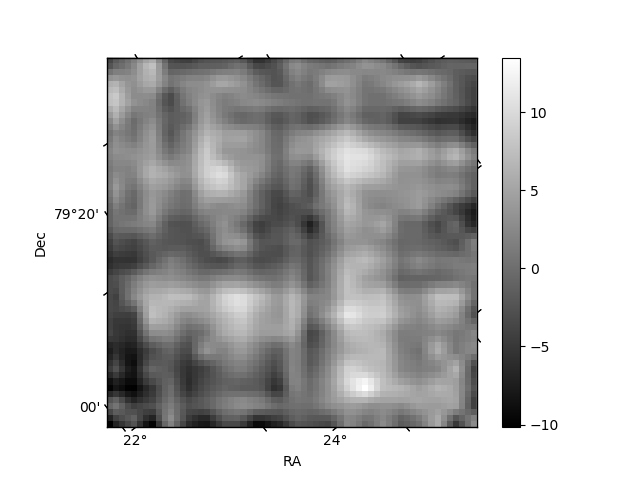
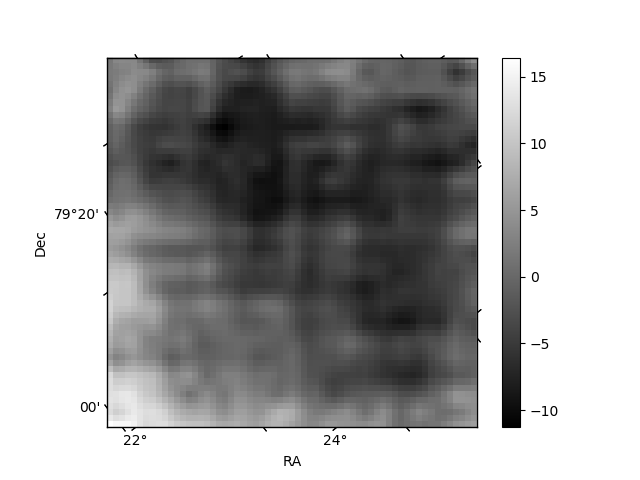
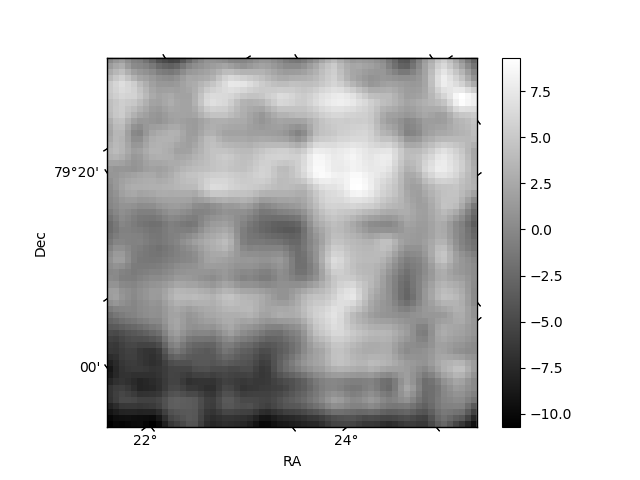
Histogram calculated using DETX and DETY for each event in the final _common_clean file
| Quadrant A | 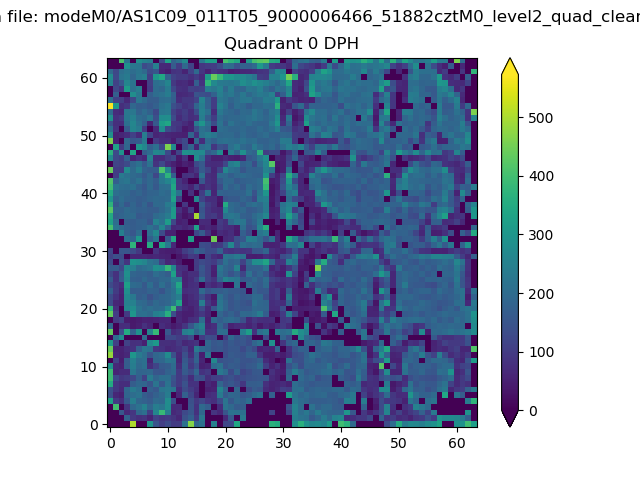 |
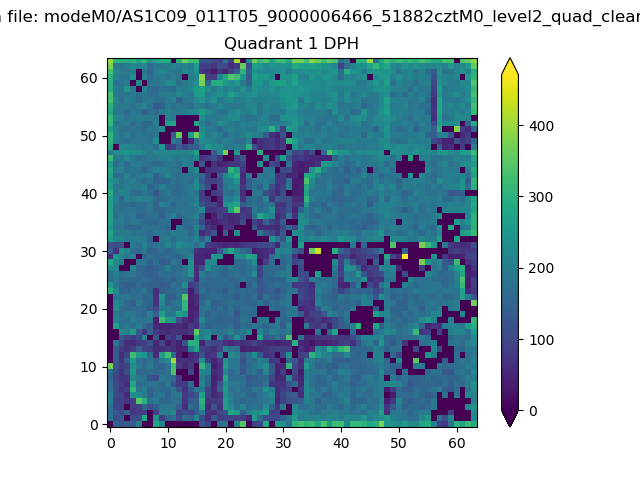 |
Quadrant B |
|---|---|---|---|
| Quadrant D | 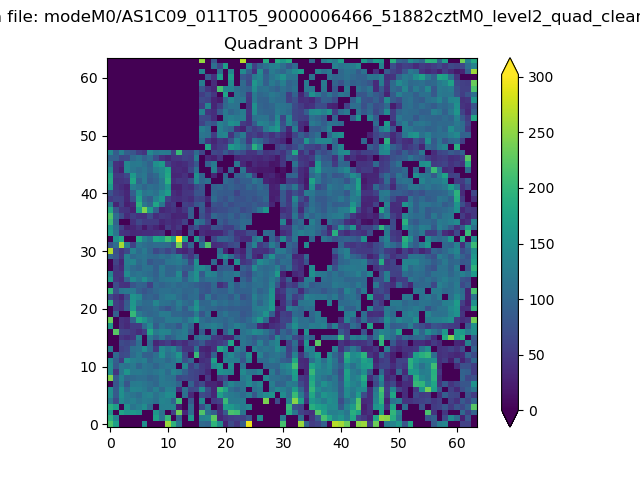 |
 |
Quadrant C |
| Plot type | Count rate plots | Images |
|---|---|---|
| Comparison with Poisson distribution Blue bars denote a histogram of data divided into 1 sec bins. Red curve is a Poisson curve with rate = median count rate of data. |
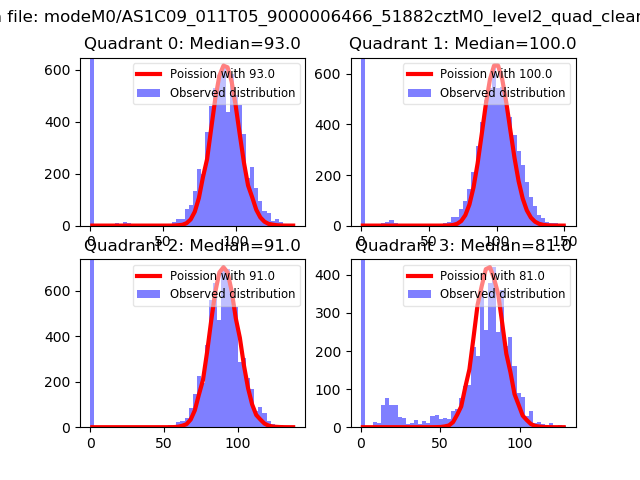 |
 |
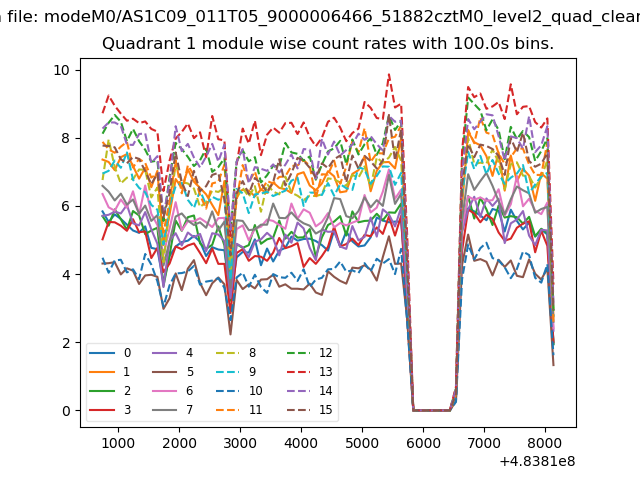
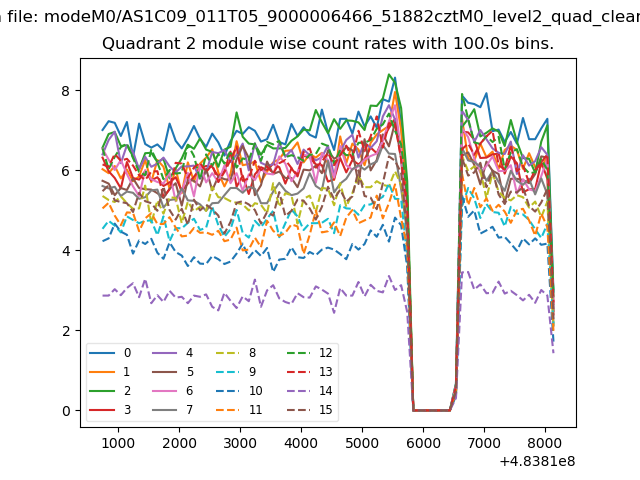
| Quadrant-wise count rates Data is divided into 100 sec bins |
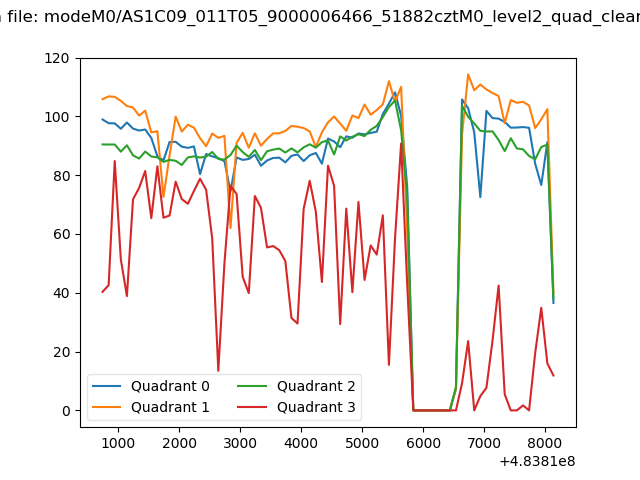 |
|
| Module-wise count rates for Quadrant A Data is divided into 100 sec bins |
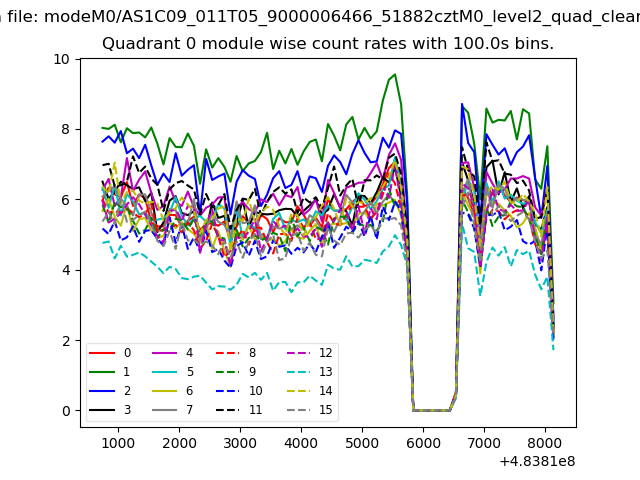 |
 |
| Module-wise count rates for Quadrant B Data is divided into 100 sec bins |
 |
 |
| Module-wise count rates for Quadrant C Data is divided into 100 sec bins |
 |
 |
| Module-wise count rates for Quadrant D Data is divided into 100 sec bins |
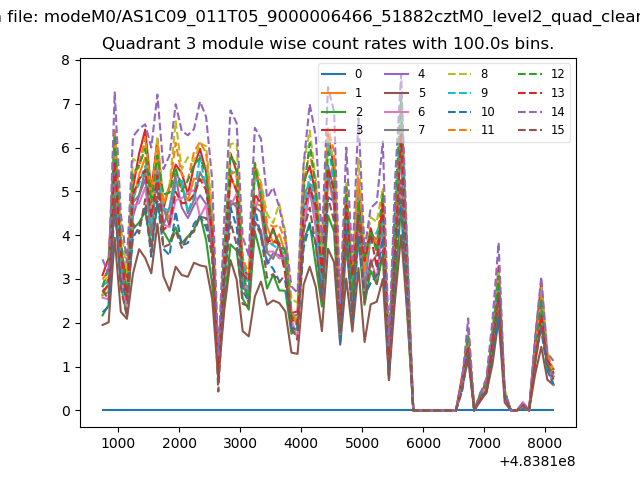 |
 |
| Parameter | Plot |
|---|---|
| CZT HV Monitor | 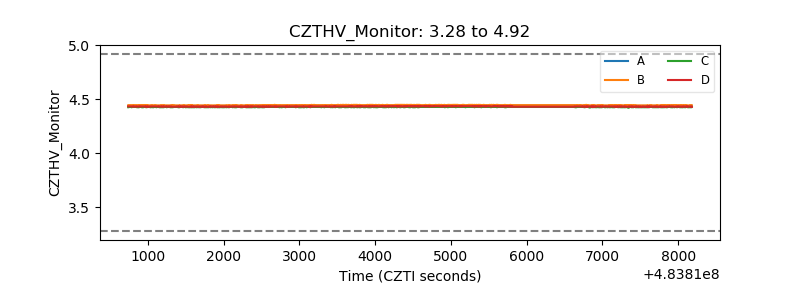 |
| D_VDD | 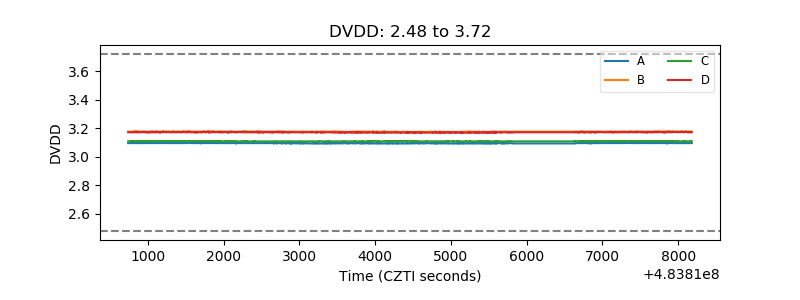 |
| Temperature 1 | 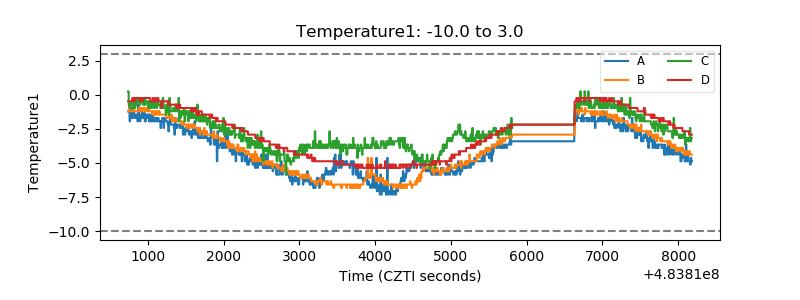 |
| Veto HV Monitor | 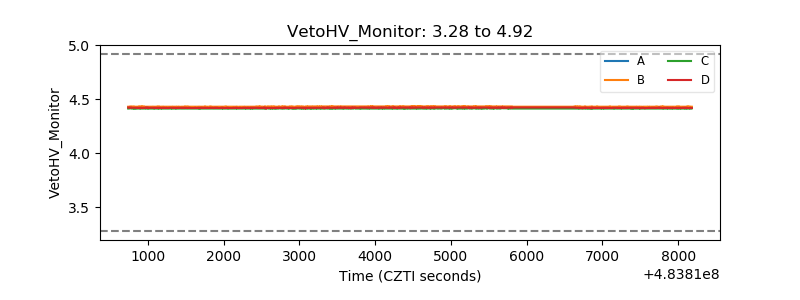 |
| Veto LLD | 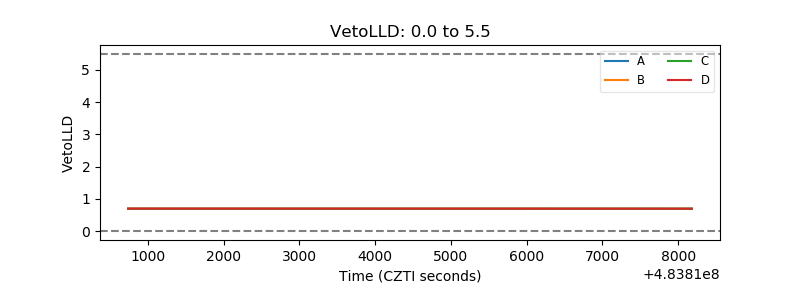 |
| Alpha Counter | 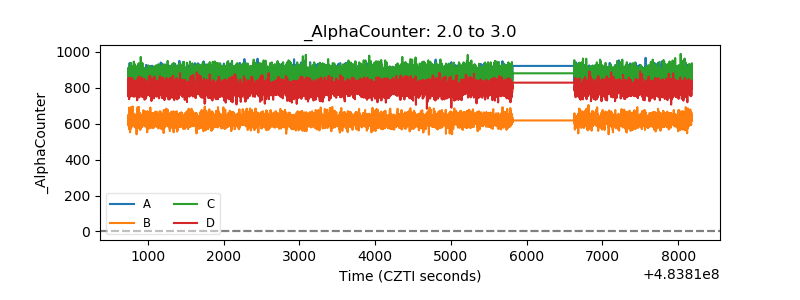 |
| _CPM_Rate | 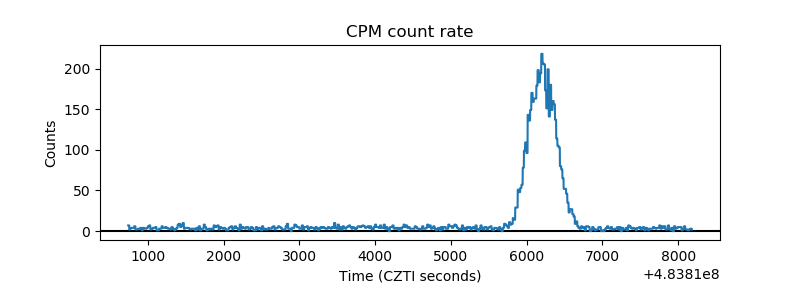 |
| CZT Counter | 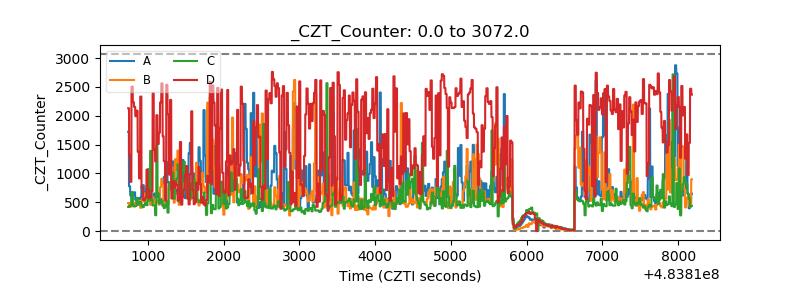 |
| +2.5 Volts monitor | 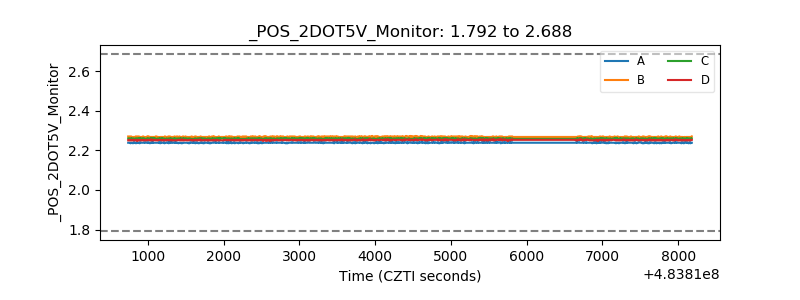 |
| +5 Volts monitor | 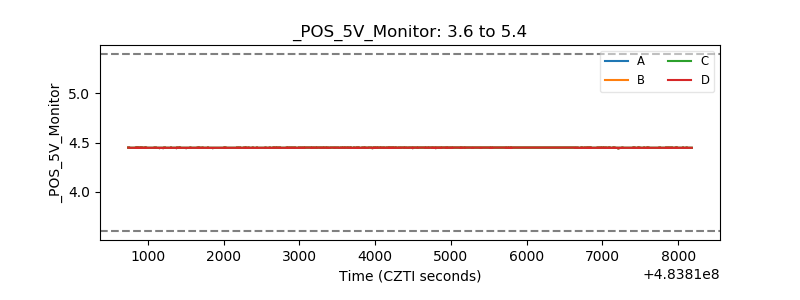 |
| _ROLL_ROT | 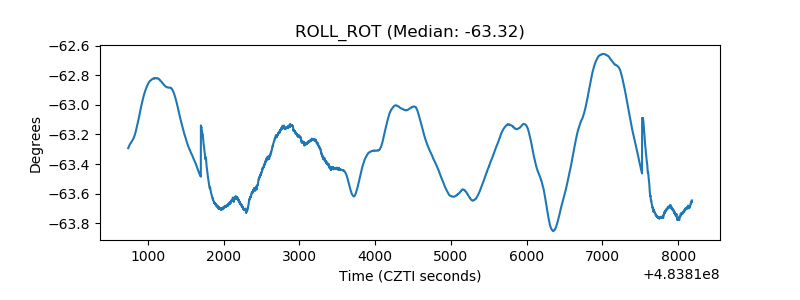 |
| _Roll_DEC | 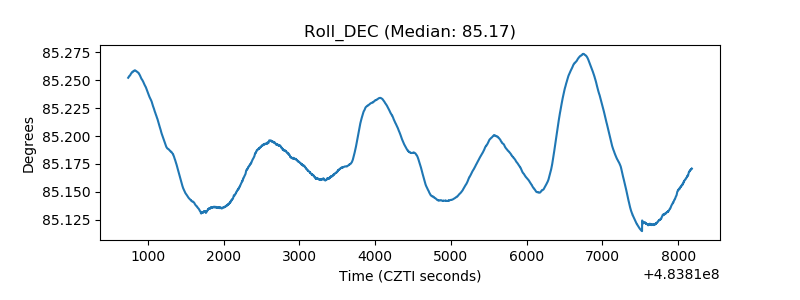 |
| _Roll_RA | 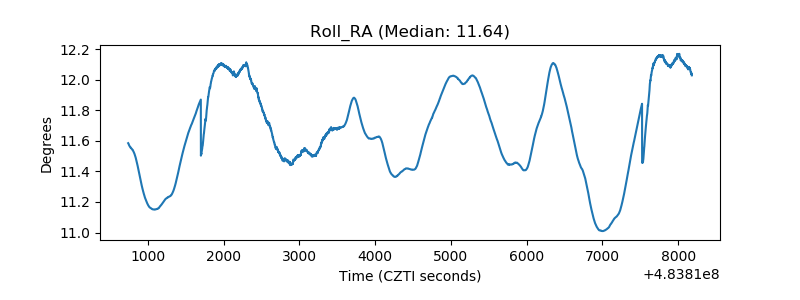 |
| Veto Counter | 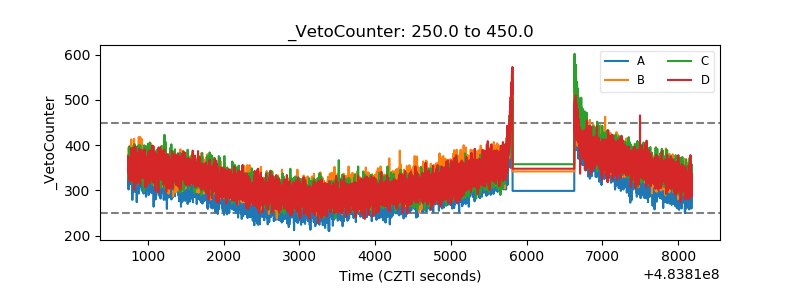 |