| Param | Original file | Final file |
|---|---|---|
| Filename | modeM0/AS1C09_011T05_9000006466_51884cztM0_level2.fits | modeM0/AS1C09_011T05_9000006466_51884cztM0_level2_quad_clean.evt |
| Size (bytes) | 760,878,720 | 77,837,760 |
| Size | 725.6 MB | 74.2 MB |
| Events in quadrant A | 5,877,927 | 567,062 |
| Events in quadrant B | 5,245,440 | 616,070 |
| Events in quadrant C | 3,855,728 | 560,281 |
| Events in quadrant D | 12,704,183 | 178,176 |
| Mode SS | |||
|---|---|---|---|
| Quadrant | BADHDUFLAG | Total packets | Discarded packets |
| A | 0 | 128 | 0 |
| B | 0 | 128 | 0 |
| C | 0 | 128 | 0 |
| D | 0 | 128 | 0 |
| Mode M0 | |||
|---|---|---|---|
| Quadrant | BADHDUFLAG | Total packets | Discarded packets |
| A | 0 | 21843 | 1 |
| B | 0 | 19871 | 1 |
| C | 0 | 15915 | 1 |
| D | 0 | 41974 | 3 |
| Mode M9 | |||
|---|---|---|---|
| Quadrant | BADHDUFLAG | Total packets | Discarded packets |
| A | 0 | 9 | 0 |
| B | 0 | 9 | 0 |
| C | 0 | 9 | 0 |
| D | 0 | 9 | 0 |
| Quadrant | Total seconds | Saturated seconds | Saturation percentage |
|---|---|---|---|
| A | 6224 | 258 | 4.145244% |
| B | 6225 | 332 | 5.333333% |
| C | 6225 | 204 | 3.277108% |
| D | 6224 | 4429 | 71.160026% |
Noise dominated data is calculated using 1-second bins in cleaned event files. If a bin has >2000 counts, and if more than 50% of those come from <1% of pixels, then it is considered to be noise-dominated and hence unusable.
| Quadrant | # 1 sec bins | Bins with >0 counts | Bins with >2000 counts | High rate bins dominated by noise | Noise dominated (total time) | Noise dominated (detector-on time) | Marked lightcurve |
|---|---|---|---|---|---|---|---|
| A | 7189 | 6225 | 168 | 168 | 2.34% | 2.70% | 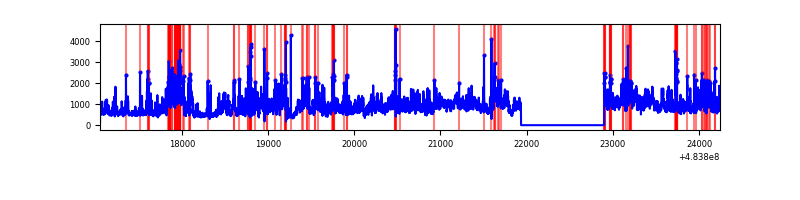 |
| B | 7190 | 6226 | 222 | 222 | 3.09% | 3.57% | 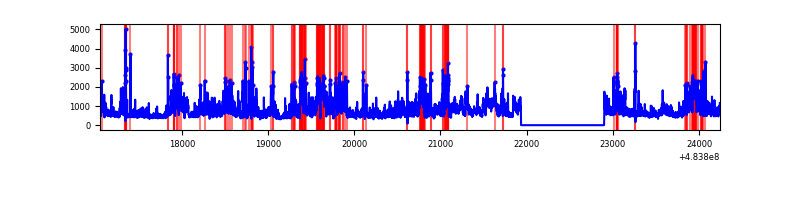 |
| C | 7190 | 6226 | 130 | 130 | 1.81% | 2.09% | 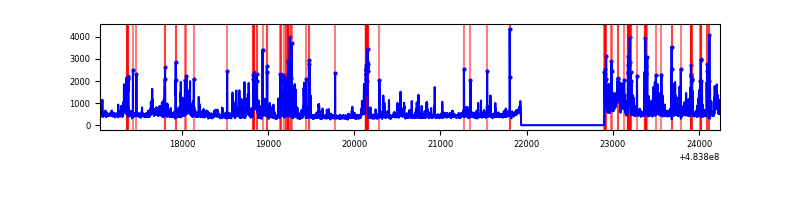 |
| D | 7189 | 6223 | 3397 | 3397 | 47.25% | 54.59% | 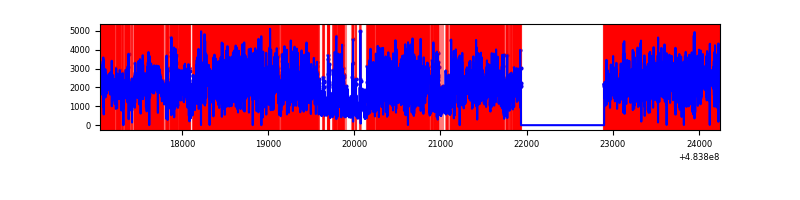 |
Top three noisy pixels from each quadrant. If the there are fewer than three noisy pixels in the level2.evt file, extra rows are filled as -1
| Pixel properties | Quadrant properties | ||||||
|---|---|---|---|---|---|---|---|
| Quadrant | DetID | PixID | Counts | Sigma | Mean | Median | Sigma |
| A | 12 | 3 | 1483052 | 9238.93 | 642 | 627 | 160.5 |
| A | 4 | 175 | 460329 | 2865.01 | 642 | 627 | 160.5 |
| A | 4 | 3 | 277873 | 1727.88 | 642 | 627 | 160.5 |
| B | 10 | 44 | 1114074 | 8166.89 | 644 | 621 | 136.3 |
| B | 4 | 170 | 334291 | 2447.38 | 644 | 621 | 136.3 |
| B | 10 | 254 | 282170 | 2065.09 | 644 | 621 | 136.3 |
| C | 1 | 60 | 316510 | 1792.55 | 638 | 634 | 176.2 |
| C | 14 | 245 | 240395 | 1360.61 | 638 | 634 | 176.2 |
| C | 13 | 3 | 199596 | 1129.08 | 638 | 634 | 176.2 |
| D | 11 | 129 | 6310923 | 57731.69 | 381 | 366 | 109.3 |
| D | 12 | 17 | 3074056 | 28119.44 | 381 | 366 | 109.3 |
| D | 8 | 176 | 649560 | 5939.11 | 381 | 366 | 109.3 |
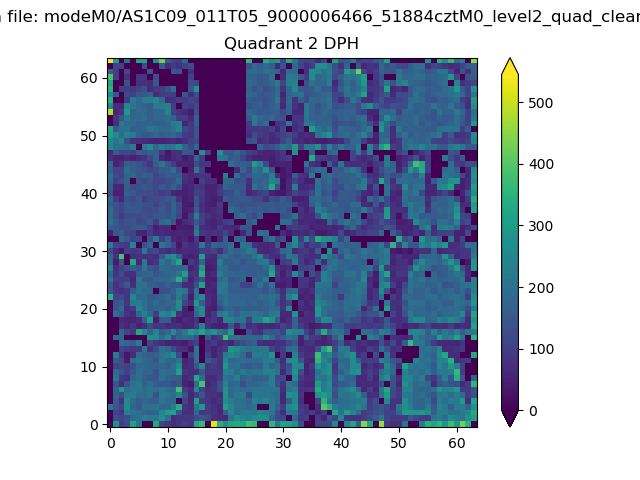
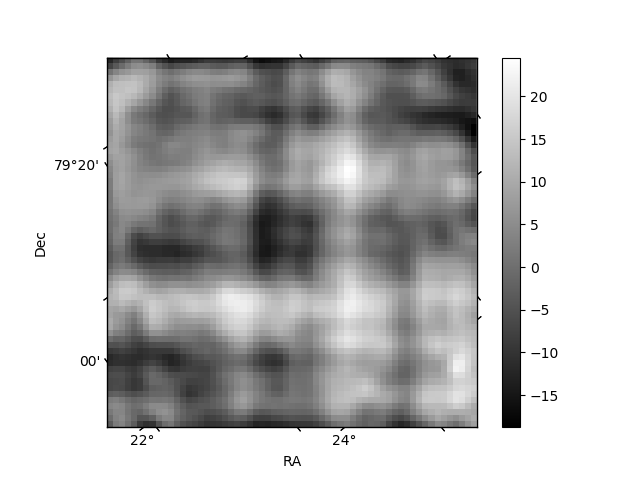
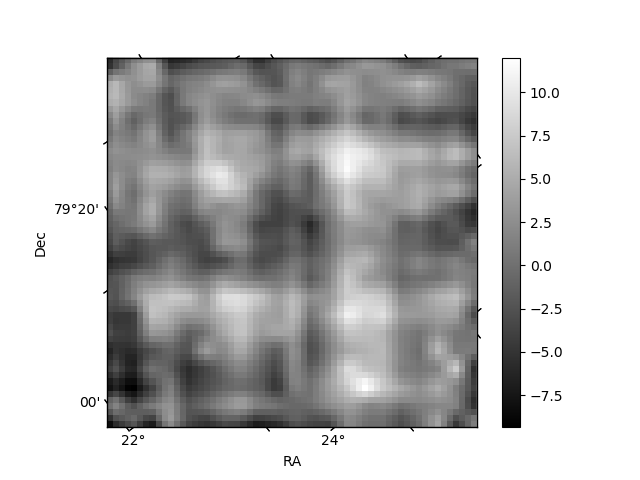
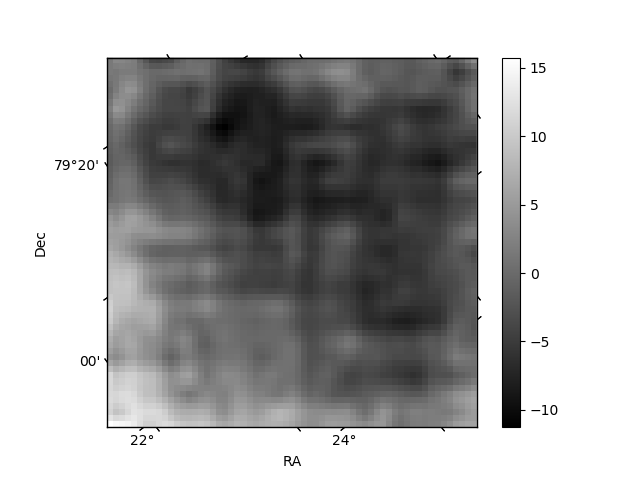
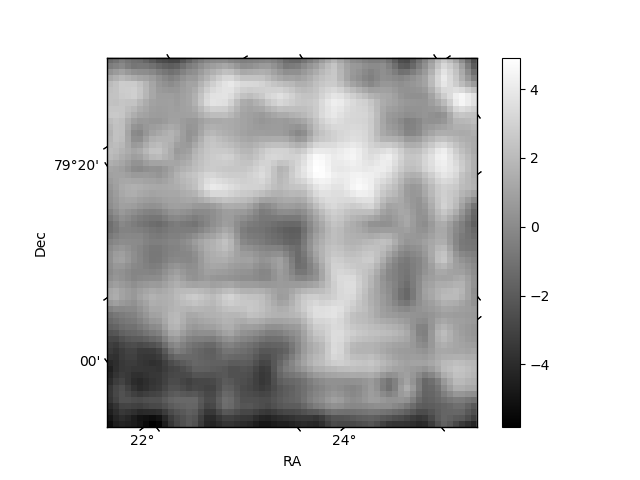
Histogram calculated using DETX and DETY for each event in the final _common_clean file
| Quadrant A | 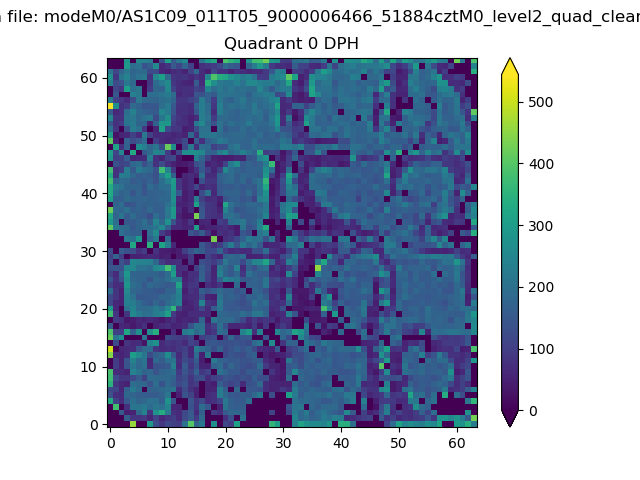 |
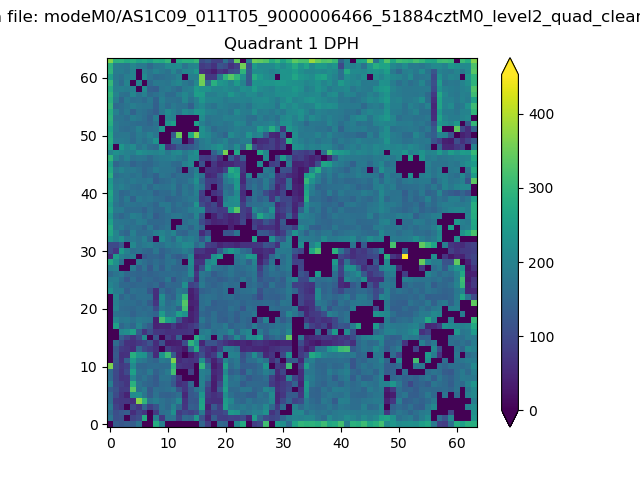 |
Quadrant B |
|---|---|---|---|
| Quadrant D | 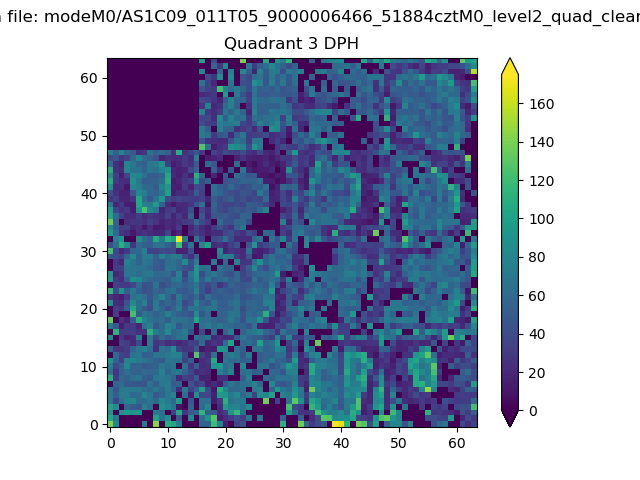 |
 |
Quadrant C |
| Plot type | Count rate plots | Images |
|---|---|---|
| Comparison with Poisson distribution Blue bars denote a histogram of data divided into 1 sec bins. Red curve is a Poisson curve with rate = median count rate of data. |
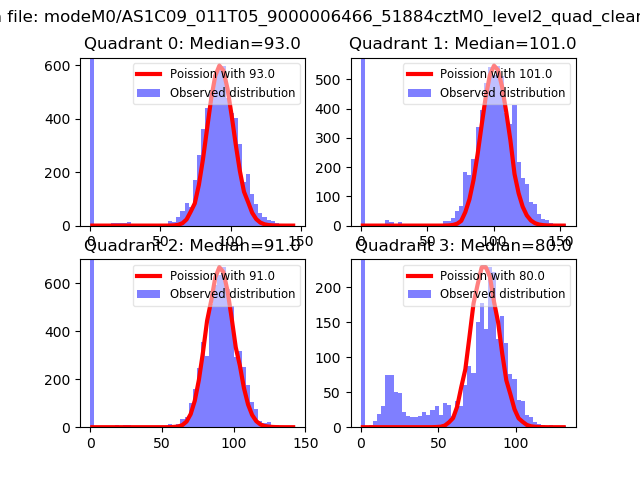 |
 |
| Quadrant-wise count rates Data is divided into 100 sec bins |
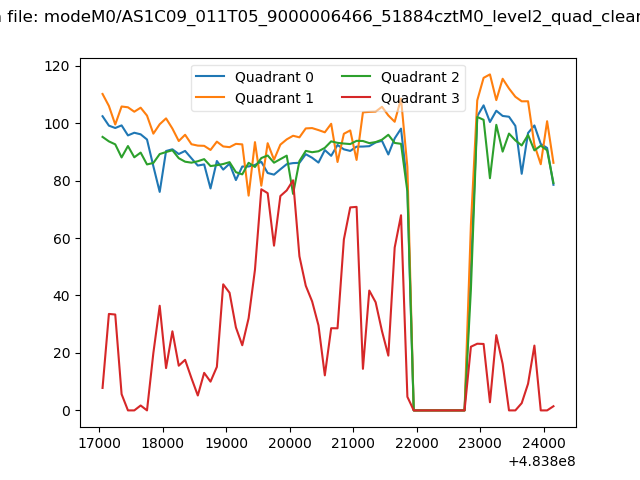 |
|
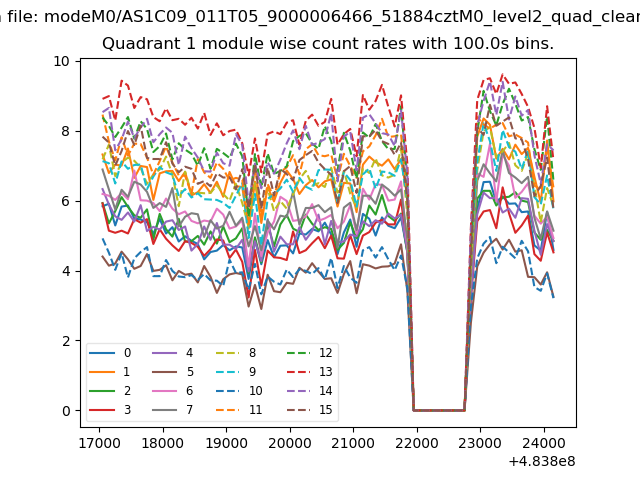
| Module-wise count rates for Quadrant A Data is divided into 100 sec bins |
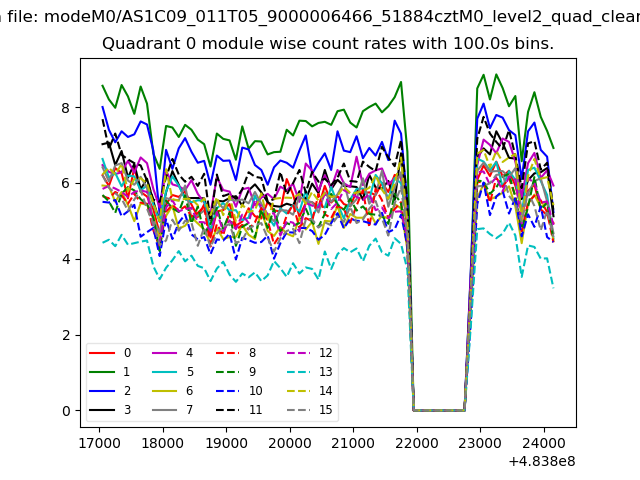 |
 |
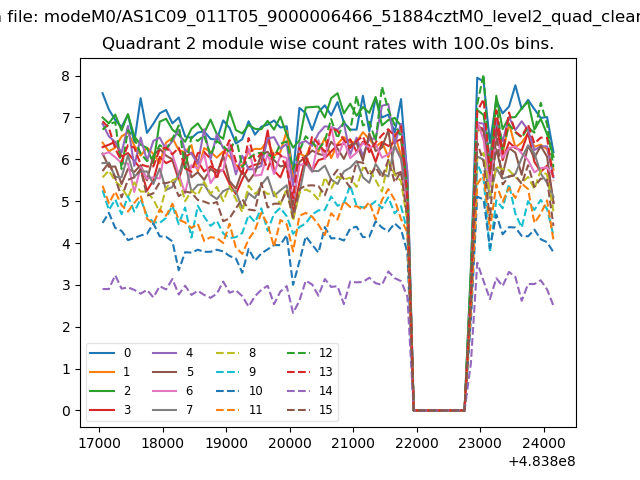
| Module-wise count rates for Quadrant B Data is divided into 100 sec bins |
 |
 |
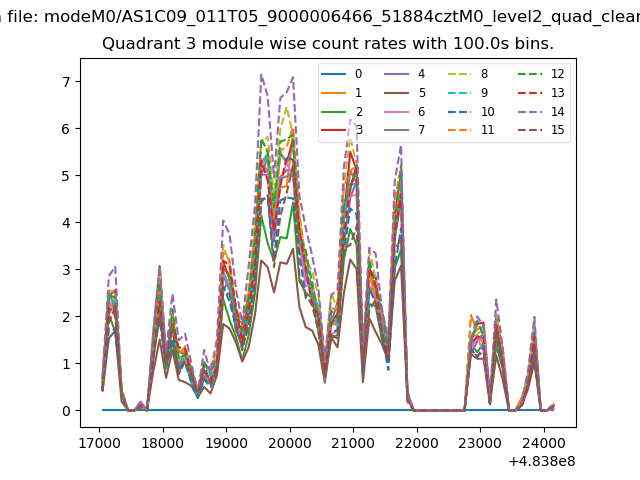
| Module-wise count rates for Quadrant C Data is divided into 100 sec bins |
 |
 |
| Module-wise count rates for Quadrant D Data is divided into 100 sec bins |
 |
 |
| Parameter | Plot |
|---|---|
| CZT HV Monitor | 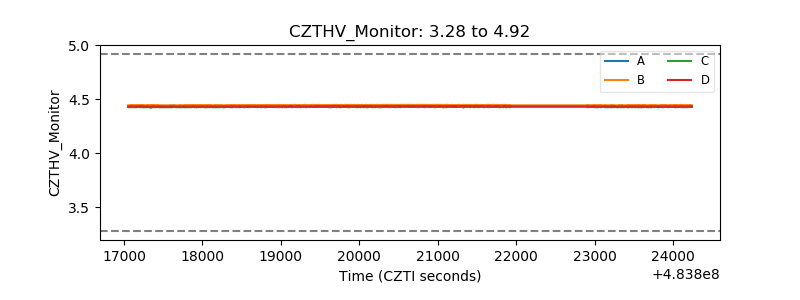 |
| D_VDD | 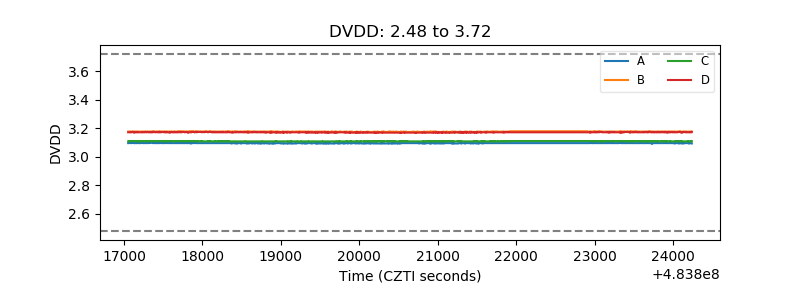 |
| Temperature 1 | 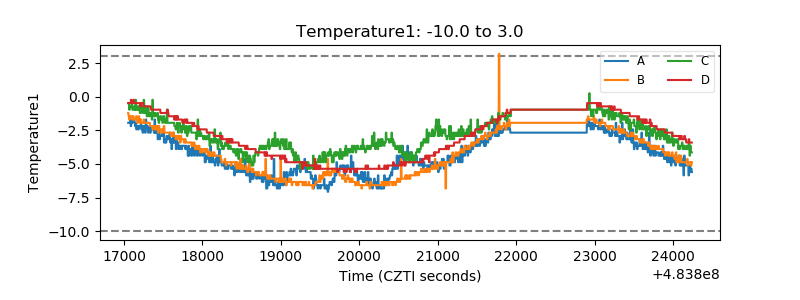 |
| Veto HV Monitor | 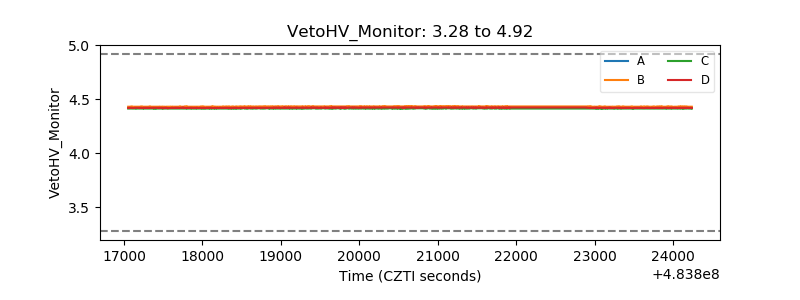 |
| Veto LLD | 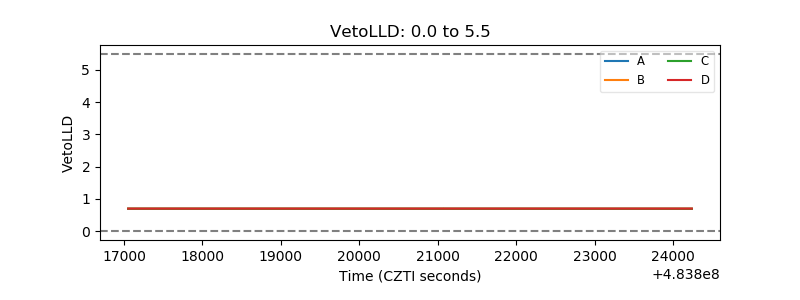 |
| Alpha Counter | 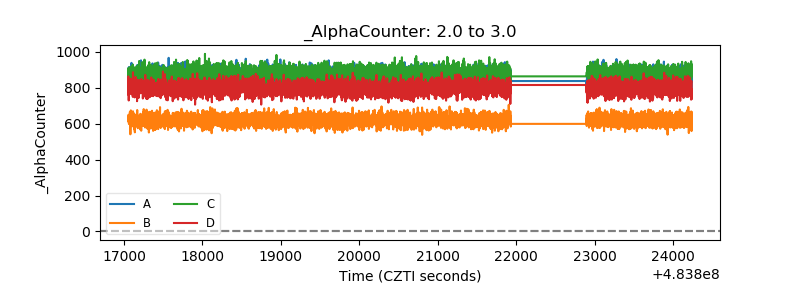 |
| _CPM_Rate | 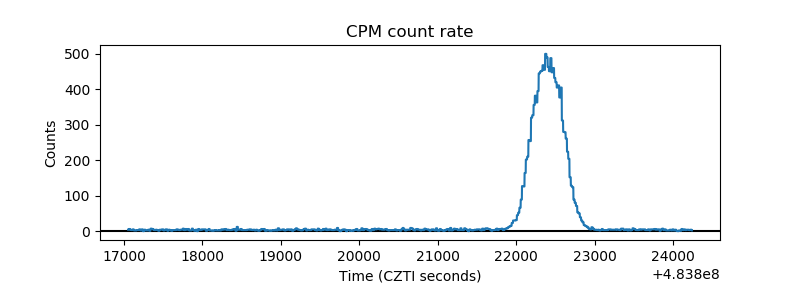 |
| CZT Counter | 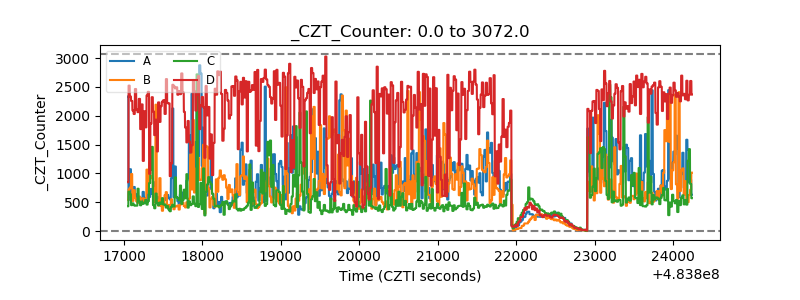 |
| +2.5 Volts monitor | 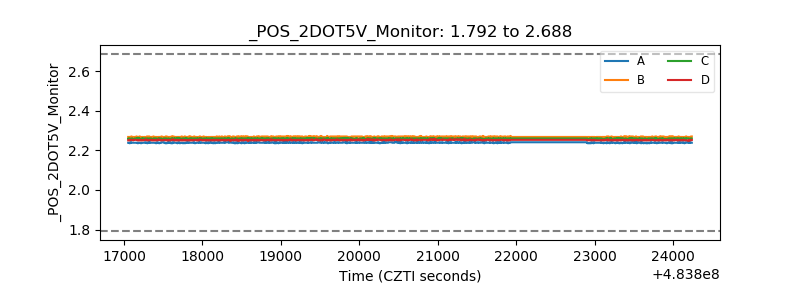 |
| +5 Volts monitor |  |
| _ROLL_ROT | 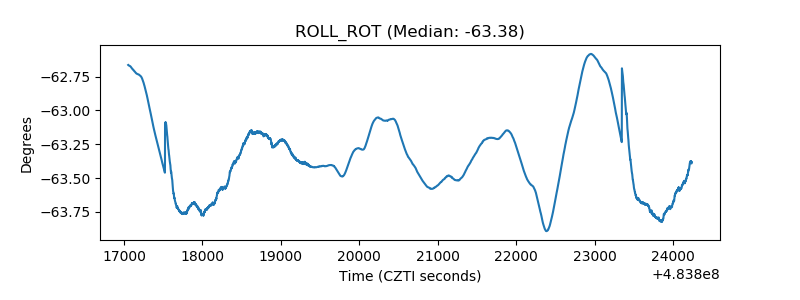 |
| _Roll_DEC | 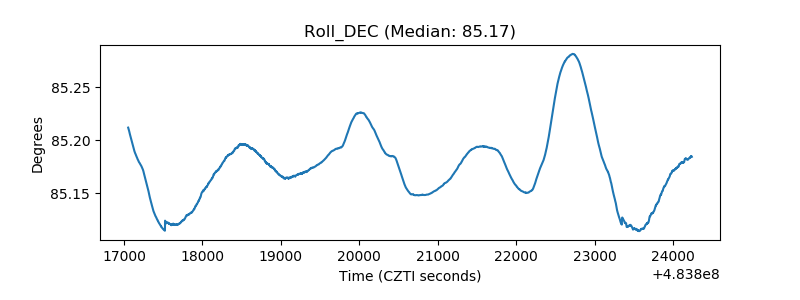 |
| _Roll_RA | 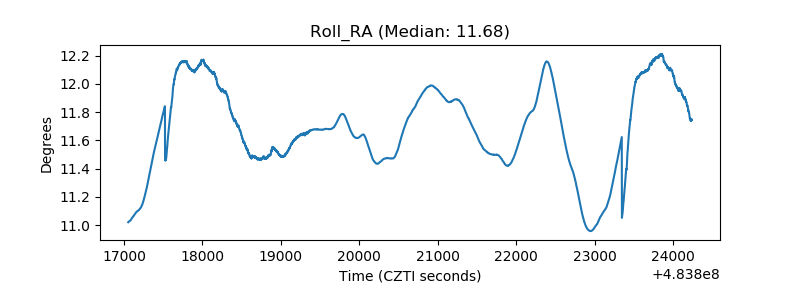 |
| Veto Counter | 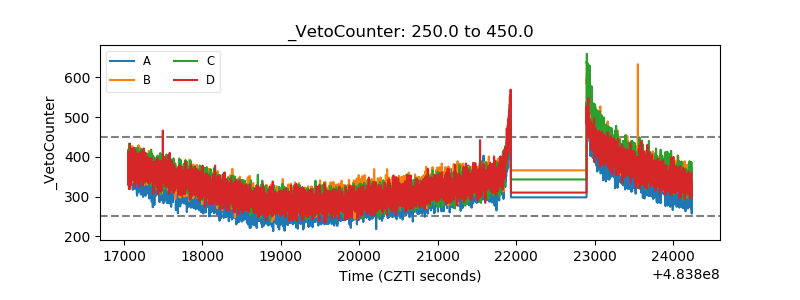 |