| Param | Original file | Final file |
|---|---|---|
| Filename | modeM0/AS1C09_011T05_9000006466_51885cztM0_level2.fits | modeM0/AS1C09_011T05_9000006466_51885cztM0_level2_quad_clean.evt |
| Size (bytes) | 807,647,040 | 82,324,800 |
| Size | 770.2 MB | 78.5 MB |
| Events in quadrant A | 7,152,332 | 579,561 |
| Events in quadrant B | 4,946,121 | 663,431 |
| Events in quadrant C | 4,537,475 | 595,223 |
| Events in quadrant D | 12,759,285 | 202,449 |
| Mode SS | |||
|---|---|---|---|
| Quadrant | BADHDUFLAG | Total packets | Discarded packets |
| A | 0 | 132 | 0 |
| B | 0 | 132 | 0 |
| C | 0 | 132 | 0 |
| D | 0 | 132 | 0 |
| Mode M0 | |||
|---|---|---|---|
| Quadrant | BADHDUFLAG | Total packets | Discarded packets |
| A | 0 | 25862 | 2 |
| B | 0 | 19319 | 2 |
| C | 0 | 18032 | 2 |
| D | 0 | 42372 | 9 |
| Mode M9 | |||
|---|---|---|---|
| Quadrant | BADHDUFLAG | Total packets | Discarded packets |
| A | 0 | 15 | 0 |
| B | 0 | 15 | 0 |
| C | 0 | 15 | 0 |
| D | 0 | 16 | 1 |
| Quadrant | Total seconds | Saturated seconds | Saturation percentage |
|---|---|---|---|
| A | 6477 | 602 | 9.294426% |
| B | 6477 | 303 | 4.678092% |
| C | 6477 | 328 | 5.064073% |
| D | 6476 | 4419 | 68.236566% |
Noise dominated data is calculated using 1-second bins in cleaned event files. If a bin has >2000 counts, and if more than 50% of those come from <1% of pixels, then it is considered to be noise-dominated and hence unusable.
| Quadrant | # 1 sec bins | Bins with >0 counts | Bins with >2000 counts | High rate bins dominated by noise | Noise dominated (total time) | Noise dominated (detector-on time) | Marked lightcurve |
|---|---|---|---|---|---|---|---|
| A | 7527 | 6478 | 417 | 417 | 5.54% | 6.44% | 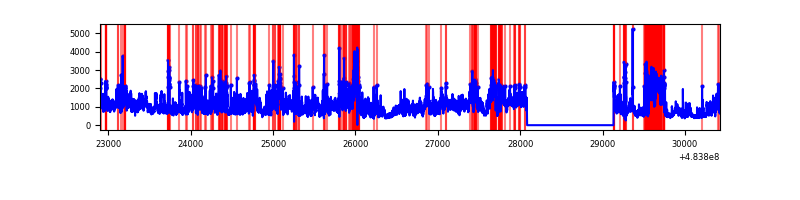 |
| B | 7527 | 6478 | 170 | 170 | 2.26% | 2.62% | 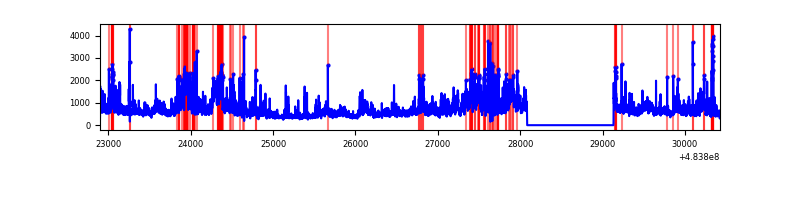 |
| C | 7527 | 6478 | 180 | 180 | 2.39% | 2.78% | 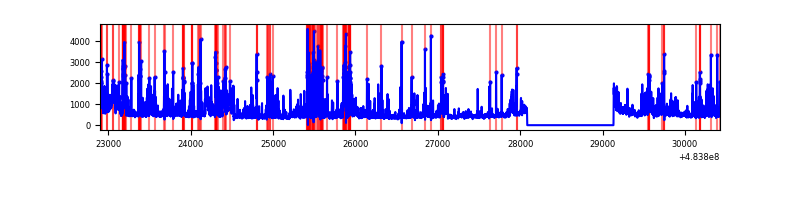 |
| D | 7526 | 6477 | 3411 | 3411 | 45.32% | 52.66% | 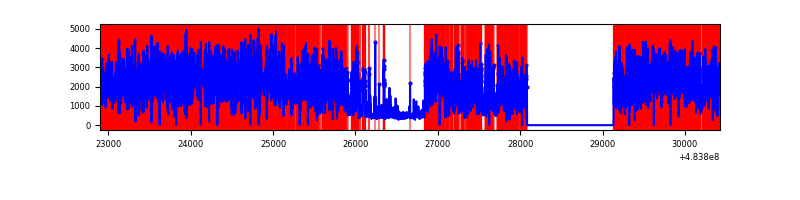 |
Top three noisy pixels from each quadrant. If the there are fewer than three noisy pixels in the level2.evt file, extra rows are filled as -1
| Pixel properties | Quadrant properties | ||||||
|---|---|---|---|---|---|---|---|
| Quadrant | DetID | PixID | Counts | Sigma | Mean | Median | Sigma |
| A | 12 | 3 | 1745915 | 10434.45 | 668 | 652 | 167.3 |
| A | 4 | 175 | 1083035 | 6471.27 | 668 | 652 | 167.3 |
| A | 11 | 3 | 528173 | 3153.9 | 668 | 652 | 167.3 |
| B | 10 | 44 | 897758 | 6238.99 | 680 | 657 | 143.8 |
| B | 4 | 170 | 351084 | 2437.08 | 680 | 657 | 143.8 |
| B | 0 | 171 | 273938 | 1900.56 | 680 | 657 | 143.8 |
| C | 14 | 245 | 614285 | 3330.38 | 669 | 664 | 184.2 |
| C | 13 | 3 | 372214 | 2016.56 | 669 | 664 | 184.2 |
| C | 0 | 176 | 160048 | 865.04 | 669 | 664 | 184.2 |
| D | 11 | 129 | 6839574 | 59414.83 | 404 | 390 | 115.1 |
| D | 12 | 17 | 2296460 | 19946.91 | 404 | 390 | 115.1 |
| D | 6 | 42 | 1109623 | 9636.37 | 404 | 390 | 115.1 |
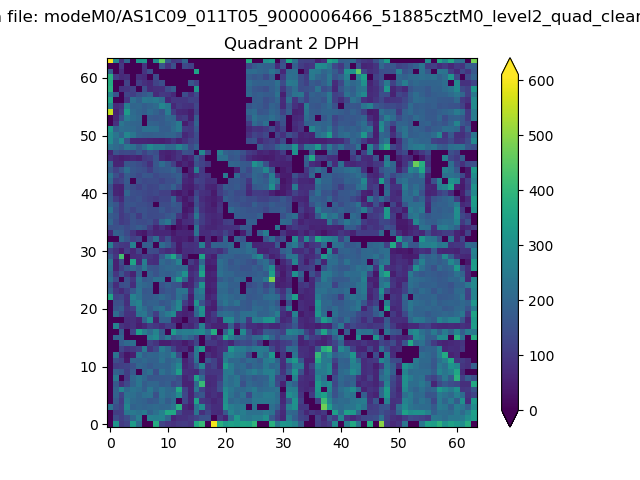
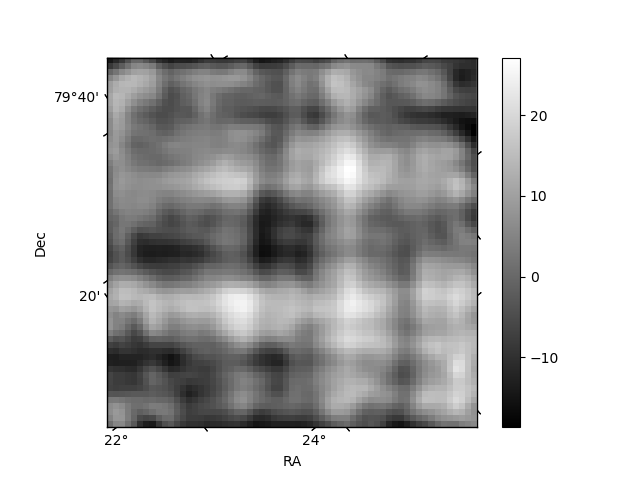
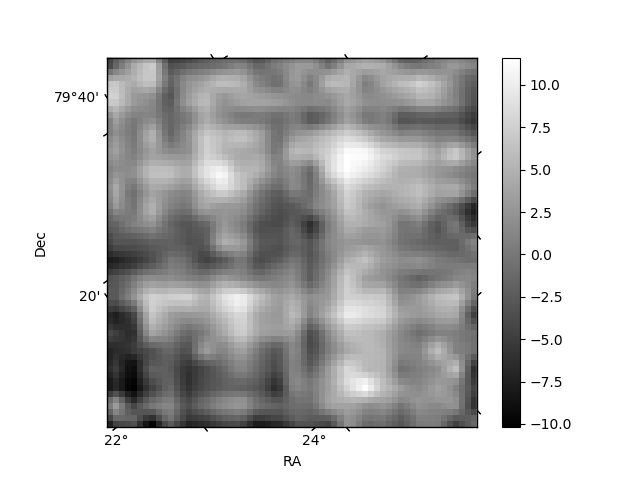
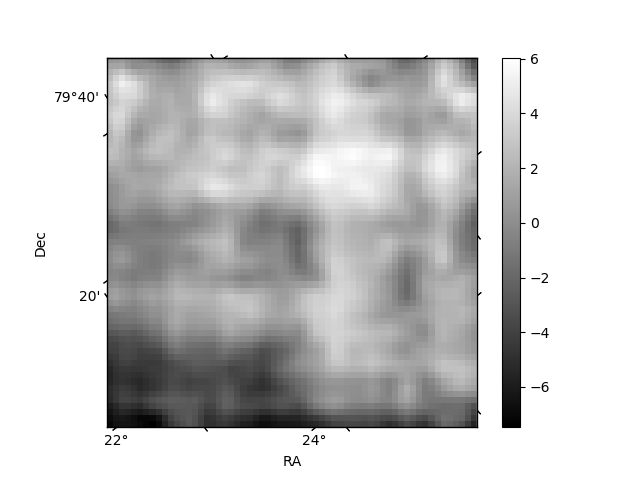
Histogram calculated using DETX and DETY for each event in the final _common_clean file
| Quadrant A | 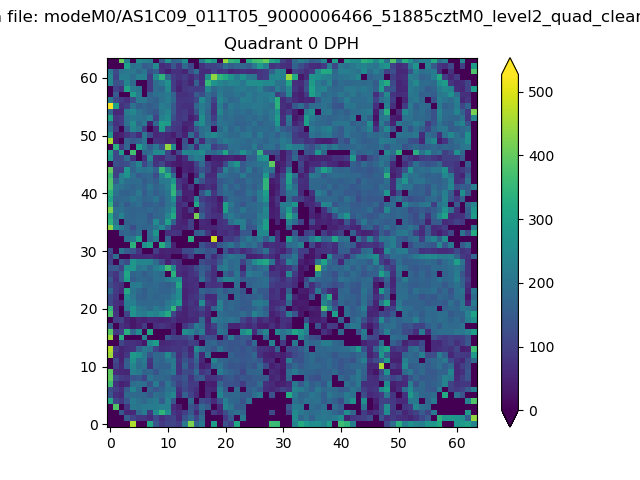 |
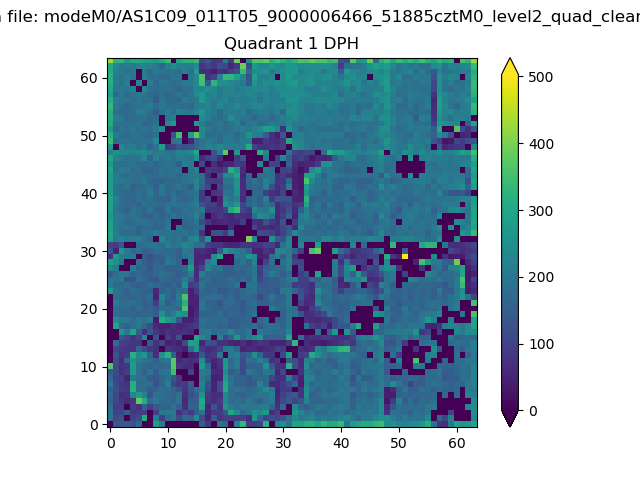 |
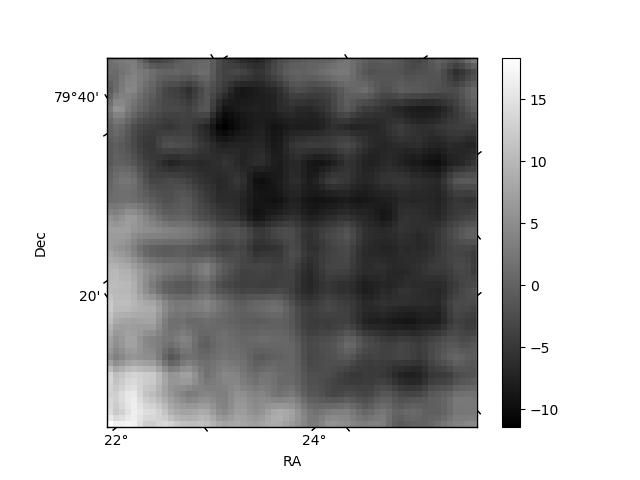
Quadrant B |
|---|---|---|---|
| Quadrant D | 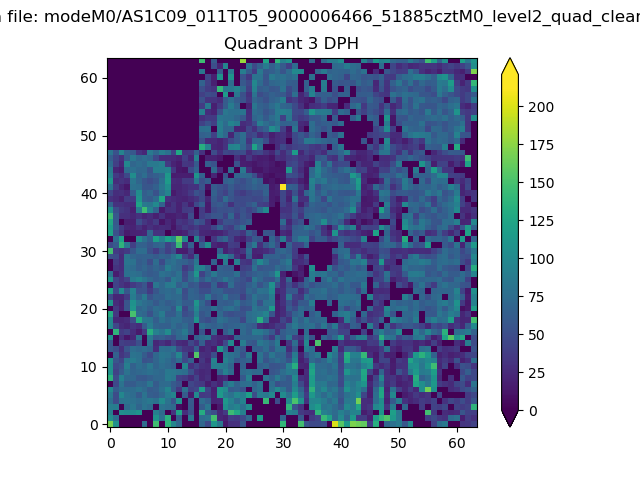 |
 |
Quadrant C |
| Plot type | Count rate plots | Images |
|---|---|---|
| Comparison with Poisson distribution Blue bars denote a histogram of data divided into 1 sec bins. Red curve is a Poisson curve with rate = median count rate of data. |
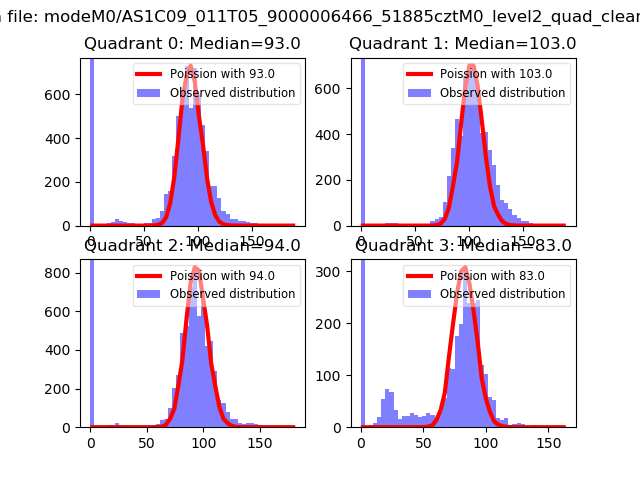 |
 |
| Quadrant-wise count rates Data is divided into 100 sec bins |
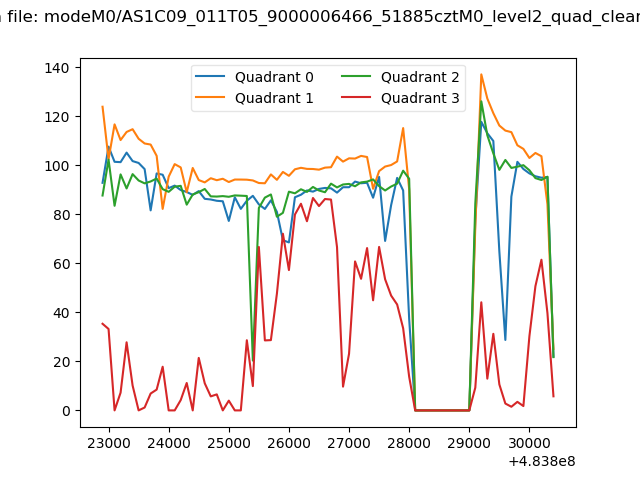 |
|
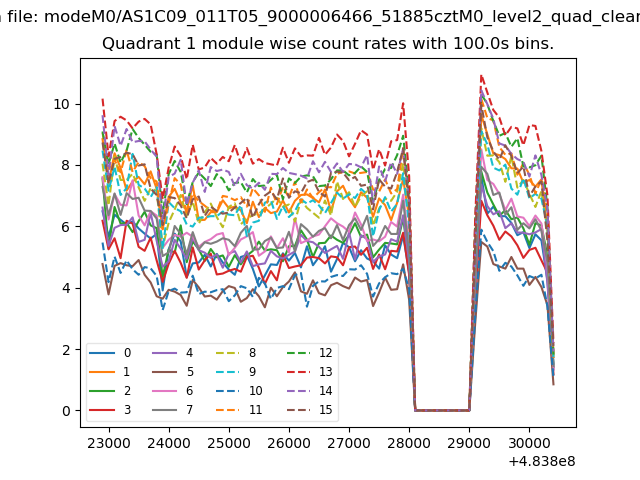
| Module-wise count rates for Quadrant A Data is divided into 100 sec bins |
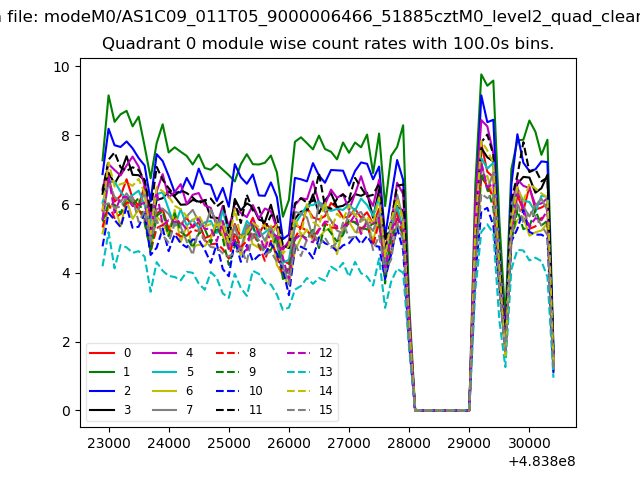 |
 |
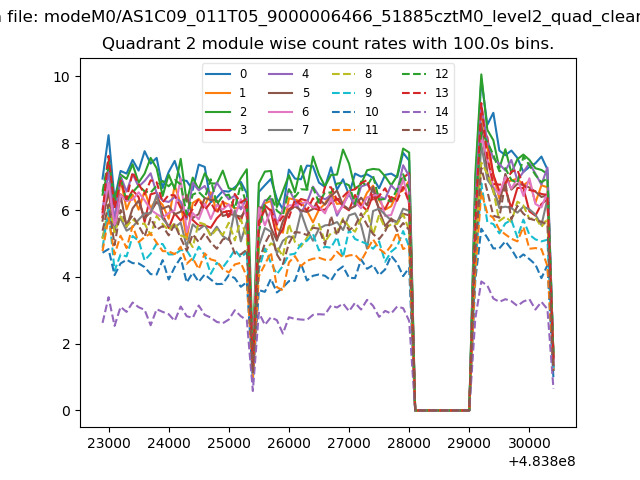
| Module-wise count rates for Quadrant B Data is divided into 100 sec bins |
 |
 |
| Module-wise count rates for Quadrant C Data is divided into 100 sec bins |
 |
 |
| Module-wise count rates for Quadrant D Data is divided into 100 sec bins |
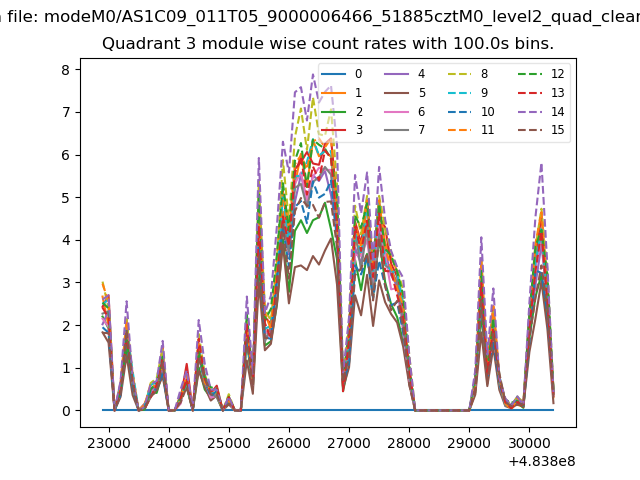 |
 |
| Parameter | Plot |
|---|---|
| CZT HV Monitor | 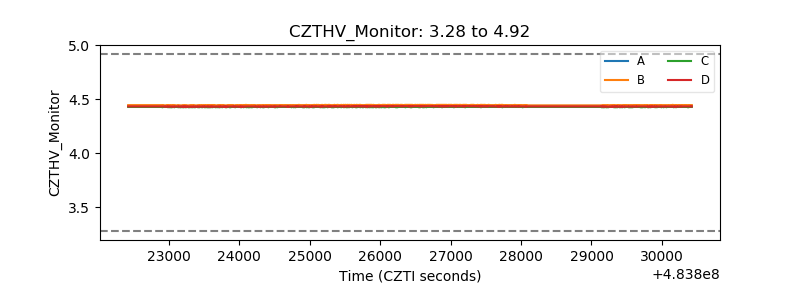 |
| D_VDD | 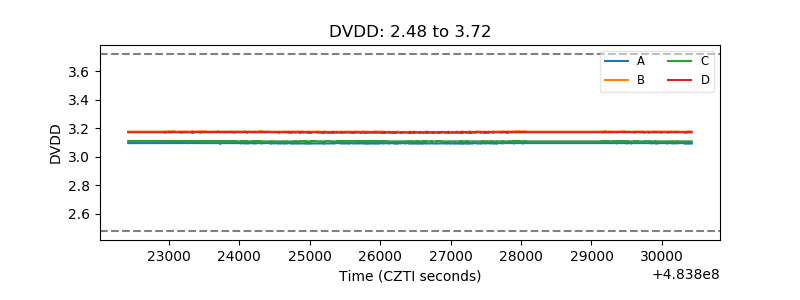 |
| Temperature 1 | 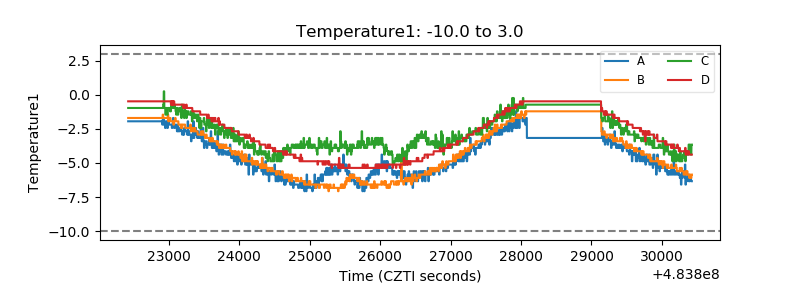 |
| Veto HV Monitor |  |
| Veto LLD | 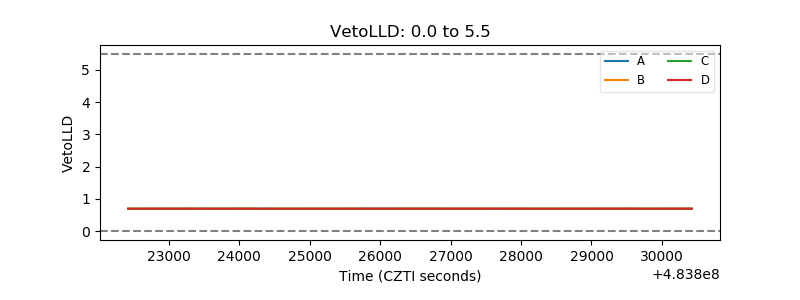 |
| Alpha Counter | 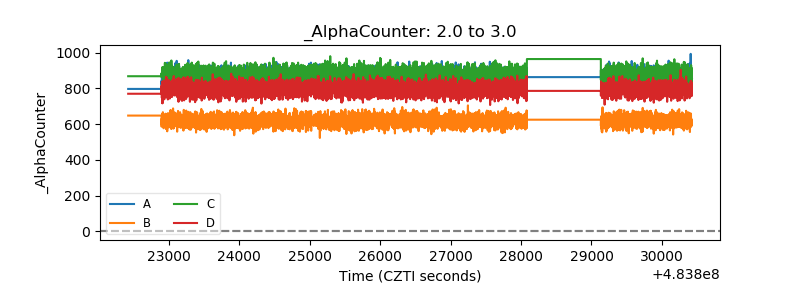 |
| _CPM_Rate | 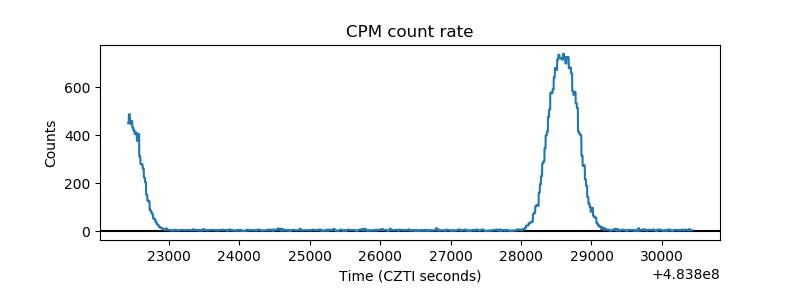 |
| CZT Counter | 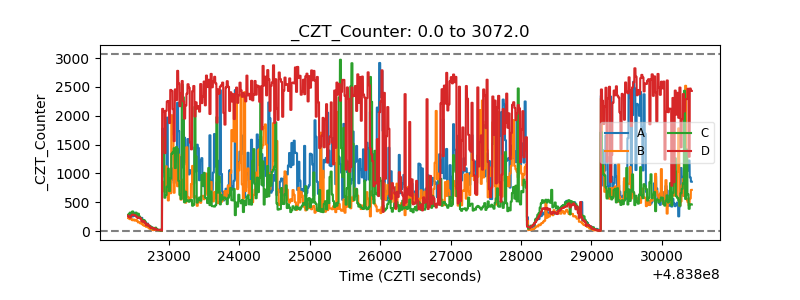 |
| +2.5 Volts monitor | 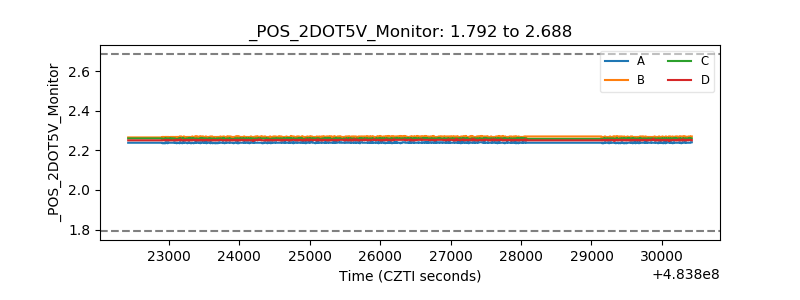 |
| +5 Volts monitor |  |
| _ROLL_ROT | 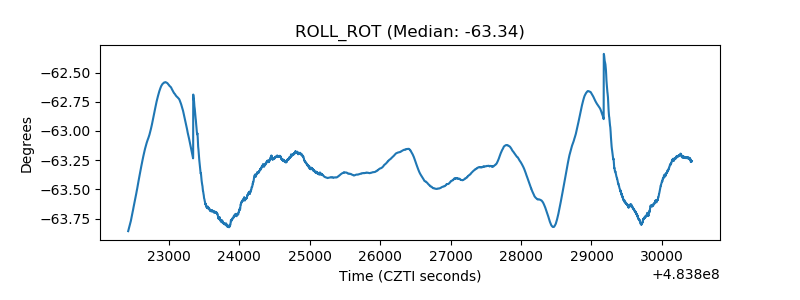 |
| _Roll_DEC | 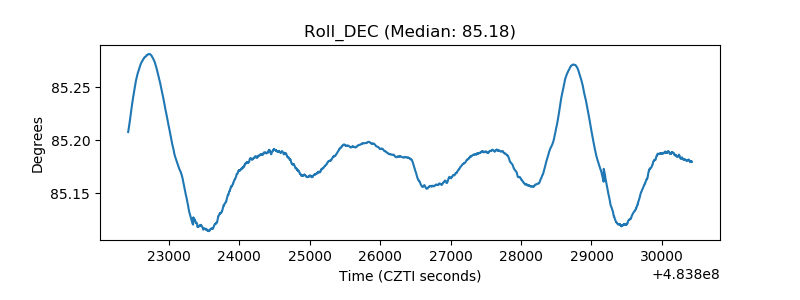 |
| _Roll_RA | 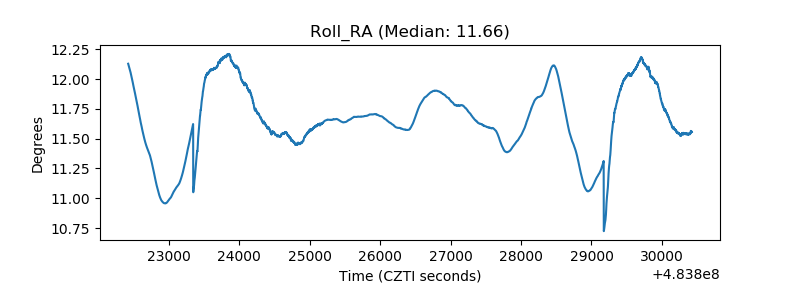 |
| Veto Counter | 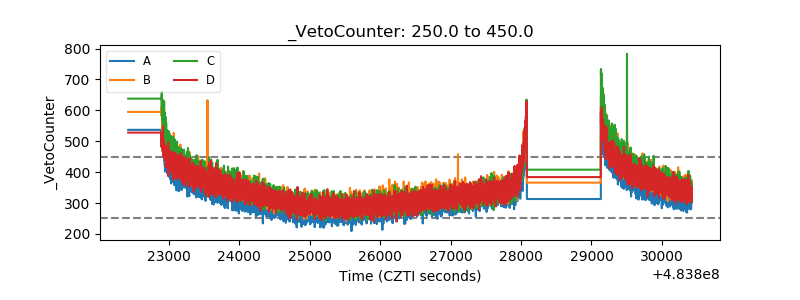 |