| Param | Original file | Final file |
|---|---|---|
| Filename | modeM0/AS1C09_011T05_9000006466_51886cztM0_level2.fits | modeM0/AS1C09_011T05_9000006466_51886cztM0_level2_quad_clean.evt |
| Size (bytes) | 733,766,400 | 85,348,800 |
| Size | 699.8 MB | 81.4 MB |
| Events in quadrant A | 5,734,851 | 599,775 |
| Events in quadrant B | 4,265,996 | 671,548 |
| Events in quadrant C | 4,419,774 | 605,511 |
| Events in quadrant D | 12,244,004 | 259,433 |
| Mode SS | |||
|---|---|---|---|
| Quadrant | BADHDUFLAG | Total packets | Discarded packets |
| A | 0 | 130 | 0 |
| B | 0 | 130 | 0 |
| C | 0 | 130 | 0 |
| D | 0 | 130 | 0 |
| Mode M0 | |||
|---|---|---|---|
| Quadrant | BADHDUFLAG | Total packets | Discarded packets |
| A | 0 | 21517 | 2 |
| B | 0 | 17104 | 3 |
| C | 0 | 17667 | 2 |
| D | 0 | 40832 | 2 |
| Mode M9 | |||
|---|---|---|---|
| Quadrant | BADHDUFLAG | Total packets | Discarded packets |
| A | 0 | 17 | 0 |
| B | 0 | 18 | 0 |
| C | 0 | 18 | 0 |
| D | 0 | 18 | 0 |
| Quadrant | Total seconds | Saturated seconds | Saturation percentage |
|---|---|---|---|
| A | 6419 | 346 | 5.390248% |
| B | 6418 | 160 | 2.492988% |
| C | 6418 | 276 | 4.300405% |
| D | 6418 | 3720 | 57.961982% |
Noise dominated data is calculated using 1-second bins in cleaned event files. If a bin has >2000 counts, and if more than 50% of those come from <1% of pixels, then it is considered to be noise-dominated and hence unusable.
| Quadrant | # 1 sec bins | Bins with >0 counts | Bins with >2000 counts | High rate bins dominated by noise | Noise dominated (total time) | Noise dominated (detector-on time) | Marked lightcurve |
|---|---|---|---|---|---|---|---|
| A | 7535 | 6420 | 278 | 278 | 3.69% | 4.33% | 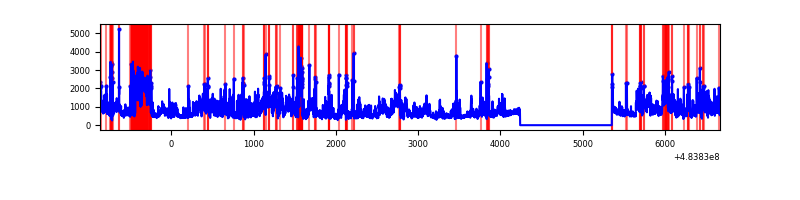 |
| B | 7534 | 6419 | 73 | 73 | 0.97% | 1.14% | 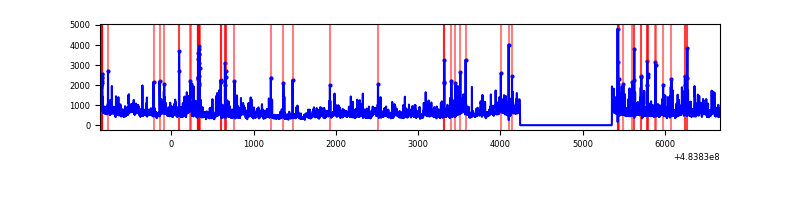 |
| C | 7534 | 6419 | 198 | 198 | 2.63% | 3.08% | 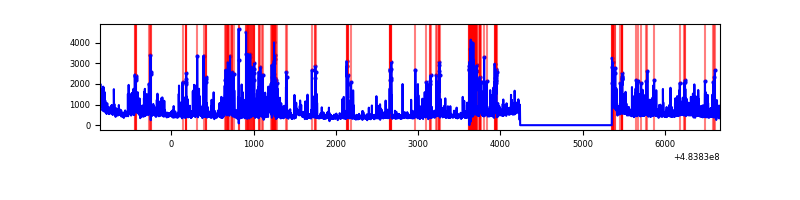 |
| D | 7534 | 6418 | 3073 | 3073 | 40.79% | 47.88% | 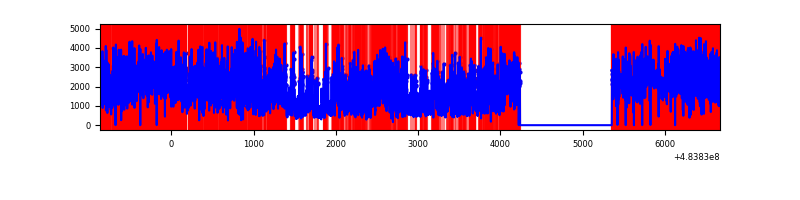 |
Top three noisy pixels from each quadrant. If the there are fewer than three noisy pixels in the level2.evt file, extra rows are filled as -1
| Pixel properties | Quadrant properties | ||||||
|---|---|---|---|---|---|---|---|
| Quadrant | DetID | PixID | Counts | Sigma | Mean | Median | Sigma |
| A | 12 | 3 | 1273716 | 7466.17 | 670 | 652 | 170.5 |
| A | 4 | 175 | 455442 | 2667.22 | 670 | 652 | 170.5 |
| A | 11 | 3 | 448302 | 2625.34 | 670 | 652 | 170.5 |
| B | 0 | 171 | 237756 | 1669.2 | 676 | 655 | 142.0 |
| B | 10 | 254 | 210169 | 1474.99 | 676 | 655 | 142.0 |
| B | 4 | 170 | 196226 | 1376.83 | 676 | 655 | 142.0 |
| C | 14 | 245 | 708009 | 3886.87 | 666 | 662 | 182.0 |
| C | 15 | 231 | 146403 | 800.85 | 666 | 662 | 182.0 |
| C | 15 | 219 | 130396 | 712.89 | 666 | 662 | 182.0 |
| D | 11 | 129 | 6267062 | 49806.92 | 437 | 419 | 125.8 |
| D | 12 | 17 | 1743100 | 13850.73 | 437 | 419 | 125.8 |
| D | 3 | 12 | 1181621 | 9388.13 | 437 | 419 | 125.8 |
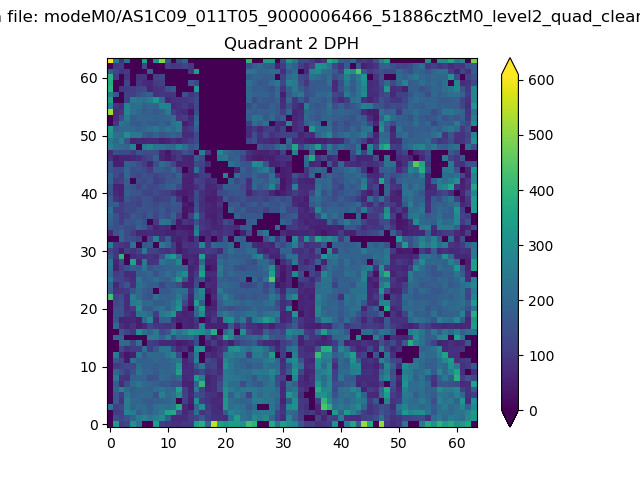
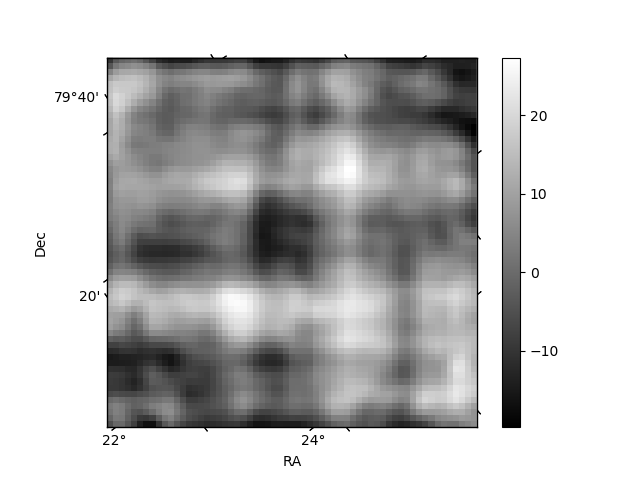
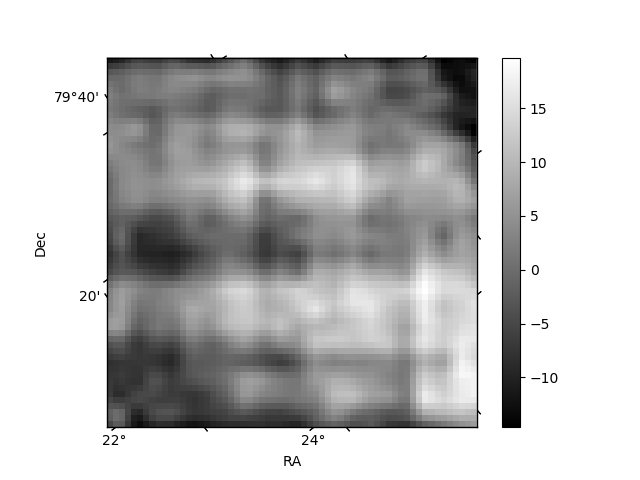
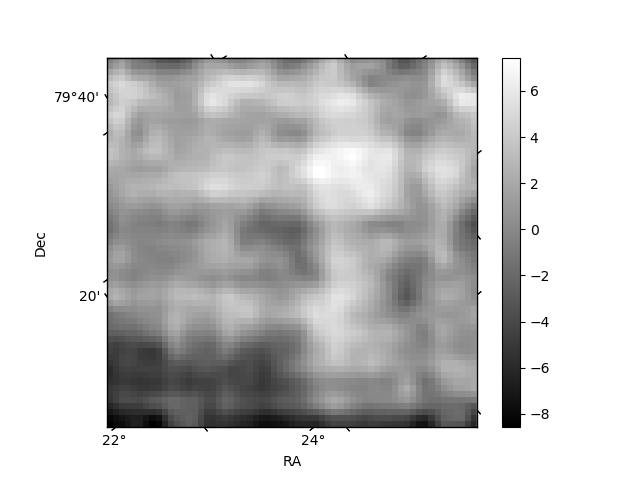
Histogram calculated using DETX and DETY for each event in the final _common_clean file
| Quadrant A | 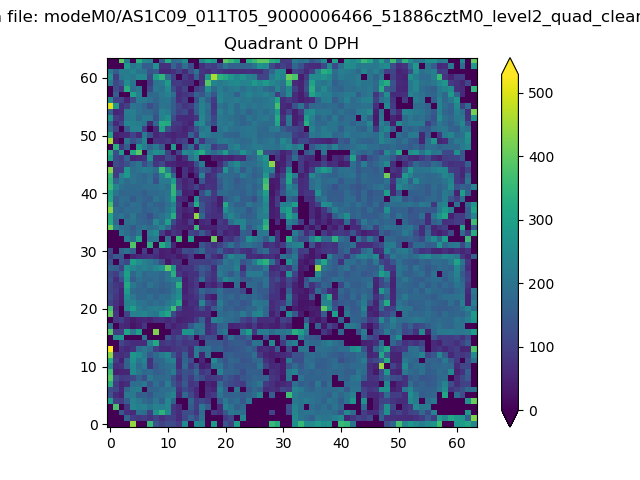 |
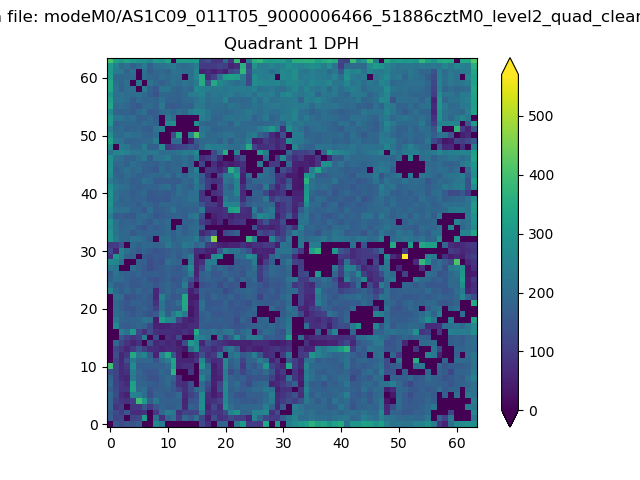 |
Quadrant B |
|---|---|---|---|
| Quadrant D | 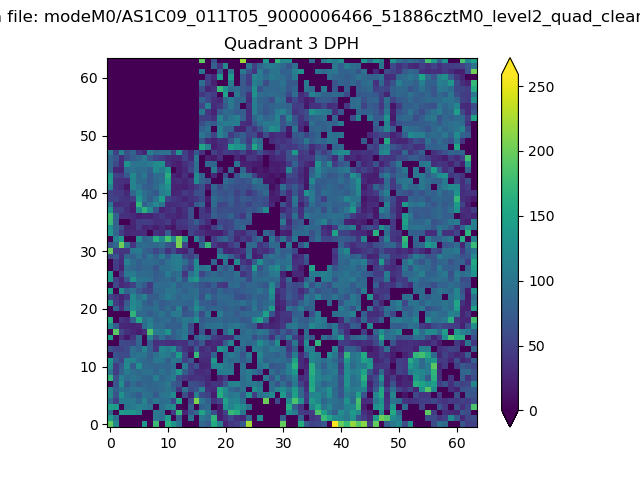 |
 |
Quadrant C |
| Plot type | Count rate plots | Images |
|---|---|---|
| Comparison with Poisson distribution Blue bars denote a histogram of data divided into 1 sec bins. Red curve is a Poisson curve with rate = median count rate of data. |
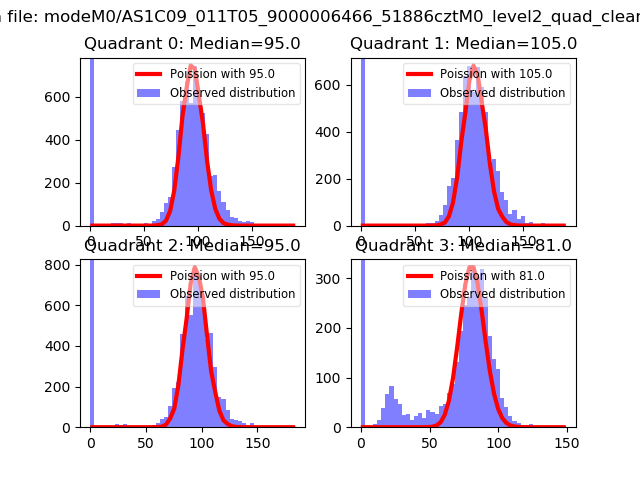 |
 |
| Quadrant-wise count rates Data is divided into 100 sec bins |
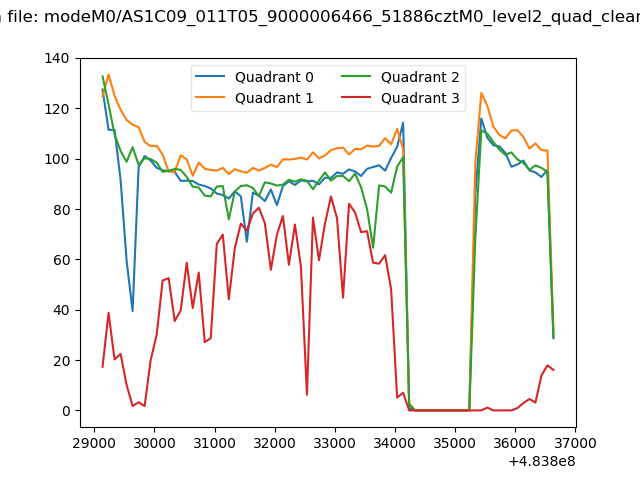 |
|
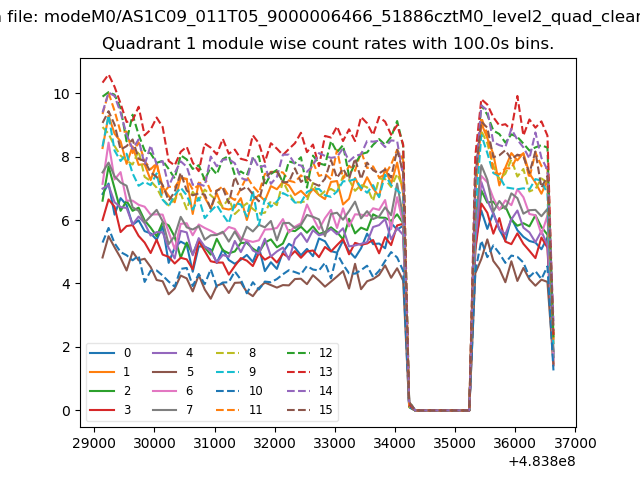
| Module-wise count rates for Quadrant A Data is divided into 100 sec bins |
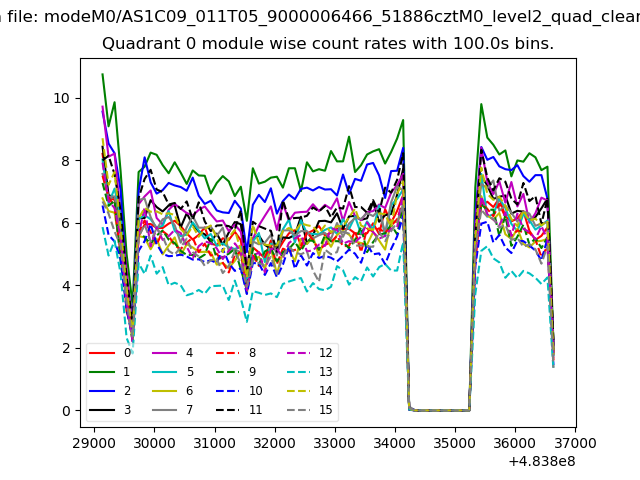 |
 |
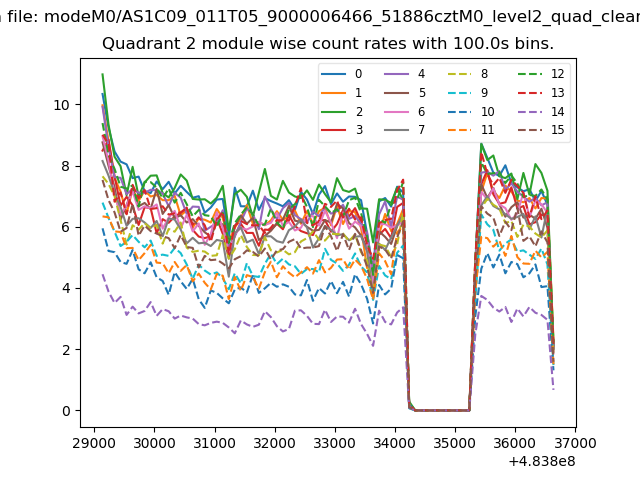
| Module-wise count rates for Quadrant B Data is divided into 100 sec bins |
 |
 |
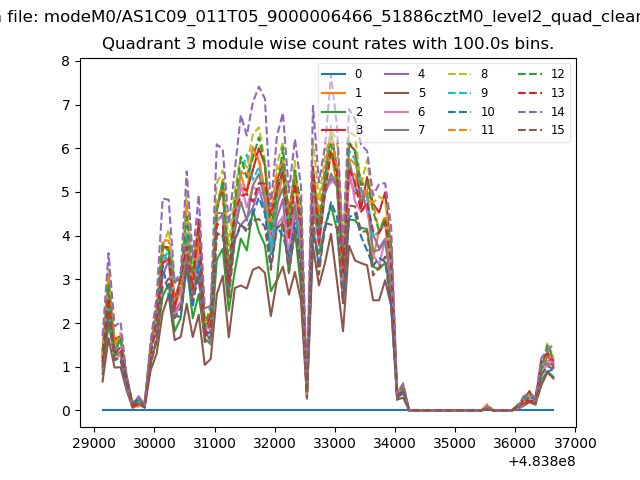
| Module-wise count rates for Quadrant C Data is divided into 100 sec bins |
 |
 |
| Module-wise count rates for Quadrant D Data is divided into 100 sec bins |
 |
 |
| Parameter | Plot |
|---|---|
| CZT HV Monitor | 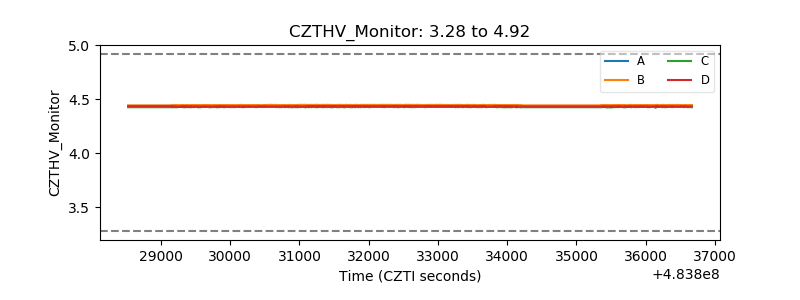 |
| D_VDD | 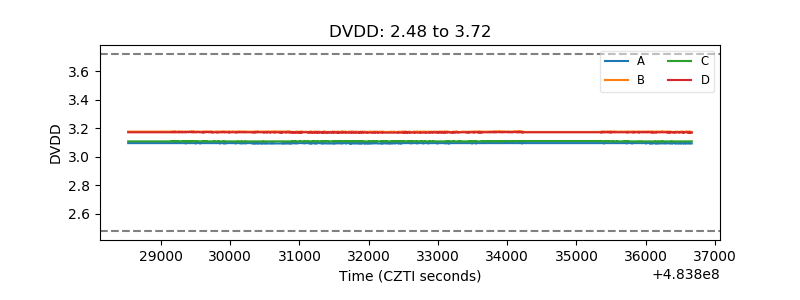 |
| Temperature 1 | 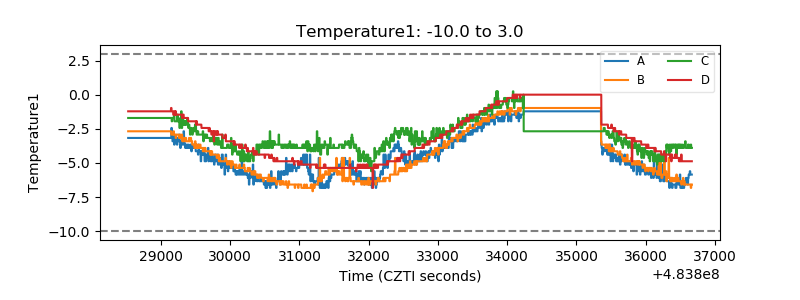 |
| Veto HV Monitor | 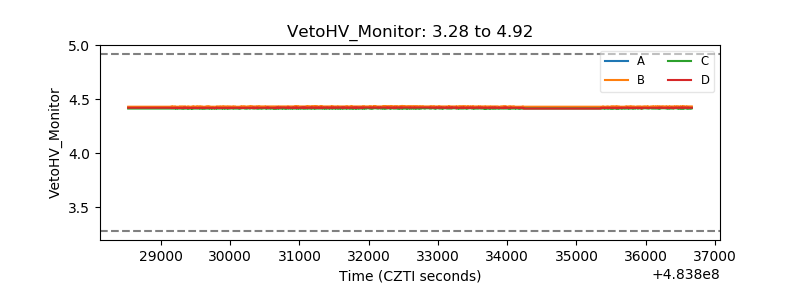 |
| Veto LLD | 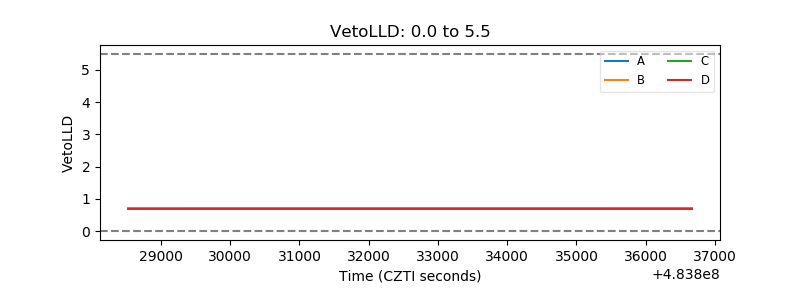 |
| Alpha Counter | 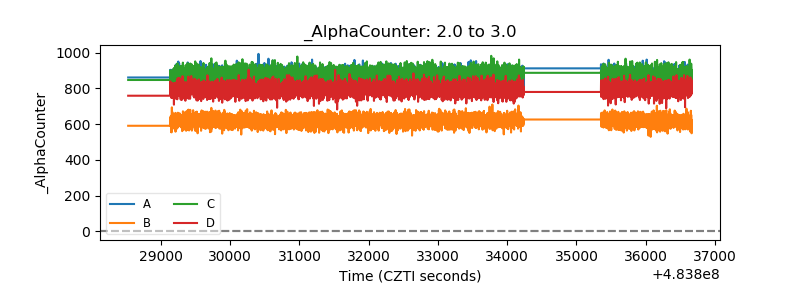 |
| _CPM_Rate | 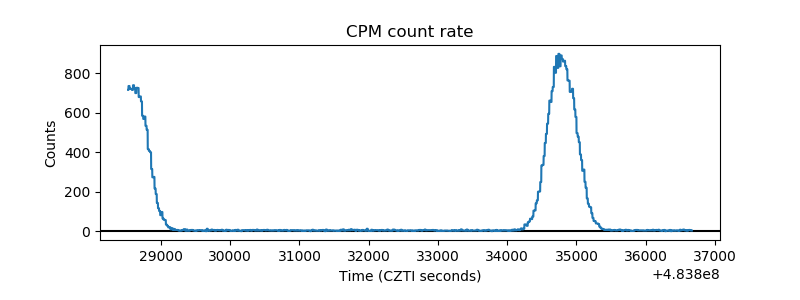 |
| CZT Counter | 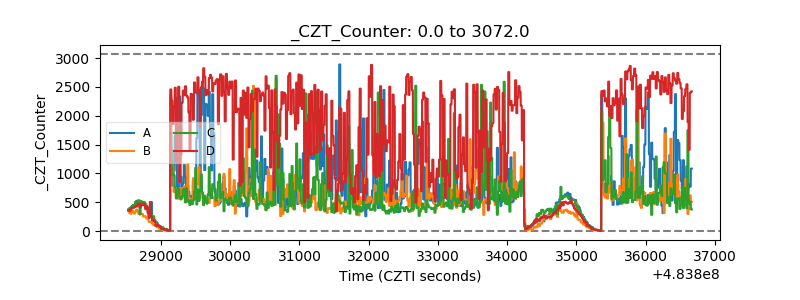 |
| +2.5 Volts monitor | 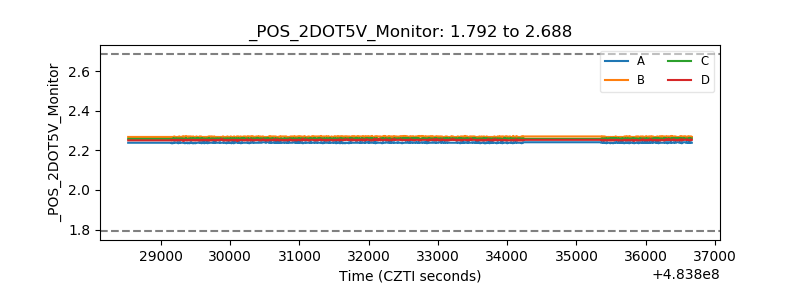 |
| +5 Volts monitor |  |
| _ROLL_ROT | 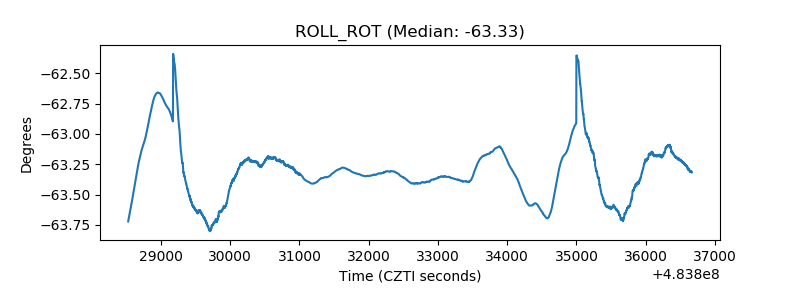 |
| _Roll_DEC | 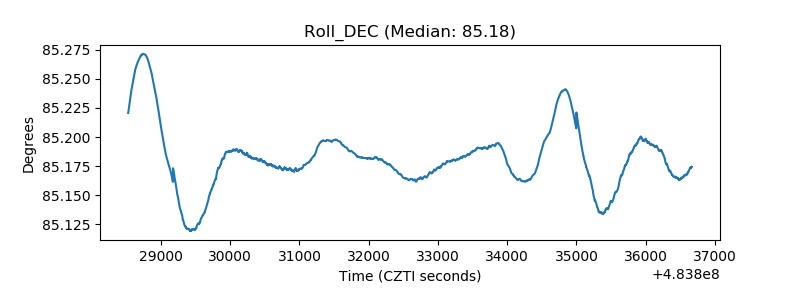 |
| _Roll_RA | 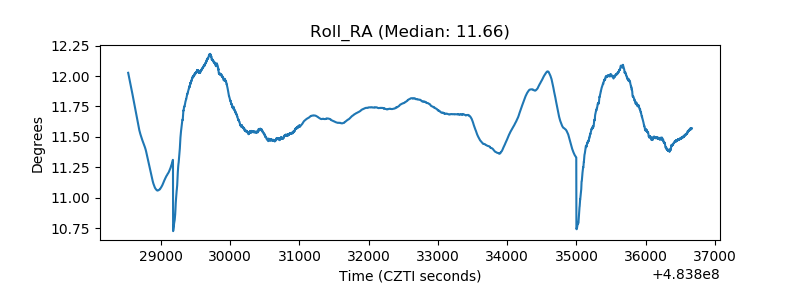 |
| Veto Counter | 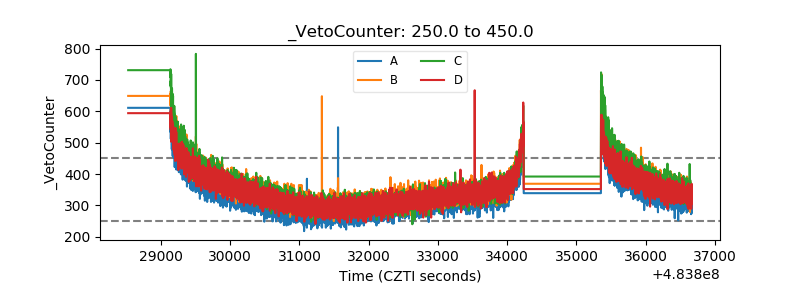 |