| Param | Original file | Final file |
|---|---|---|
| Filename | modeM0/AS1C09_011T05_9000006466_51887cztM0_level2.fits | modeM0/AS1C09_011T05_9000006466_51887cztM0_level2_quad_clean.evt |
| Size (bytes) | 836,841,600 | 87,744,960 |
| Size | 798.1 MB | 83.7 MB |
| Events in quadrant A | 6,002,806 | 635,049 |
| Events in quadrant B | 5,890,415 | 703,831 |
| Events in quadrant C | 4,601,165 | 632,794 |
| Events in quadrant D | 13,954,782 | 209,610 |
| Mode SS | |||
|---|---|---|---|
| Quadrant | BADHDUFLAG | Total packets | Discarded packets |
| A | 0 | 138 | 0 |
| B | 0 | 138 | 0 |
| C | 0 | 138 | 0 |
| D | 0 | 138 | 0 |
| Mode M0 | |||
|---|---|---|---|
| Quadrant | BADHDUFLAG | Total packets | Discarded packets |
| A | 0 | 22649 | 2 |
| B | 0 | 22224 | 2 |
| C | 0 | 18435 | 2 |
| D | 0 | 46162 | 2 |
| Mode M9 | |||
|---|---|---|---|
| Quadrant | BADHDUFLAG | Total packets | Discarded packets |
| A | 0 | 14 | 0 |
| B | 0 | 15 | 0 |
| C | 0 | 15 | 0 |
| D | 0 | 15 | 0 |
| Quadrant | Total seconds | Saturated seconds | Saturation percentage |
|---|---|---|---|
| A | 6823 | 321 | 4.704675% |
| B | 6823 | 326 | 4.777957% |
| C | 6823 | 261 | 3.825297% |
| D | 6823 | 4676 | 68.532903% |
Noise dominated data is calculated using 1-second bins in cleaned event files. If a bin has >2000 counts, and if more than 50% of those come from <1% of pixels, then it is considered to be noise-dominated and hence unusable.
| Quadrant | # 1 sec bins | Bins with >0 counts | Bins with >2000 counts | High rate bins dominated by noise | Noise dominated (total time) | Noise dominated (detector-on time) | Marked lightcurve |
|---|---|---|---|---|---|---|---|
| A | 7943 | 6824 | 202 | 202 | 2.54% | 2.96% | 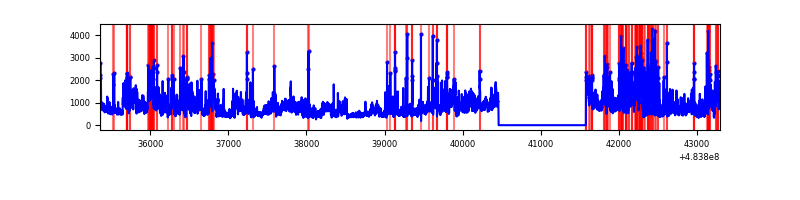 |
| B | 7943 | 6824 | 167 | 167 | 2.10% | 2.45% | 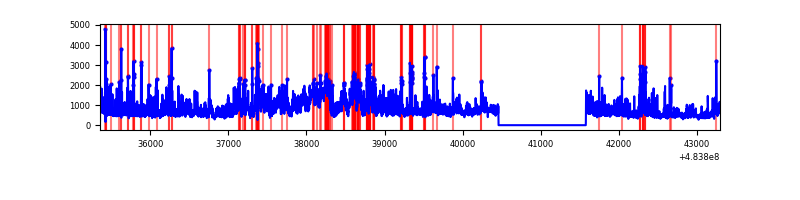 |
| C | 7943 | 6824 | 141 | 141 | 1.78% | 2.07% | 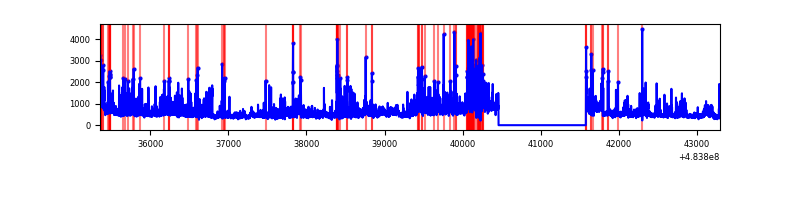 |
| D | 7943 | 6821 | 3781 | 3781 | 47.60% | 55.43% | 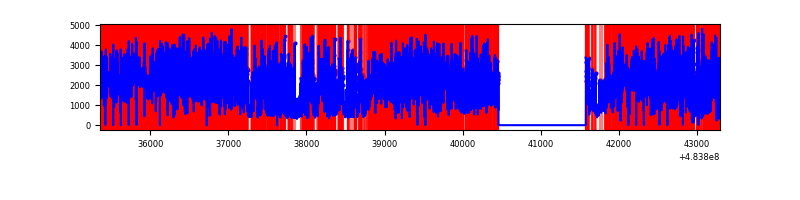 |
Top three noisy pixels from each quadrant. If the there are fewer than three noisy pixels in the level2.evt file, extra rows are filled as -1
| Pixel properties | Quadrant properties | ||||||
|---|---|---|---|---|---|---|---|
| Quadrant | DetID | PixID | Counts | Sigma | Mean | Median | Sigma |
| A | 12 | 3 | 1483805 | 8447.74 | 703 | 685 | 175.6 |
| A | 4 | 175 | 481435 | 2738.32 | 703 | 685 | 175.6 |
| A | 11 | 3 | 294889 | 1675.76 | 703 | 685 | 175.6 |
| B | 10 | 254 | 1566645 | 10465.8 | 710 | 687 | 149.6 |
| B | 0 | 172 | 306994 | 2047.15 | 710 | 687 | 149.6 |
| B | 4 | 170 | 282018 | 1880.23 | 710 | 687 | 149.6 |
| C | 14 | 245 | 356757 | 1861.14 | 697 | 694 | 191.3 |
| C | 13 | 3 | 228231 | 1189.34 | 697 | 694 | 191.3 |
| C | 15 | 178 | 157395 | 819.08 | 697 | 694 | 191.3 |
| D | 11 | 129 | 8096449 | 70659.3 | 400 | 384 | 114.6 |
| D | 6 | 42 | 1332930 | 11629.94 | 400 | 384 | 114.6 |
| D | 12 | 17 | 865792 | 7552.94 | 400 | 384 | 114.6 |
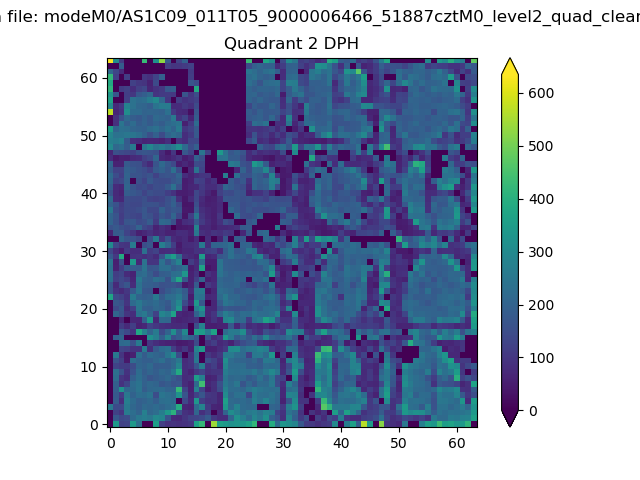
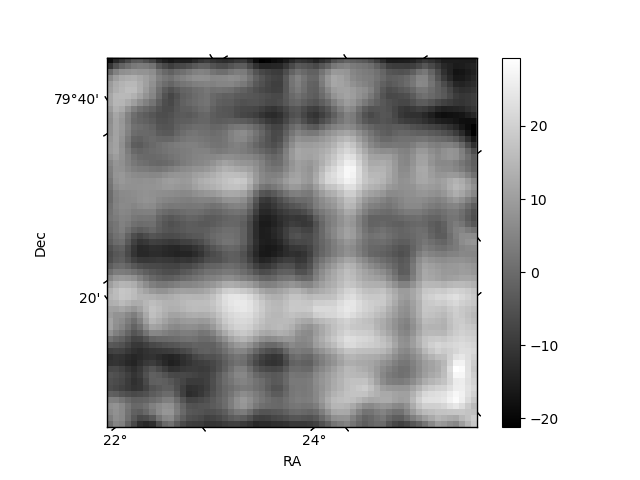
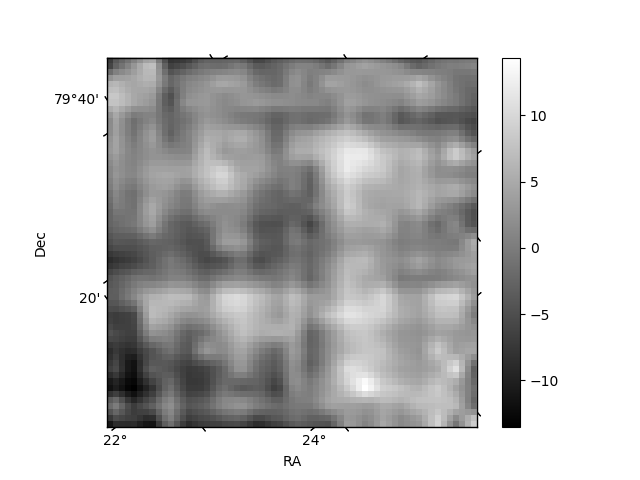
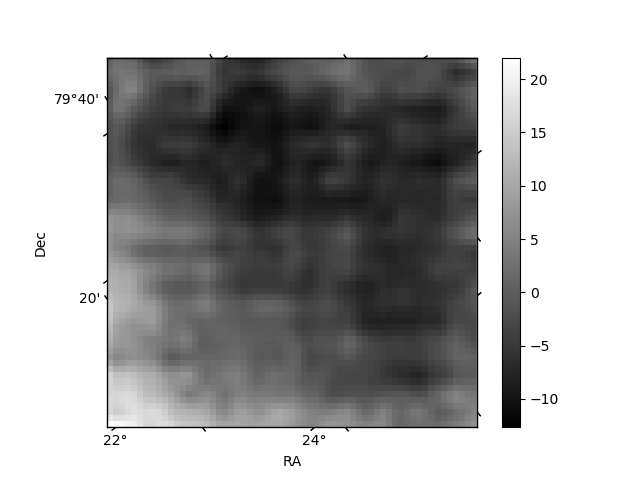
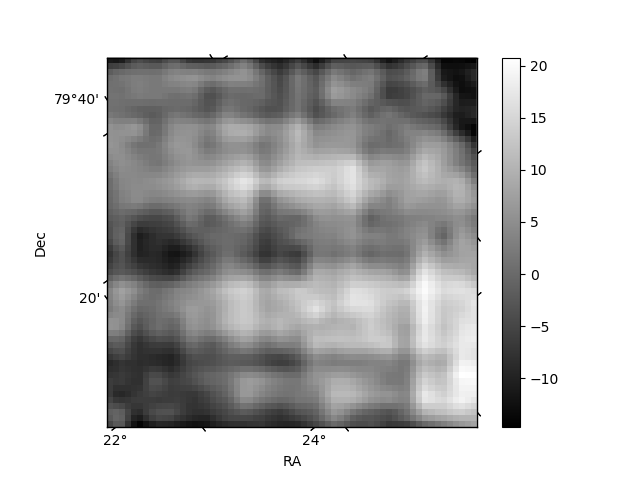
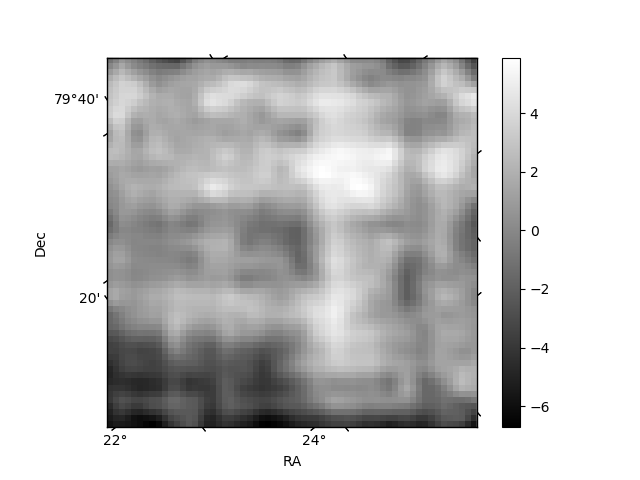
Histogram calculated using DETX and DETY for each event in the final _common_clean file
| Quadrant A | 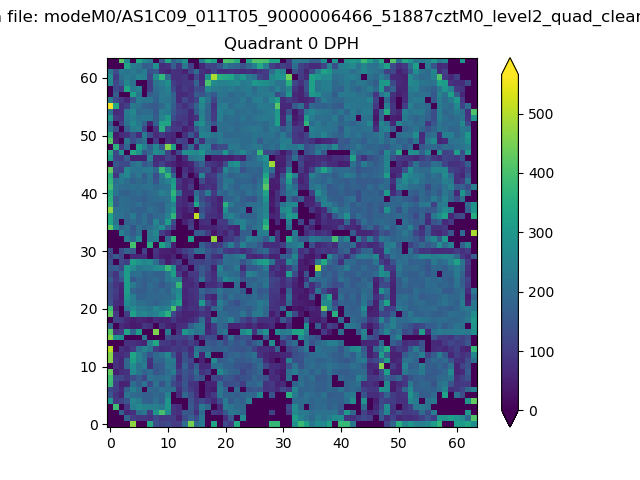 |
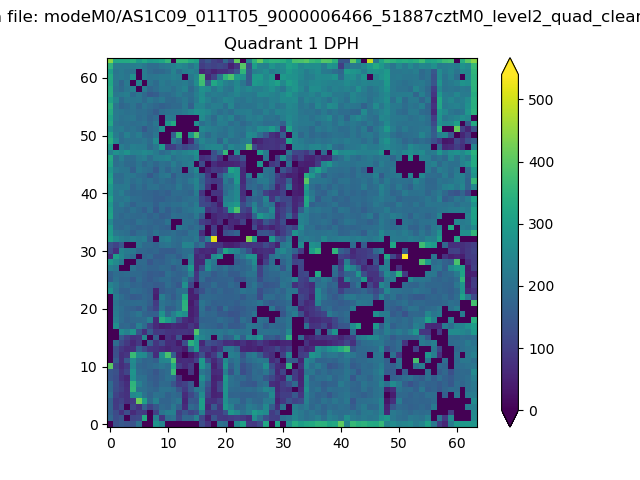 |
Quadrant B |
|---|---|---|---|
| Quadrant D | 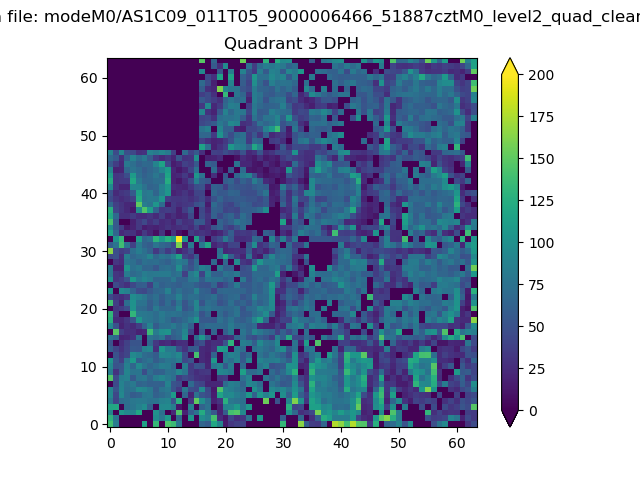 |
 |
Quadrant C |
| Plot type | Count rate plots | Images |
|---|---|---|
| Comparison with Poisson distribution Blue bars denote a histogram of data divided into 1 sec bins. Red curve is a Poisson curve with rate = median count rate of data. |
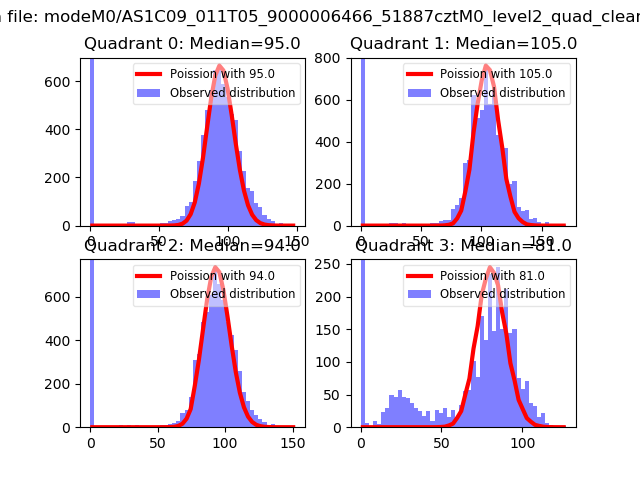 |
 |
| Quadrant-wise count rates Data is divided into 100 sec bins |
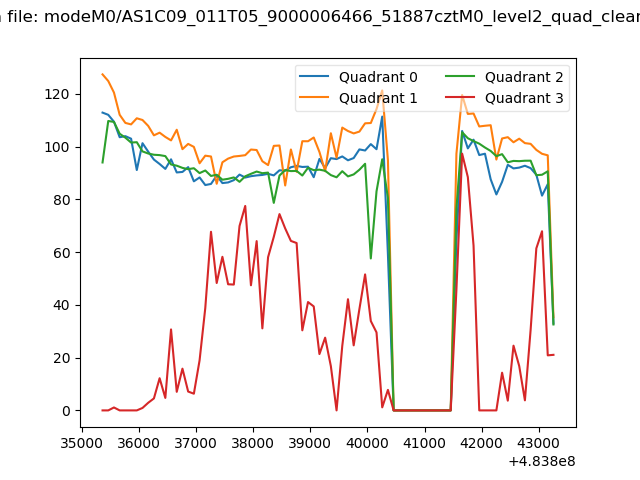 |
|
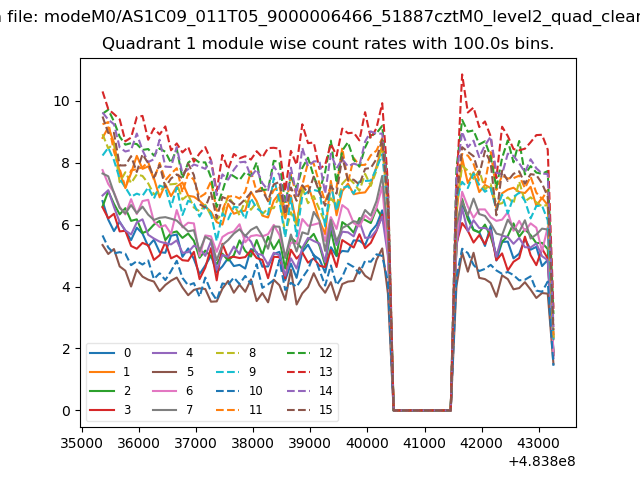
| Module-wise count rates for Quadrant A Data is divided into 100 sec bins |
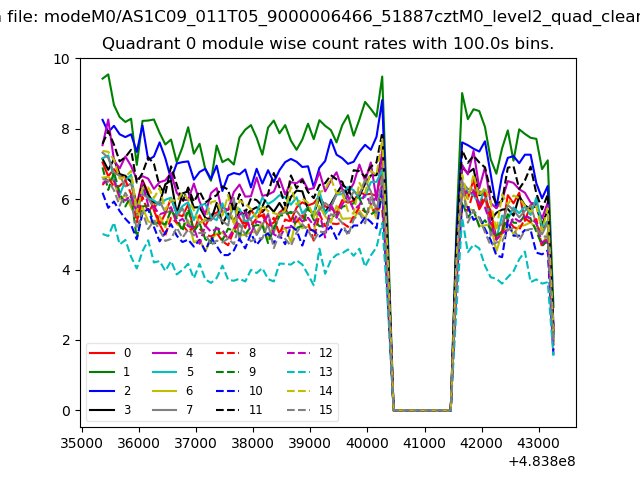 |
 |
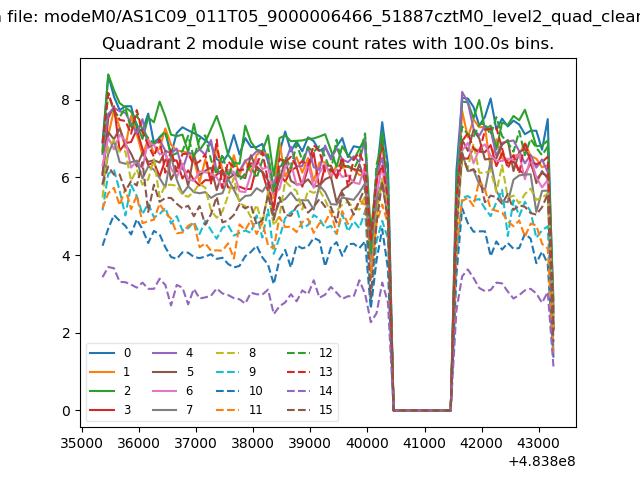
| Module-wise count rates for Quadrant B Data is divided into 100 sec bins |
 |
 |
| Module-wise count rates for Quadrant C Data is divided into 100 sec bins |
 |
 |
| Module-wise count rates for Quadrant D Data is divided into 100 sec bins |
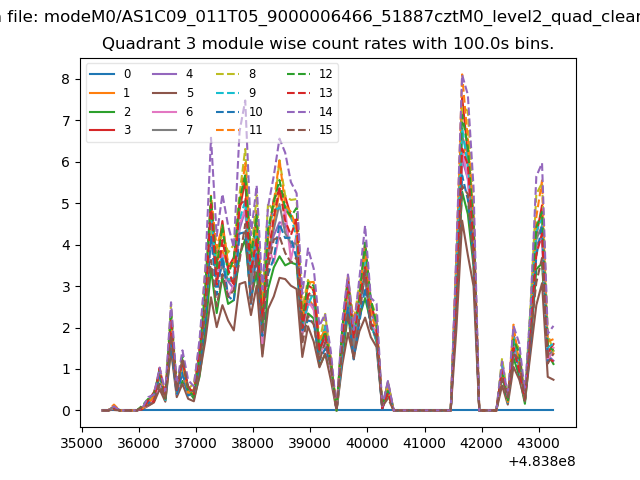 |
 |
| Parameter | Plot |
|---|---|
| CZT HV Monitor |  |
| D_VDD | 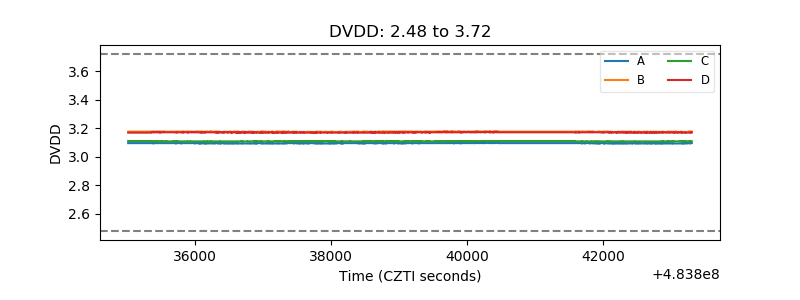 |
| Temperature 1 | 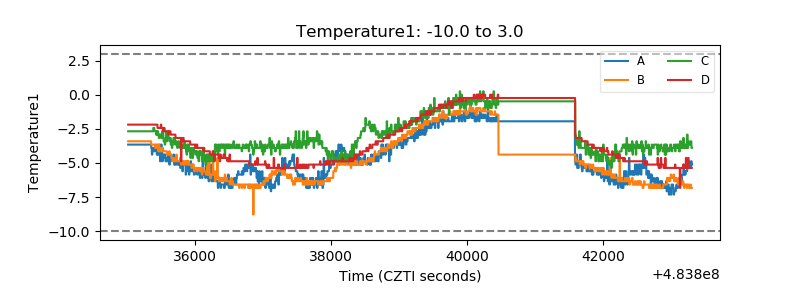 |
| Veto HV Monitor | 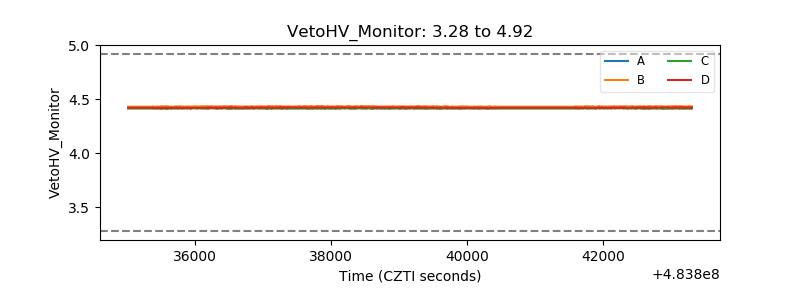 |
| Veto LLD | 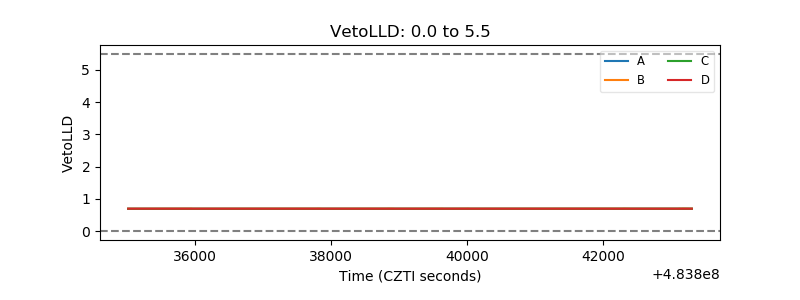 |
| Alpha Counter | 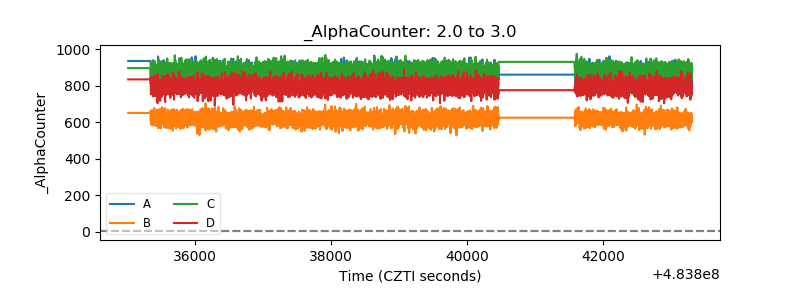 |
| _CPM_Rate | 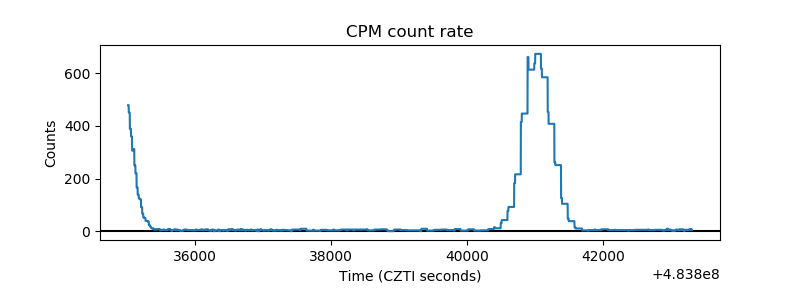 |
| CZT Counter | 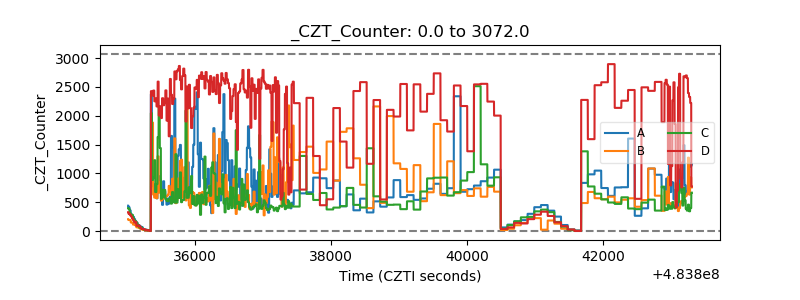 |
| +2.5 Volts monitor |  |
| +5 Volts monitor | 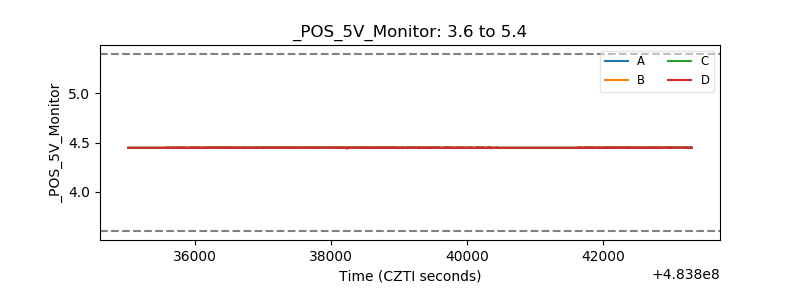 |
| _ROLL_ROT | 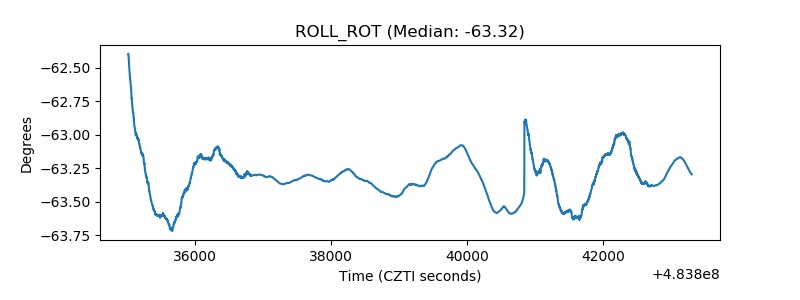 |
| _Roll_DEC | 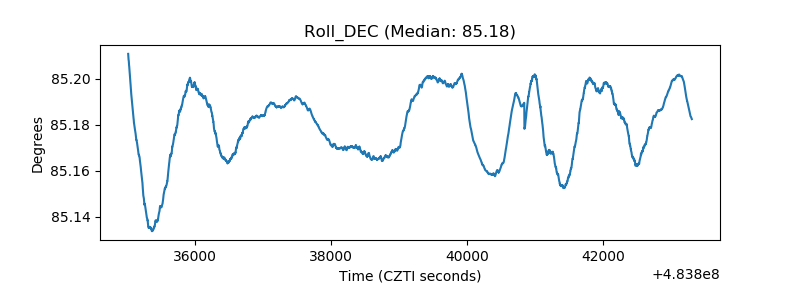 |
| _Roll_RA | 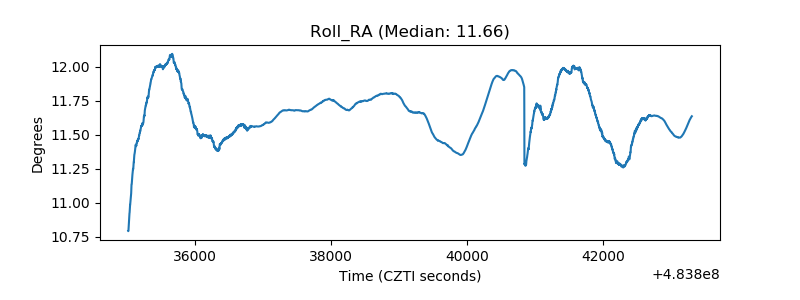 |
| Veto Counter | 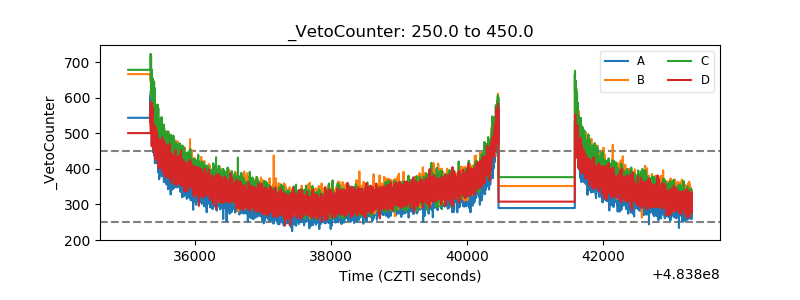 |