| Param | Original file | Final file |
|---|---|---|
| Filename | modeM0/AS1C09_011T05_9000006466_51888cztM0_level2.fits | modeM0/AS1C09_011T05_9000006466_51888cztM0_level2_quad_clean.evt |
| Size (bytes) | 883,900,800 | 84,205,440 |
| Size | 843.0 MB | 80.3 MB |
| Events in quadrant A | 7,570,088 | 585,382 |
| Events in quadrant B | 6,548,811 | 597,799 |
| Events in quadrant C | 4,599,276 | 630,336 |
| Events in quadrant D | 13,475,344 | 261,625 |
| Mode SS | |||
|---|---|---|---|
| Quadrant | BADHDUFLAG | Total packets | Discarded packets |
| A | 0 | 138 | 0 |
| B | 0 | 138 | 0 |
| C | 0 | 138 | 0 |
| D | 0 | 138 | 0 |
| Mode M0 | |||
|---|---|---|---|
| Quadrant | BADHDUFLAG | Total packets | Discarded packets |
| A | 0 | 27291 | 2 |
| B | 0 | 24241 | 2 |
| C | 0 | 18421 | 2 |
| D | 0 | 44716 | 2 |
| Mode M9 | |||
|---|---|---|---|
| Quadrant | BADHDUFLAG | Total packets | Discarded packets |
| A | 0 | 13 | 0 |
| B | 0 | 14 | 0 |
| C | 0 | 14 | 0 |
| D | 0 | 14 | 0 |
| Quadrant | Total seconds | Saturated seconds | Saturation percentage |
|---|---|---|---|
| A | 6804 | 749 | 11.008230% |
| B | 6804 | 1173 | 17.239859% |
| C | 6804 | 92 | 1.352146% |
| D | 6804 | 4146 | 60.934744% |
Noise dominated data is calculated using 1-second bins in cleaned event files. If a bin has >2000 counts, and if more than 50% of those come from <1% of pixels, then it is considered to be noise-dominated and hence unusable.
| Quadrant | # 1 sec bins | Bins with >0 counts | Bins with >2000 counts | High rate bins dominated by noise | Noise dominated (total time) | Noise dominated (detector-on time) | Marked lightcurve |
|---|---|---|---|---|---|---|---|
| A | 7884 | 6805 | 606 | 606 | 7.69% | 8.91% | 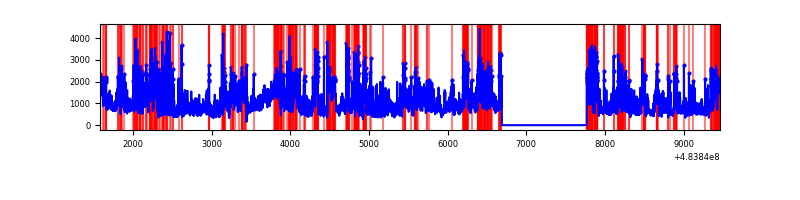 |
| B | 7884 | 6805 | 731 | 731 | 9.27% | 10.74% |  |
| C | 7884 | 6805 | 51 | 51 | 0.65% | 0.75% | 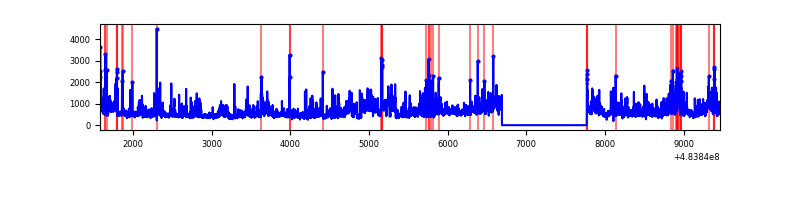 |
| D | 7884 | 6803 | 3398 | 3398 | 43.10% | 49.95% | 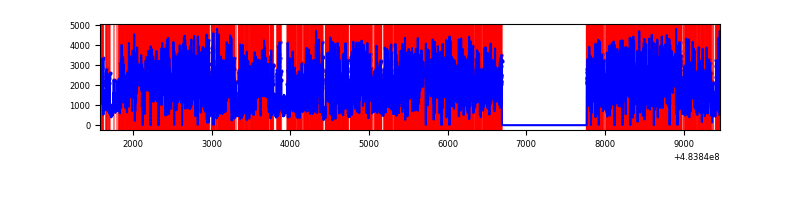 |
Top three noisy pixels from each quadrant. If the there are fewer than three noisy pixels in the level2.evt file, extra rows are filled as -1
| Pixel properties | Quadrant properties | ||||||
|---|---|---|---|---|---|---|---|
| Quadrant | DetID | PixID | Counts | Sigma | Mean | Median | Sigma |
| A | 12 | 3 | 1624641 | 9612.45 | 675 | 658 | 168.9 |
| A | 4 | 175 | 842283 | 4981.63 | 675 | 658 | 168.9 |
| A | 15 | 174 | 795243 | 4703.19 | 675 | 658 | 168.9 |
| B | 4 | 170 | 1691825 | 11982.07 | 666 | 643 | 141.1 |
| B | 4 | 171 | 655106 | 4636.89 | 666 | 643 | 141.1 |
| B | 10 | 254 | 536593 | 3797.22 | 666 | 643 | 141.1 |
| C | 15 | 192 | 578362 | 2997.65 | 690 | 683 | 192.7 |
| C | 15 | 248 | 344278 | 1782.96 | 690 | 683 | 192.7 |
| C | 3 | 233 | 195082 | 1008.76 | 690 | 683 | 192.7 |
| D | 11 | 129 | 6741607 | 53563.62 | 447 | 430 | 125.9 |
| D | 6 | 42 | 2698703 | 21439.77 | 447 | 430 | 125.9 |
| D | 12 | 17 | 870658 | 6914.6 | 447 | 430 | 125.9 |
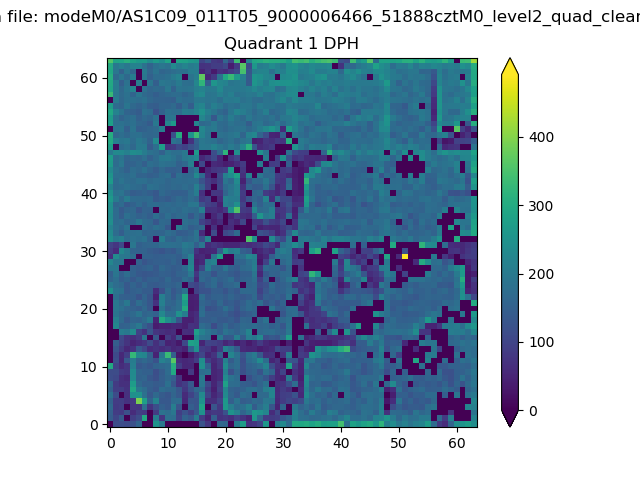
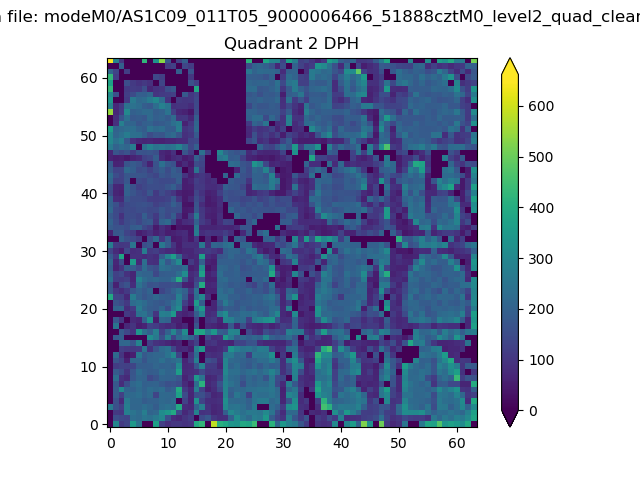
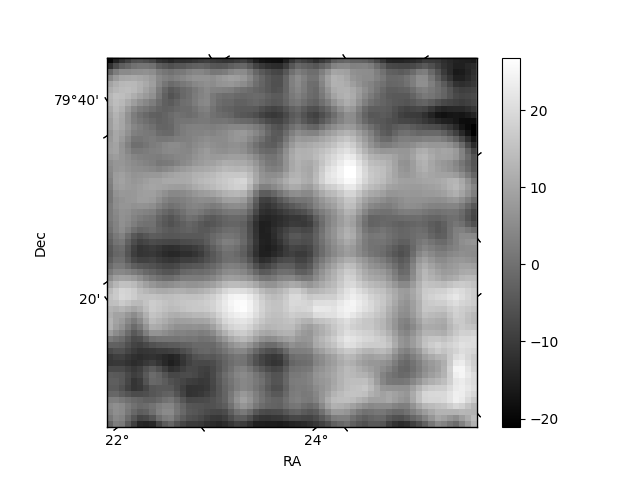
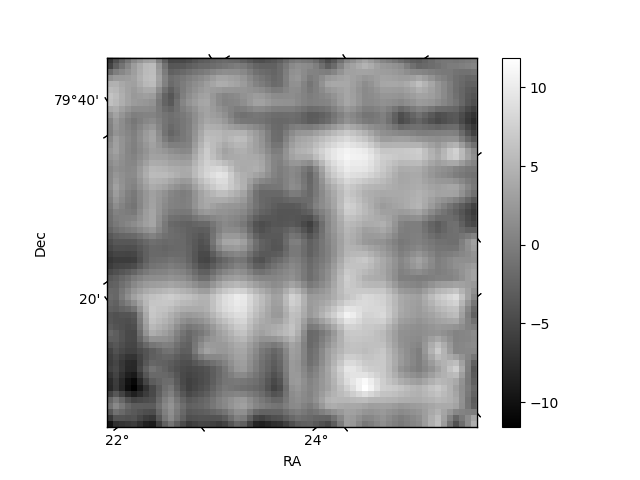
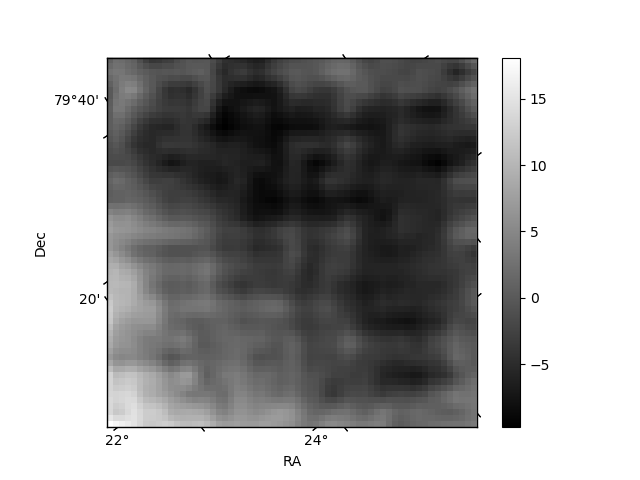
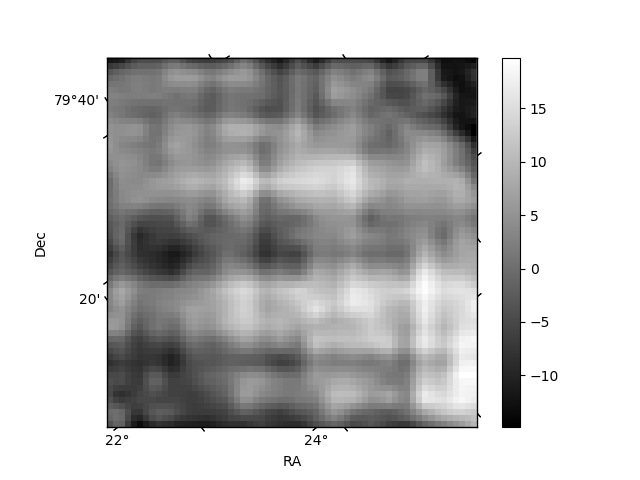
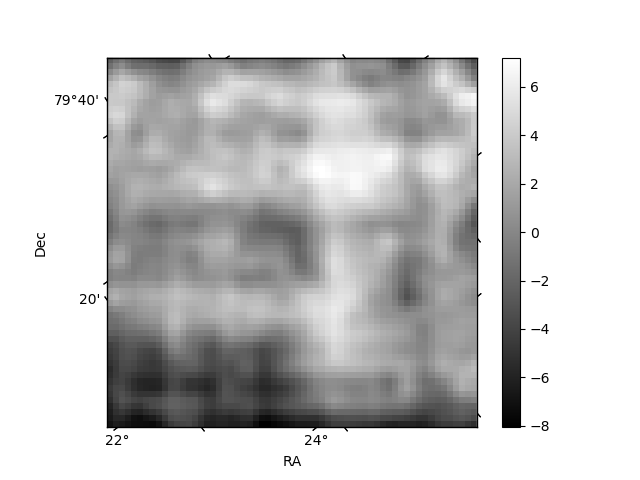
Histogram calculated using DETX and DETY for each event in the final _common_clean file
| Quadrant A | 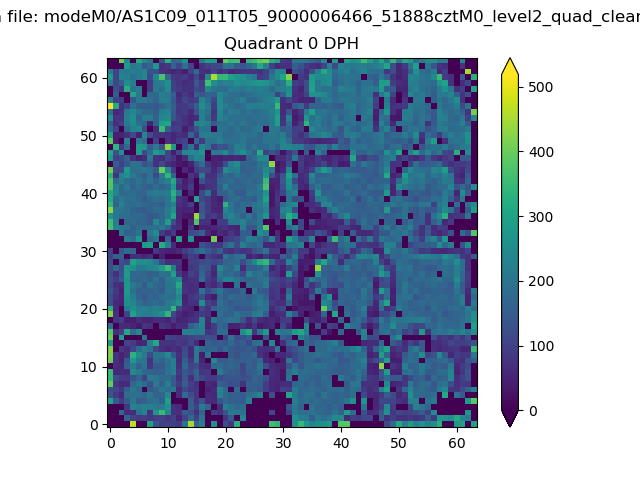 |
 |
Quadrant B |
|---|---|---|---|
| Quadrant D | 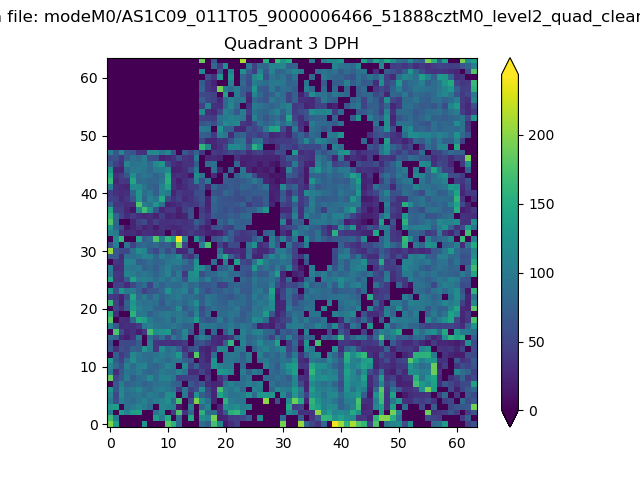 |
 |
Quadrant C |
| Plot type | Count rate plots | Images |
|---|---|---|
| Comparison with Poisson distribution Blue bars denote a histogram of data divided into 1 sec bins. Red curve is a Poisson curve with rate = median count rate of data. |
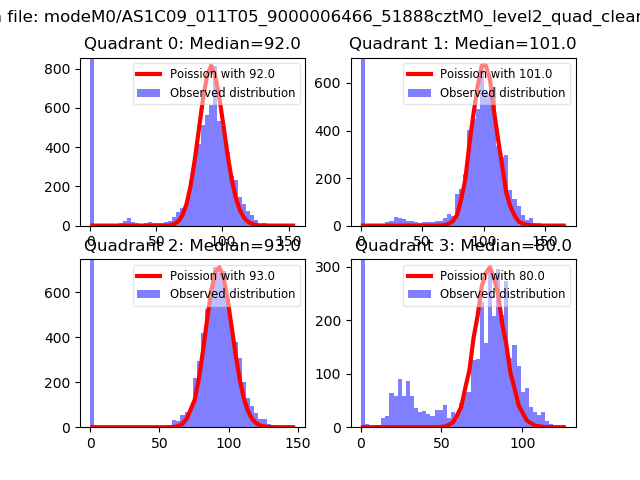 |
 |
| Quadrant-wise count rates Data is divided into 100 sec bins |
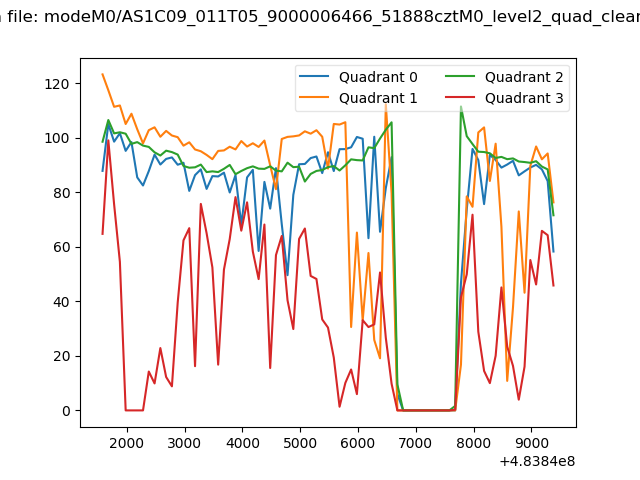 |
|
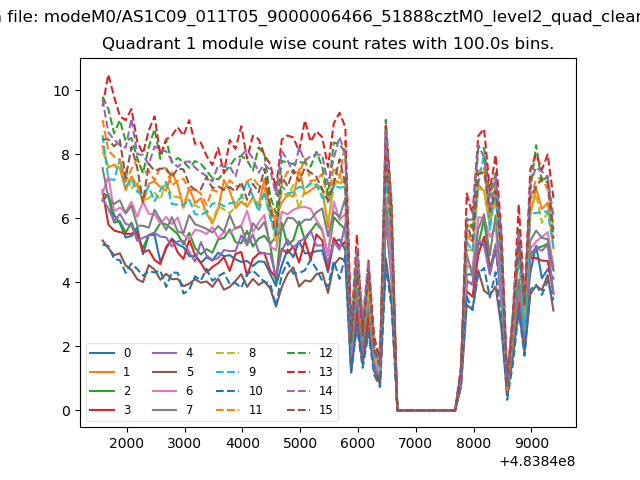
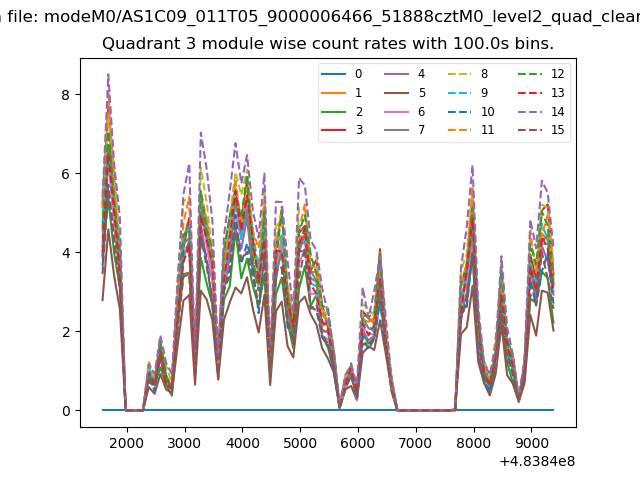
| Module-wise count rates for Quadrant A Data is divided into 100 sec bins |
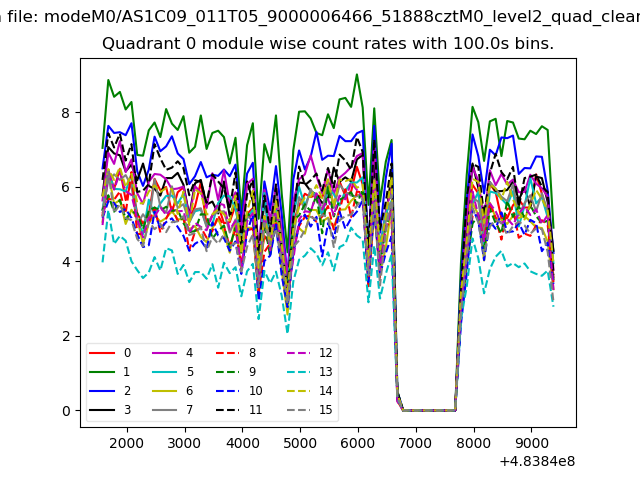 |
 |
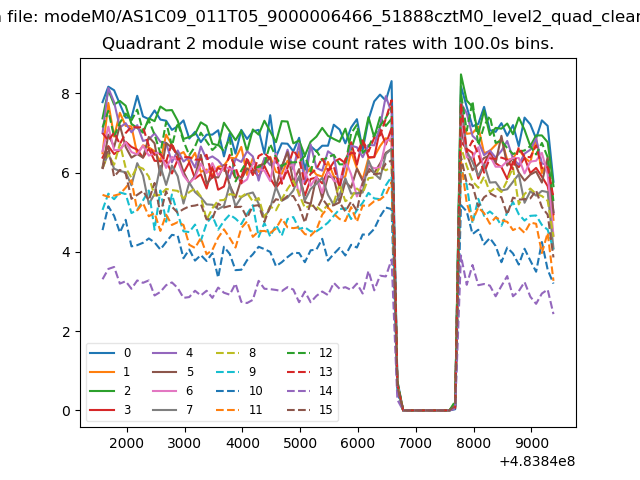
| Module-wise count rates for Quadrant B Data is divided into 100 sec bins |
 |
 |
| Module-wise count rates for Quadrant C Data is divided into 100 sec bins |
 |
 |
| Module-wise count rates for Quadrant D Data is divided into 100 sec bins |
 |
 |
| Parameter | Plot |
|---|---|
| CZT HV Monitor | 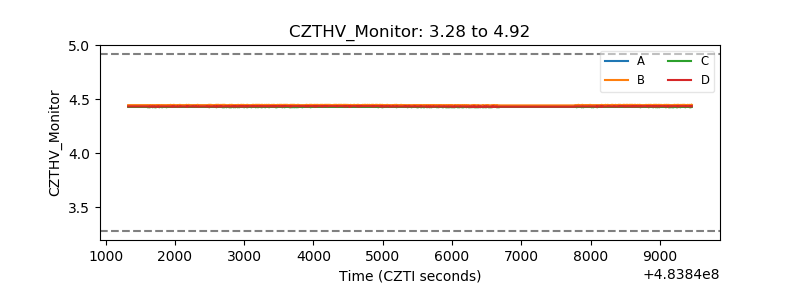 |
| D_VDD | 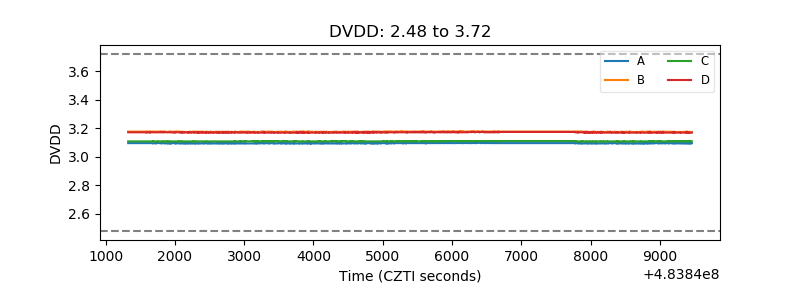 |
| Temperature 1 | 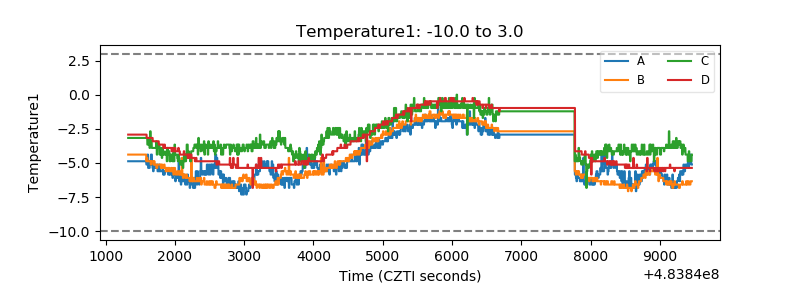 |
| Veto HV Monitor | 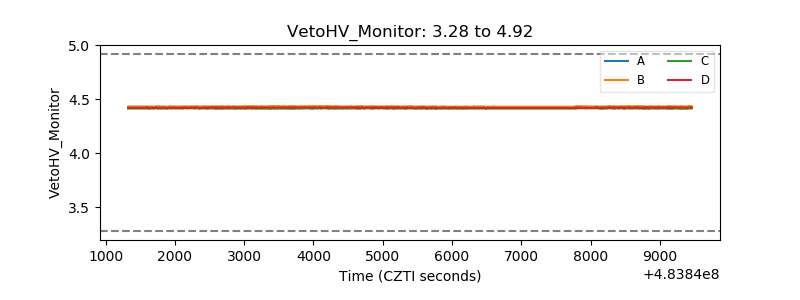 |
| Veto LLD | 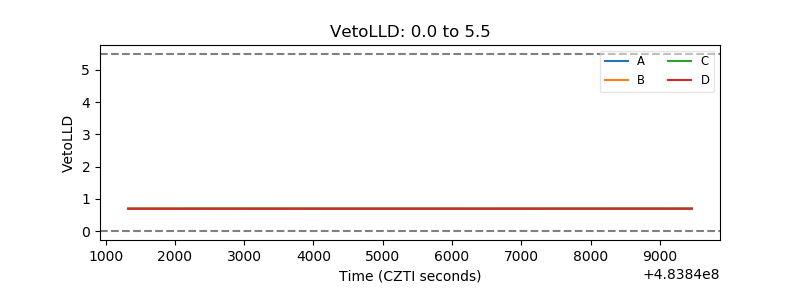 |
| Alpha Counter | 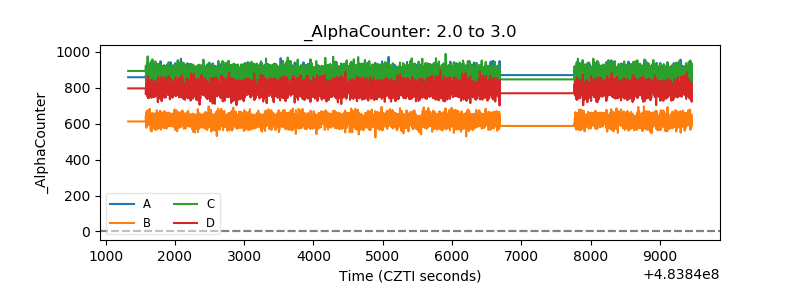 |
| _CPM_Rate | 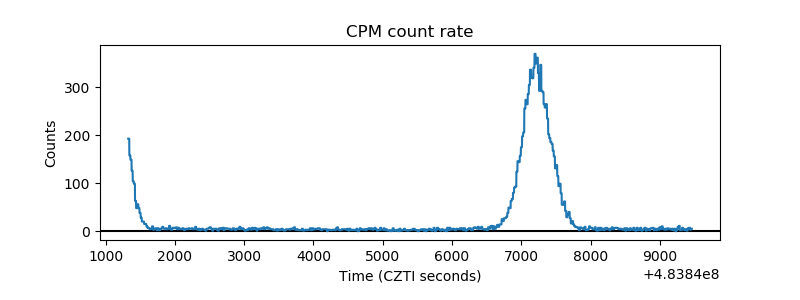 |
| CZT Counter | 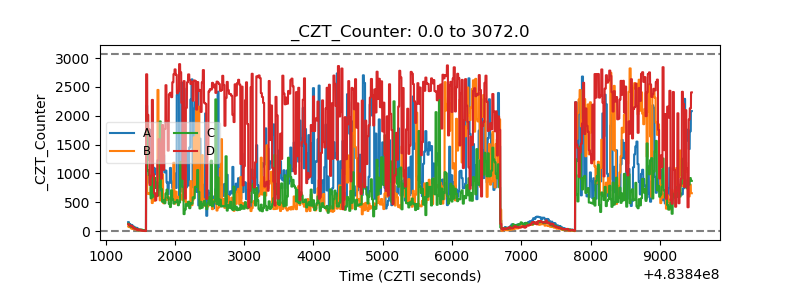 |
| +2.5 Volts monitor | 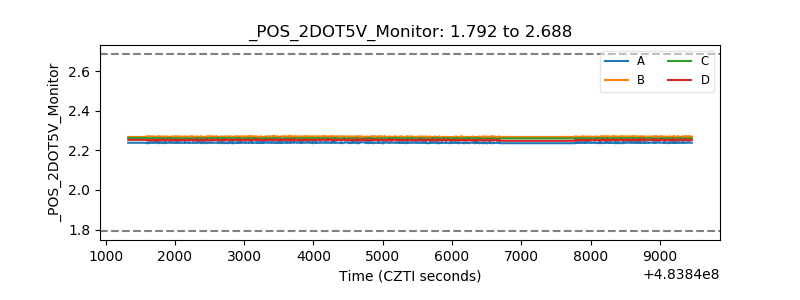 |
| +5 Volts monitor |  |
| _ROLL_ROT | 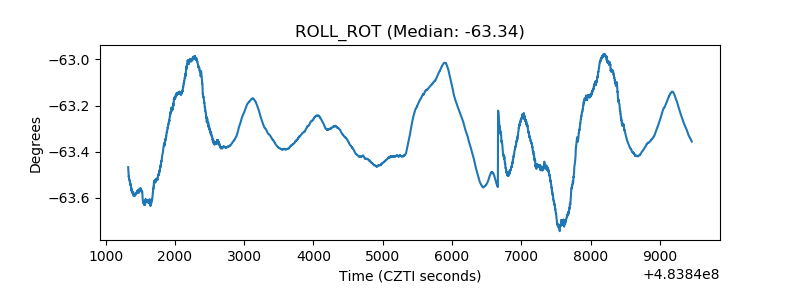 |
| _Roll_DEC | 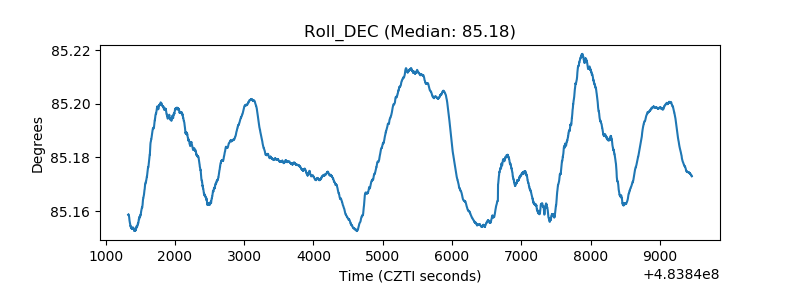 |
| _Roll_RA | 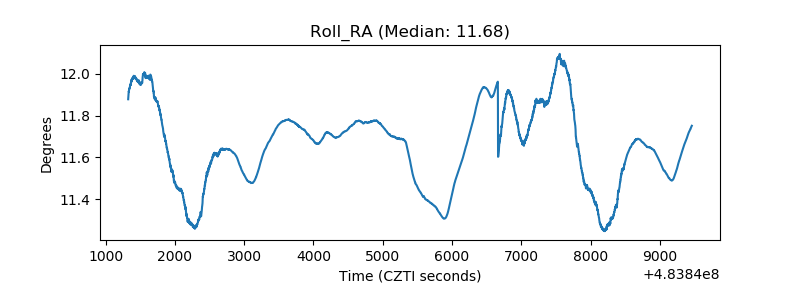 |
| Veto Counter | 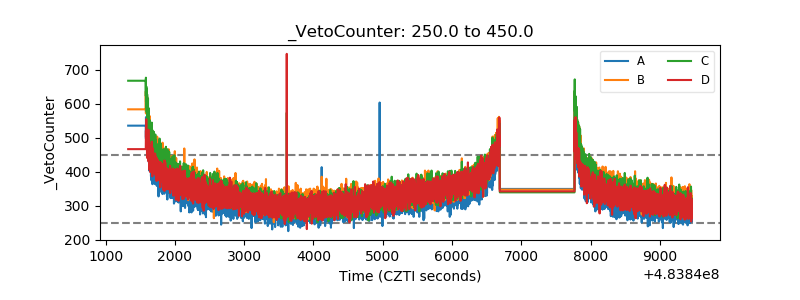 |