| Param | Original file | Final file |
|---|---|---|
| Filename | modeM0/AS1C09_011T05_9000006466_51889cztM0_level2.fits | modeM0/AS1C09_011T05_9000006466_51889cztM0_level2_quad_clean.evt |
| Size (bytes) | 789,497,280 | 68,195,520 |
| Size | 752.9 MB | 65.0 MB |
| Events in quadrant A | 5,243,741 | 523,561 |
| Events in quadrant B | 8,214,264 | 402,963 |
| Events in quadrant C | 3,579,370 | 530,718 |
| Events in quadrant D | 11,732,986 | 196,941 |
| Mode SS | |||
|---|---|---|---|
| Quadrant | BADHDUFLAG | Total packets | Discarded packets |
| A | 0 | 120 | 0 |
| B | 0 | 120 | 0 |
| C | 0 | 120 | 0 |
| D | 0 | 120 | 0 |
| Mode M0 | |||
|---|---|---|---|
| Quadrant | BADHDUFLAG | Total packets | Discarded packets |
| A | 0 | 19728 | 1 |
| B | 0 | 28492 | 1 |
| C | 0 | 14554 | 1 |
| D | 0 | 38832 | 1 |
| Mode M9 | |||
|---|---|---|---|
| Quadrant | BADHDUFLAG | Total packets | Discarded packets |
| A | 0 | 9 | 0 |
| B | 0 | 9 | 0 |
| C | 0 | 9 | 0 |
| D | 0 | 9 | 0 |
| Quadrant | Total seconds | Saturated seconds | Saturation percentage |
|---|---|---|---|
| A | 5869 | 312 | 5.316067% |
| B | 5870 | 2048 | 34.889267% |
| C | 5870 | 56 | 0.954003% |
| D | 5870 | 3812 | 64.940375% |
Noise dominated data is calculated using 1-second bins in cleaned event files. If a bin has >2000 counts, and if more than 50% of those come from <1% of pixels, then it is considered to be noise-dominated and hence unusable.
| Quadrant | # 1 sec bins | Bins with >0 counts | Bins with >2000 counts | High rate bins dominated by noise | Noise dominated (total time) | Noise dominated (detector-on time) | Marked lightcurve |
|---|---|---|---|---|---|---|---|
| A | 6794 | 5870 | 254 | 254 | 3.74% | 4.33% |  |
| B | 6795 | 5871 | 1636 | 1636 | 24.08% | 27.87% |  |
| C | 6795 | 5871 | 58 | 58 | 0.85% | 0.99% | 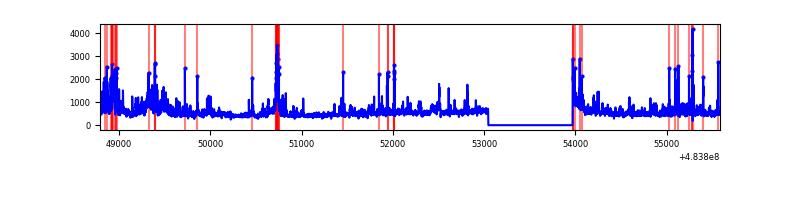 |
| D | 6795 | 5871 | 3057 | 3057 | 44.99% | 52.07% | 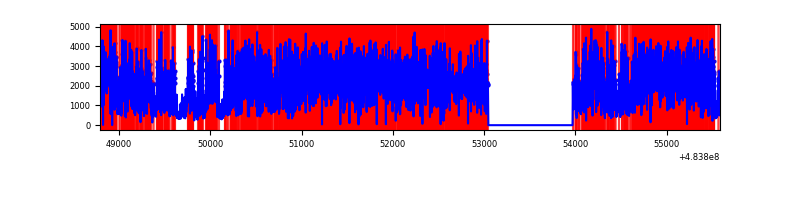 |
Top three noisy pixels from each quadrant. If the there are fewer than three noisy pixels in the level2.evt file, extra rows are filled as -1
| Pixel properties | Quadrant properties | ||||||
|---|---|---|---|---|---|---|---|
| Quadrant | DetID | PixID | Counts | Sigma | Mean | Median | Sigma |
| A | 12 | 3 | 1446106 | 9899.69 | 589 | 575 | 146.0 |
| A | 3 | 30 | 401055 | 2742.68 | 589 | 575 | 146.0 |
| A | 11 | 3 | 338823 | 2316.48 | 589 | 575 | 146.0 |
| B | 4 | 170 | 4387706 | 40035.03 | 508 | 490 | 109.6 |
| B | 10 | 254 | 737682 | 6727.16 | 508 | 490 | 109.6 |
| B | 4 | 171 | 614971 | 5607.37 | 508 | 490 | 109.6 |
| C | 15 | 248 | 459181 | 2864.04 | 580 | 578 | 160.1 |
| C | 10 | 22 | 160265 | 997.27 | 580 | 578 | 160.1 |
| C | 14 | 246 | 119728 | 744.11 | 580 | 578 | 160.1 |
| D | 11 | 129 | 6322179 | 61734.24 | 355 | 340 | 102.4 |
| D | 6 | 42 | 1659879 | 16205.79 | 355 | 340 | 102.4 |
| D | 12 | 17 | 845134 | 8249.61 | 355 | 340 | 102.4 |
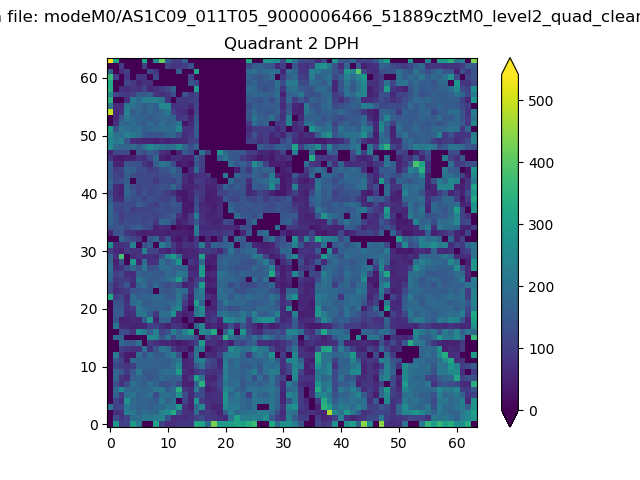
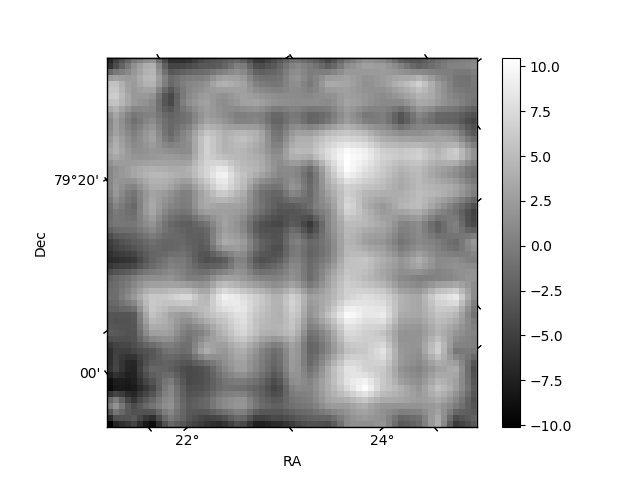
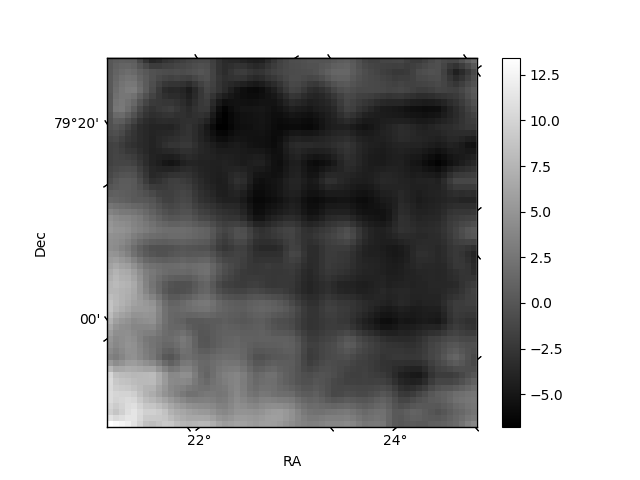
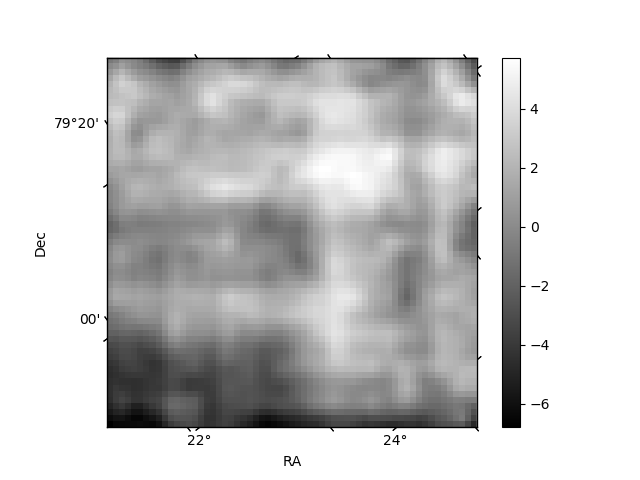
Histogram calculated using DETX and DETY for each event in the final _common_clean file
| Quadrant A | 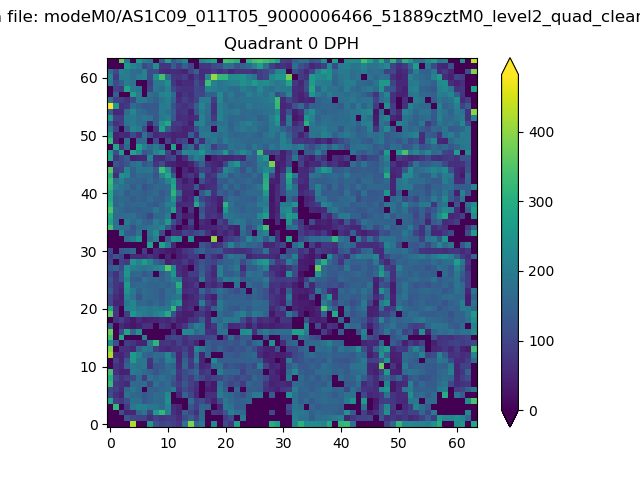 |
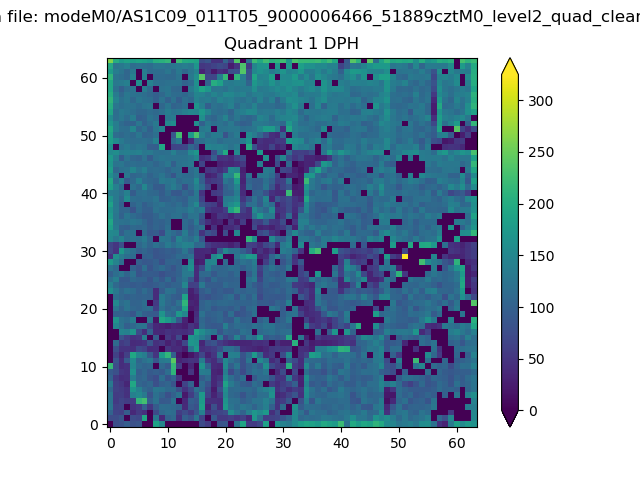 |
Quadrant B |
|---|---|---|---|
| Quadrant D | 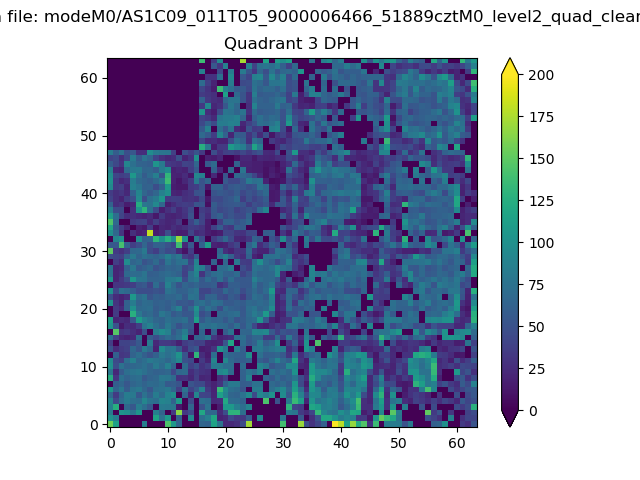 |
 |
Quadrant C |
| Plot type | Count rate plots | Images |
|---|---|---|
| Comparison with Poisson distribution Blue bars denote a histogram of data divided into 1 sec bins. Red curve is a Poisson curve with rate = median count rate of data. |
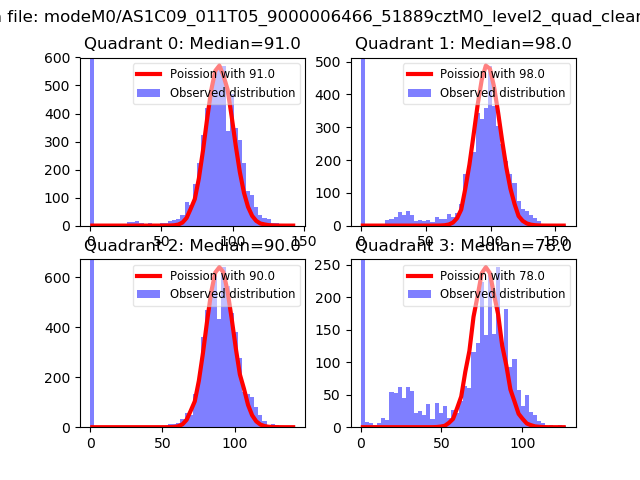 |
 |
| Quadrant-wise count rates Data is divided into 100 sec bins |
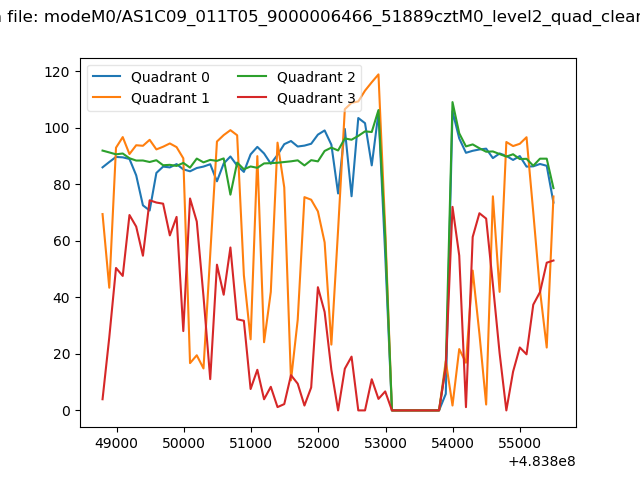 |
|
| Module-wise count rates for Quadrant A Data is divided into 100 sec bins |
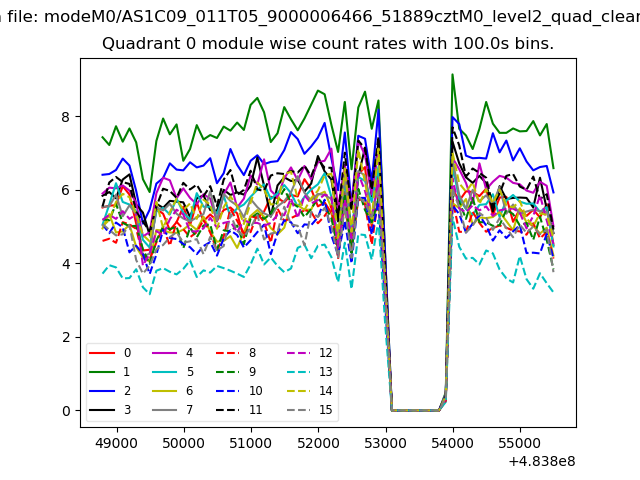 |
 |
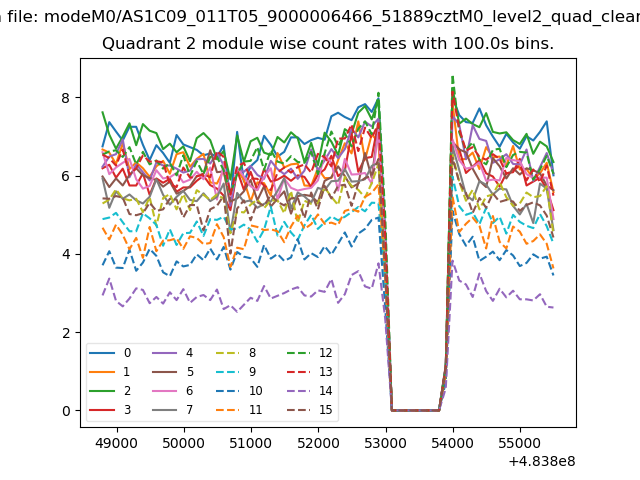
| Module-wise count rates for Quadrant B Data is divided into 100 sec bins |
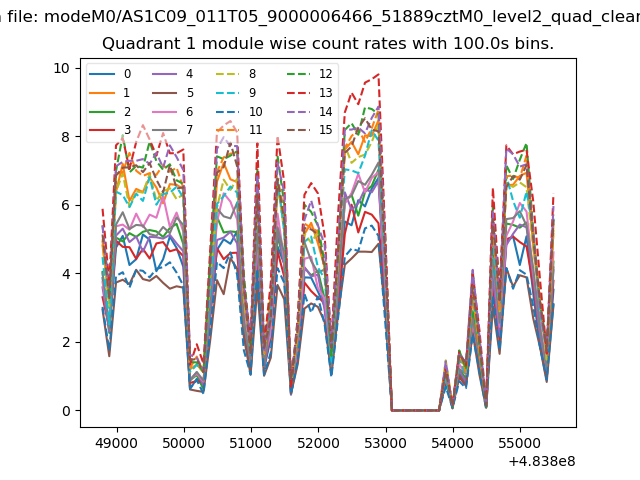 |
 |
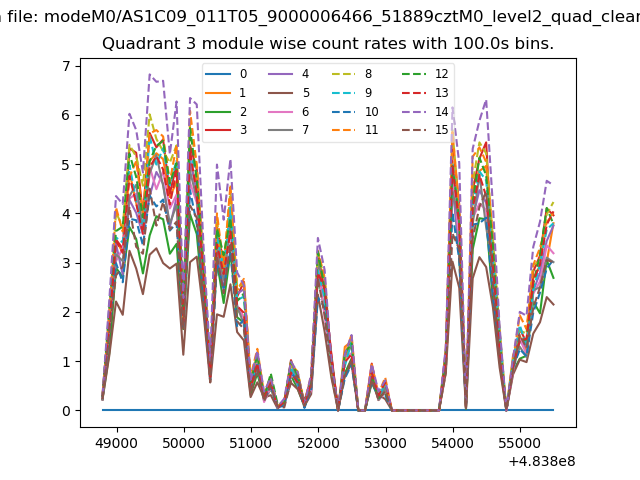
| Module-wise count rates for Quadrant C Data is divided into 100 sec bins |
 |
 |
| Module-wise count rates for Quadrant D Data is divided into 100 sec bins |
 |
 |
| Parameter | Plot |
|---|---|
| CZT HV Monitor | 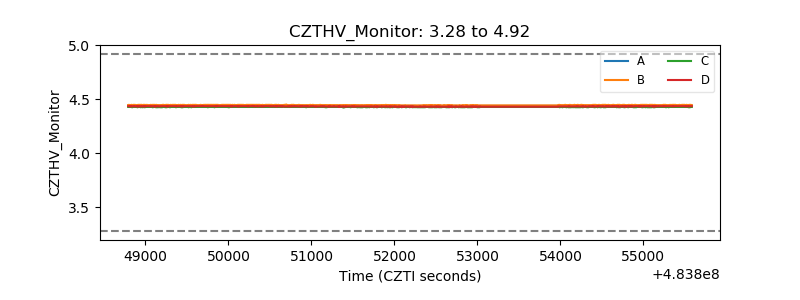 |
| D_VDD | 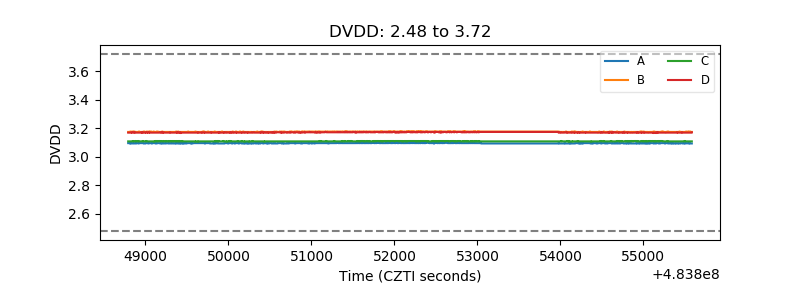 |
| Temperature 1 | 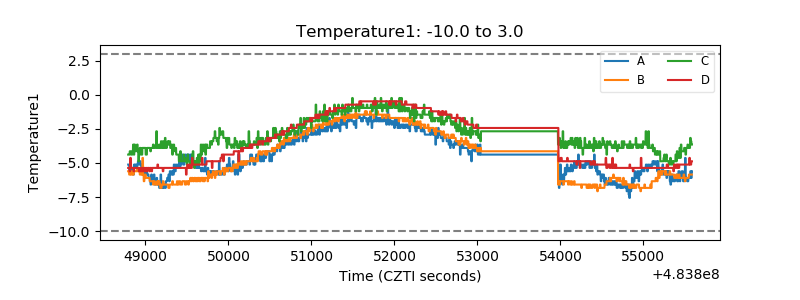 |
| Veto HV Monitor | 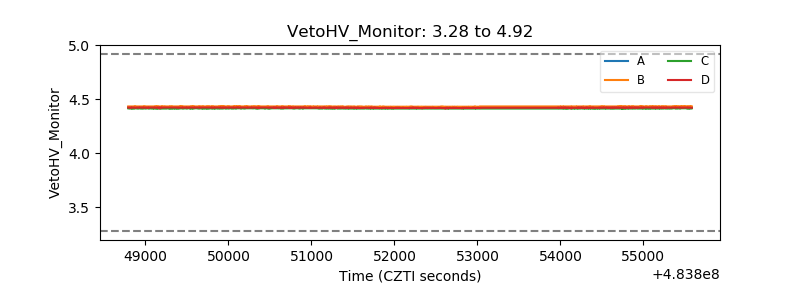 |
| Veto LLD | 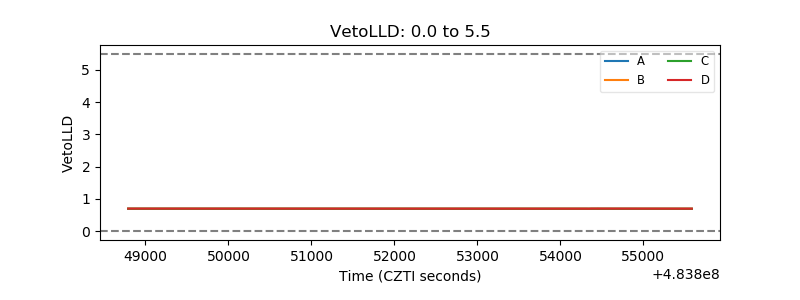 |
| Alpha Counter | 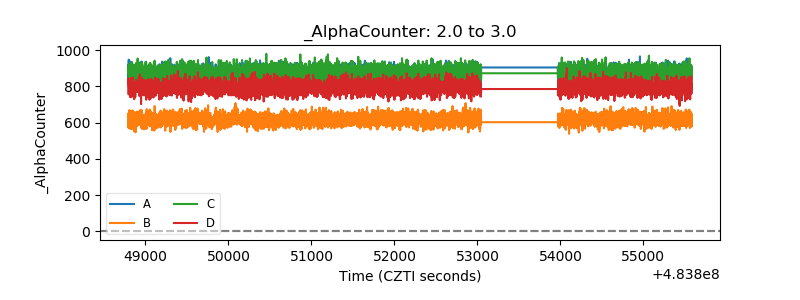 |
| _CPM_Rate | 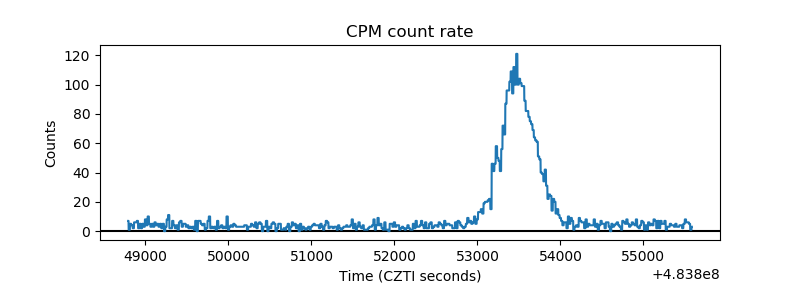 |
| CZT Counter | 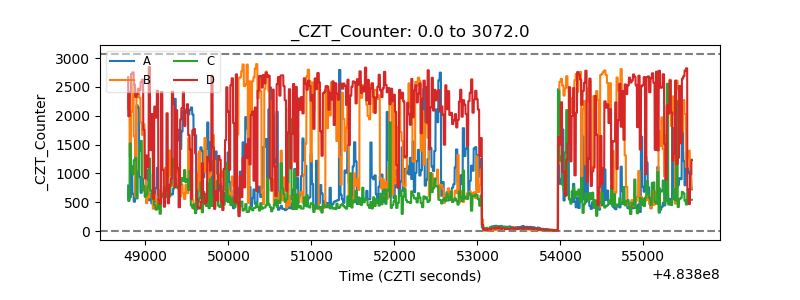 |
| +2.5 Volts monitor | 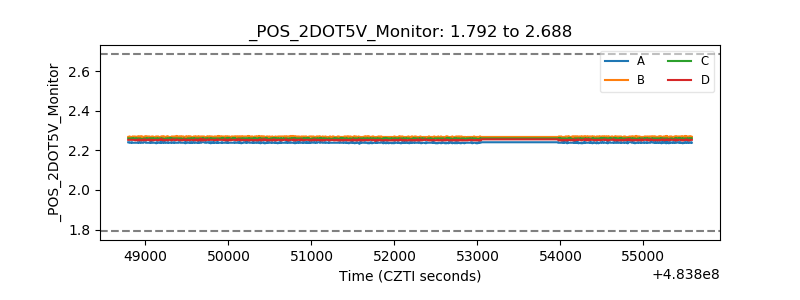 |
| +5 Volts monitor |  |
| _ROLL_ROT | 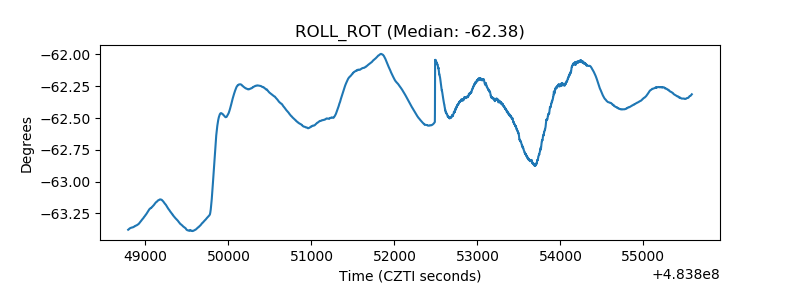 |
| _Roll_DEC | 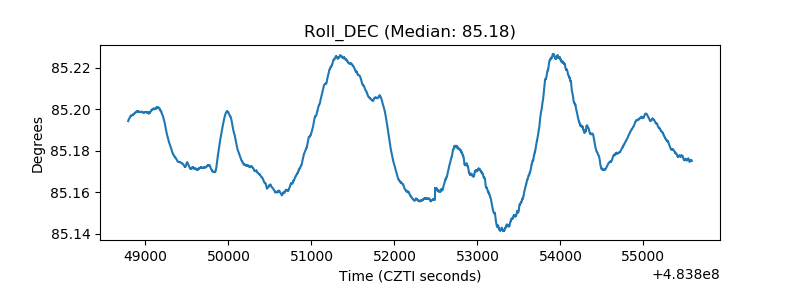 |
| _Roll_RA | 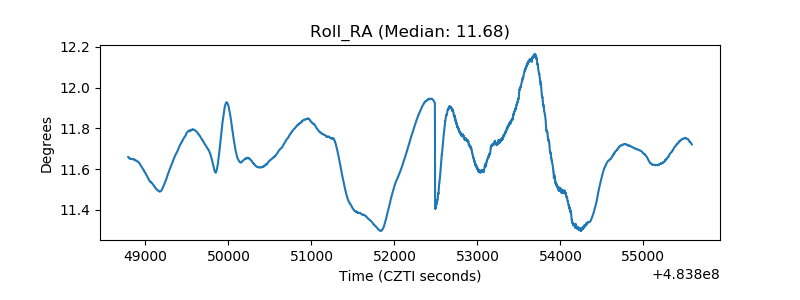 |
| Veto Counter | 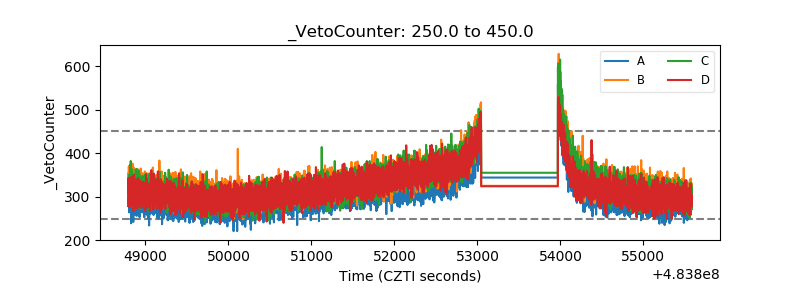 |