| Param | Original file | Final file |
|---|---|---|
| Filename | modeM0/AS1C09_011T05_9000006466_51890cztM0_level2.fits | modeM0/AS1C09_011T05_9000006466_51890cztM0_level2_quad_clean.evt |
| Size (bytes) | 801,336,960 | 82,275,840 |
| Size | 764.2 MB | 78.5 MB |
| Events in quadrant A | 5,860,930 | 603,909 |
| Events in quadrant B | 6,944,412 | 545,527 |
| Events in quadrant C | 3,763,287 | 604,831 |
| Events in quadrant D | 12,593,550 | 284,971 |
| Mode SS | |||
|---|---|---|---|
| Quadrant | BADHDUFLAG | Total packets | Discarded packets |
| A | 0 | 132 | 0 |
| B | 0 | 132 | 0 |
| C | 0 | 132 | 0 |
| D | 0 | 132 | 0 |
| Mode M0 | |||
|---|---|---|---|
| Quadrant | BADHDUFLAG | Total packets | Discarded packets |
| A | 0 | 21943 | 2 |
| B | 0 | 25119 | 2 |
| C | 0 | 15672 | 2 |
| D | 0 | 41892 | 3 |
| Mode M9 | |||
|---|---|---|---|
| Quadrant | BADHDUFLAG | Total packets | Discarded packets |
| A | 0 | 5 | 0 |
| B | 0 | 5 | 0 |
| C | 0 | 5 | 0 |
| D | 0 | 5 | 0 |
| Quadrant | Total seconds | Saturated seconds | Saturation percentage |
|---|---|---|---|
| A | 6472 | 327 | 5.052534% |
| B | 6473 | 1355 | 20.933107% |
| C | 6473 | 104 | 1.606674% |
| D | 6472 | 3773 | 58.297281% |
Noise dominated data is calculated using 1-second bins in cleaned event files. If a bin has >2000 counts, and if more than 50% of those come from <1% of pixels, then it is considered to be noise-dominated and hence unusable.
| Quadrant | # 1 sec bins | Bins with >0 counts | Bins with >2000 counts | High rate bins dominated by noise | Noise dominated (total time) | Noise dominated (detector-on time) | Marked lightcurve |
|---|---|---|---|---|---|---|---|
| A | 7017 | 6474 | 182 | 182 | 2.59% | 2.81% | 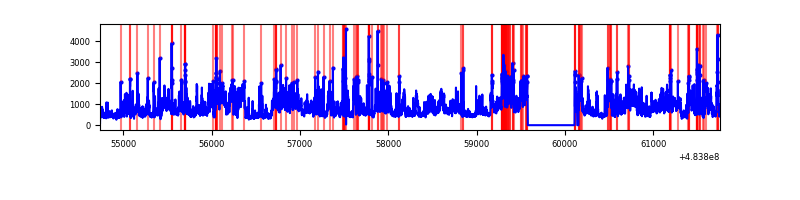 |
| B | 7018 | 6475 | 935 | 935 | 13.32% | 14.44% | 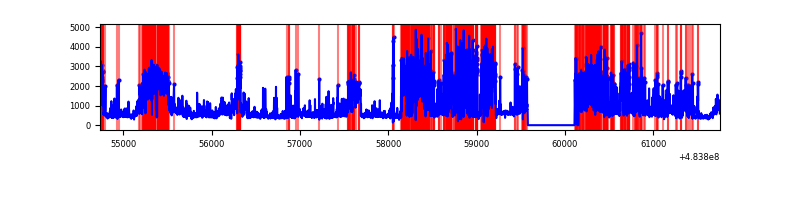 |
| C | 7018 | 6475 | 60 | 60 | 0.85% | 0.93% | 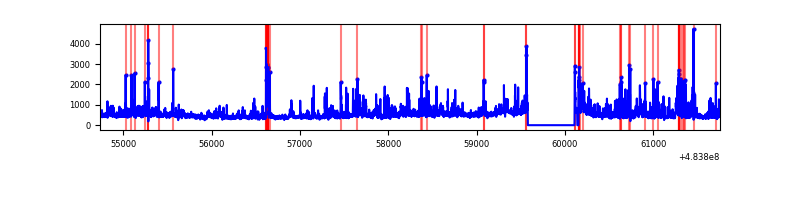 |
| D | 7017 | 6474 | 3183 | 3183 | 45.36% | 49.17% | 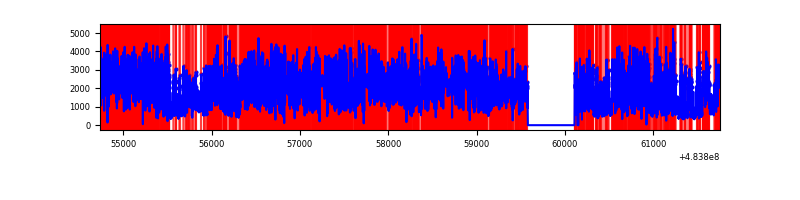 |
Top three noisy pixels from each quadrant. If the there are fewer than three noisy pixels in the level2.evt file, extra rows are filled as -1
| Pixel properties | Quadrant properties | ||||||
|---|---|---|---|---|---|---|---|
| Quadrant | DetID | PixID | Counts | Sigma | Mean | Median | Sigma |
| A | 12 | 3 | 1932701 | 11500.37 | 665 | 648 | 168.0 |
| A | 12 | 194 | 228133 | 1354.08 | 665 | 648 | 168.0 |
| A | 5 | 240 | 148264 | 878.67 | 665 | 648 | 168.0 |
| B | 4 | 170 | 3170036 | 24578.08 | 610 | 591 | 129.0 |
| B | 10 | 254 | 381442 | 2953.38 | 610 | 591 | 129.0 |
| B | 4 | 171 | 370888 | 2871.54 | 610 | 591 | 129.0 |
| C | 13 | 3 | 298824 | 1644.6 | 653 | 648 | 181.3 |
| C | 15 | 248 | 170514 | 936.9 | 653 | 648 | 181.3 |
| C | 10 | 22 | 122079 | 669.76 | 653 | 648 | 181.3 |
| D | 11 | 129 | 7715424 | 58193.54 | 464 | 448 | 132.6 |
| D | 12 | 17 | 1050954 | 7923.9 | 464 | 448 | 132.6 |
| D | 8 | 176 | 582516 | 4390.5 | 464 | 448 | 132.6 |
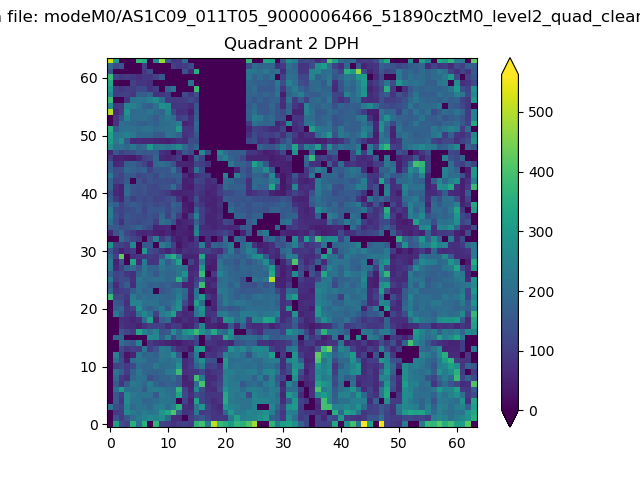
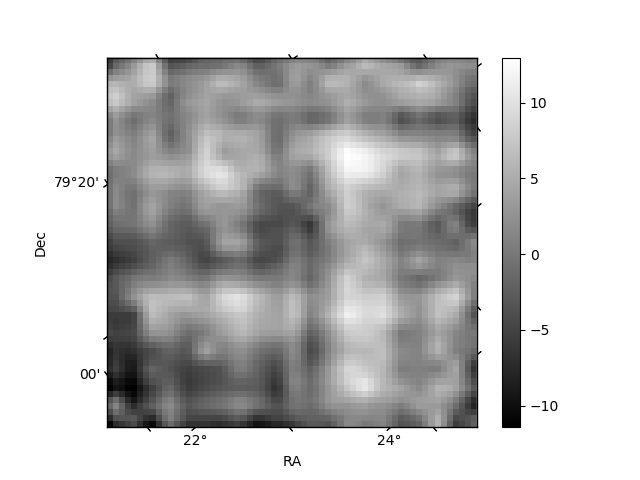
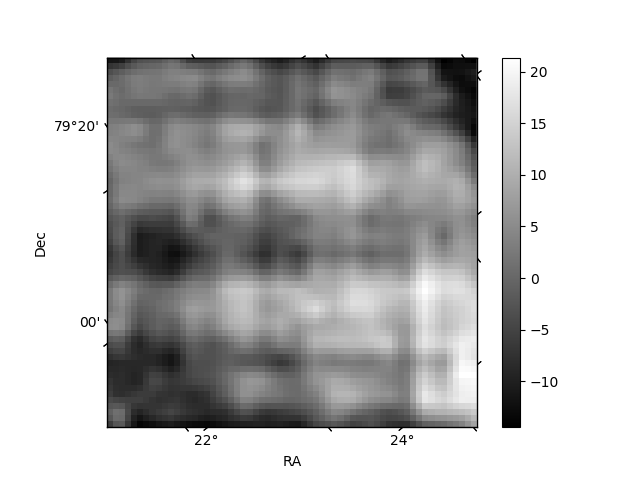
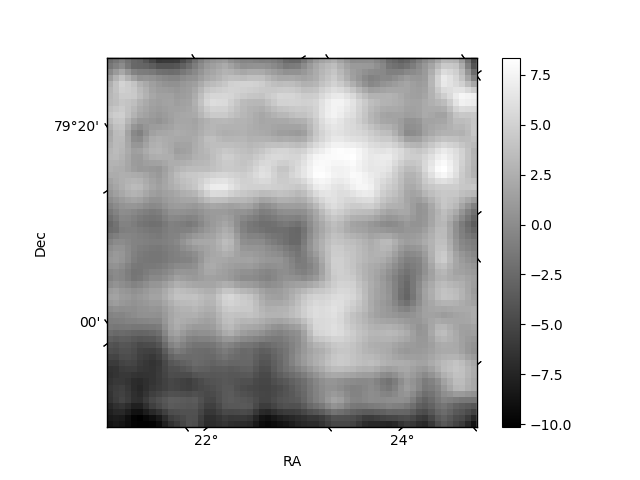
Histogram calculated using DETX and DETY for each event in the final _common_clean file
| Quadrant A | 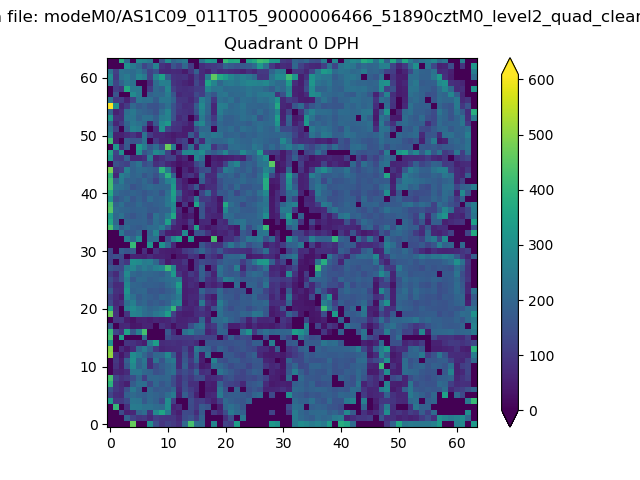 |
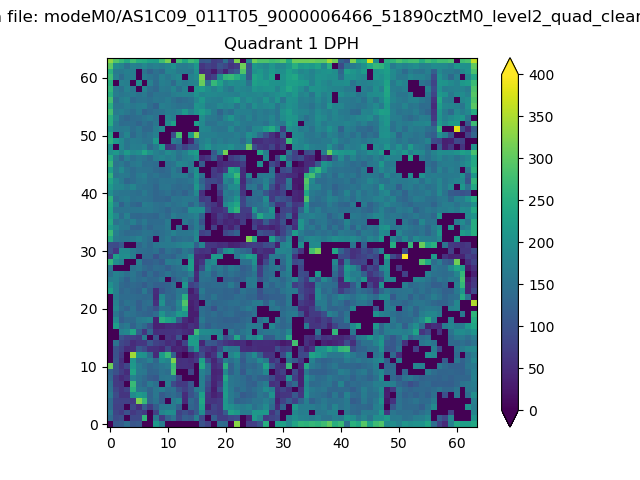 |
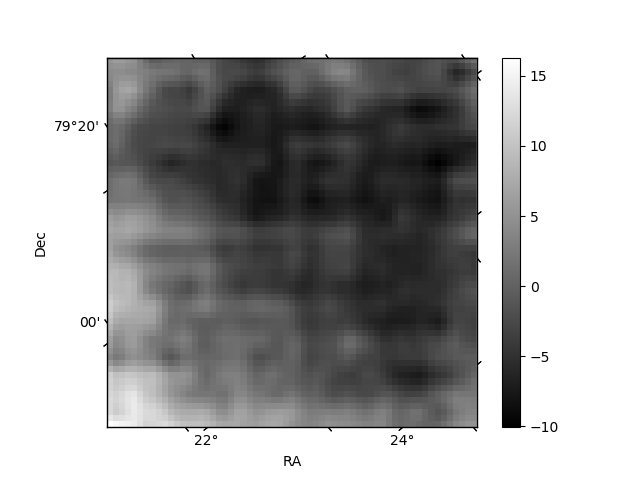
Quadrant B |
|---|---|---|---|
| Quadrant D | 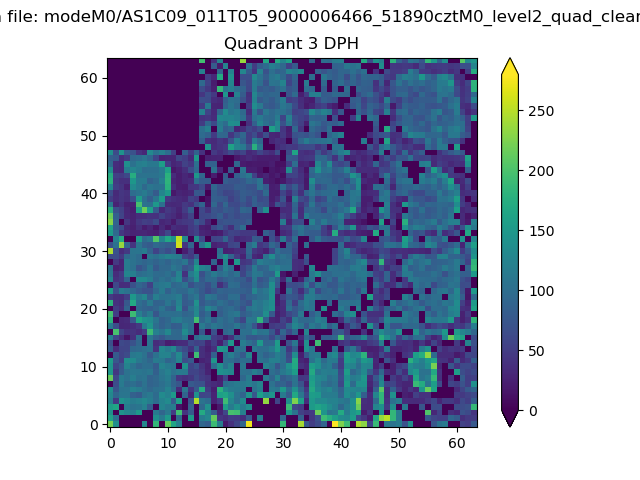 |
 |
Quadrant C |
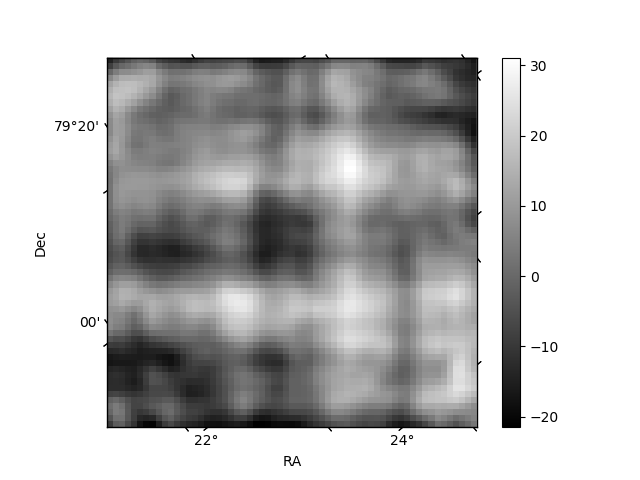
| Plot type | Count rate plots | Images |
|---|---|---|
| Comparison with Poisson distribution Blue bars denote a histogram of data divided into 1 sec bins. Red curve is a Poisson curve with rate = median count rate of data. |
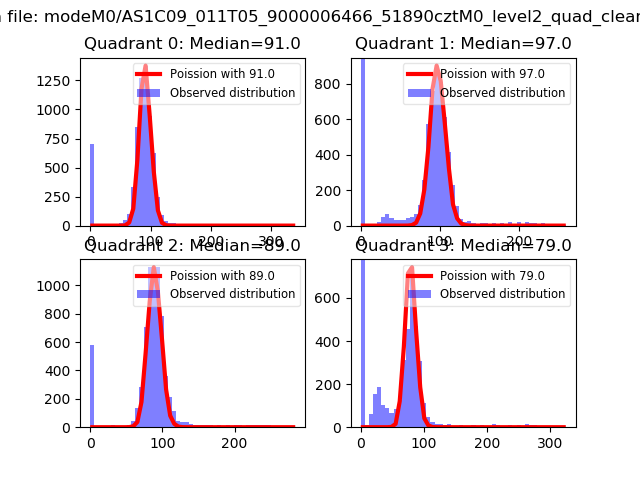 |
 |
| Quadrant-wise count rates Data is divided into 100 sec bins |
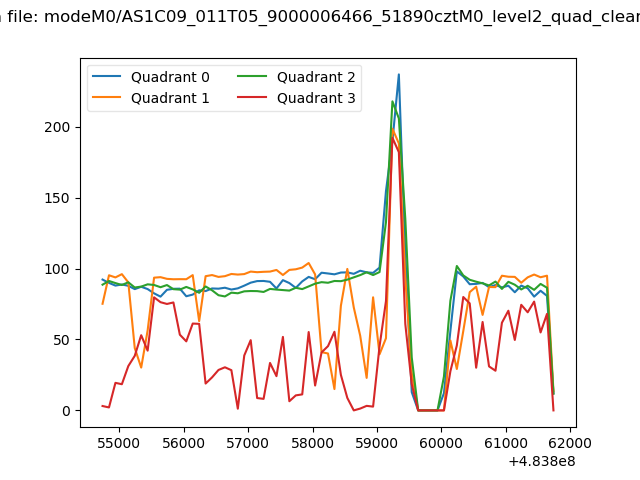 |
|
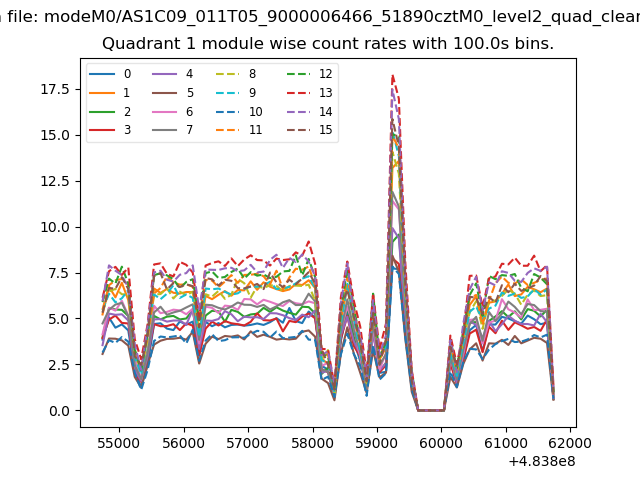
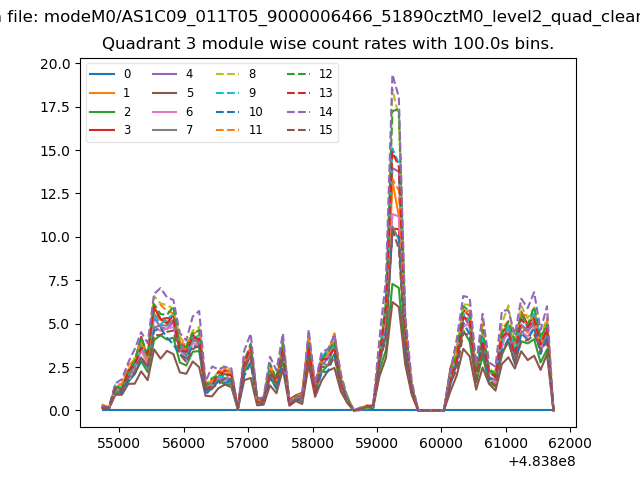
| Module-wise count rates for Quadrant A Data is divided into 100 sec bins |
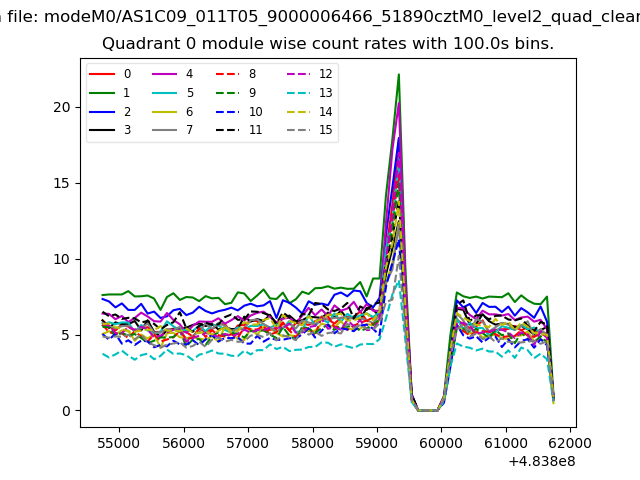 |
 |
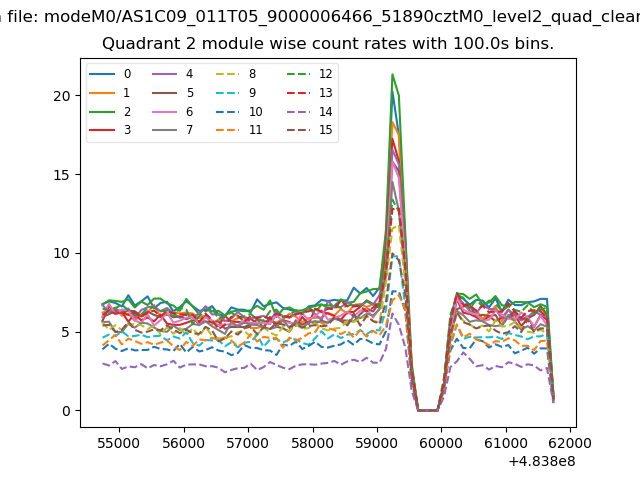
| Module-wise count rates for Quadrant B Data is divided into 100 sec bins |
 |
 |
| Module-wise count rates for Quadrant C Data is divided into 100 sec bins |
 |
 |
| Module-wise count rates for Quadrant D Data is divided into 100 sec bins |
 |
 |
| Parameter | Plot |
|---|---|
| CZT HV Monitor | 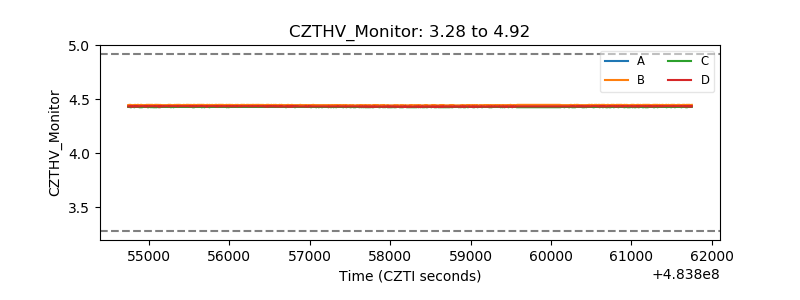 |
| D_VDD | 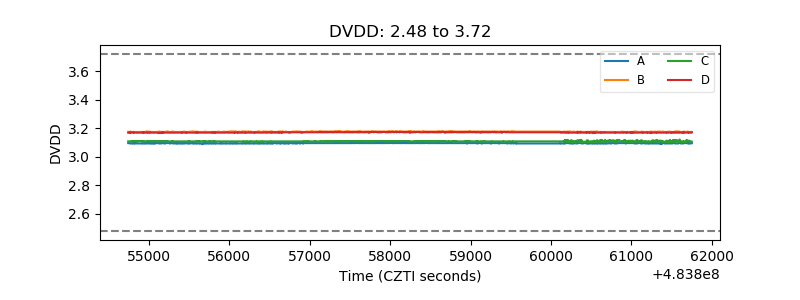 |
| Temperature 1 | 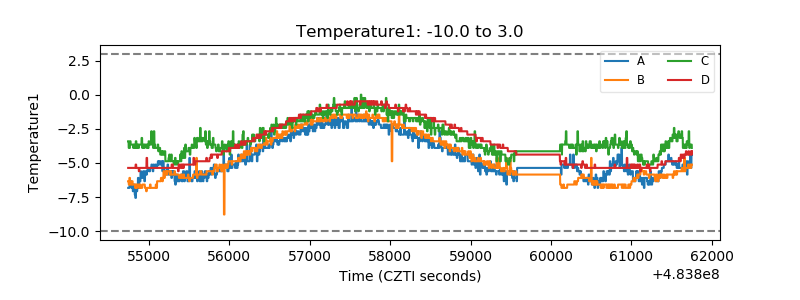 |
| Veto HV Monitor | 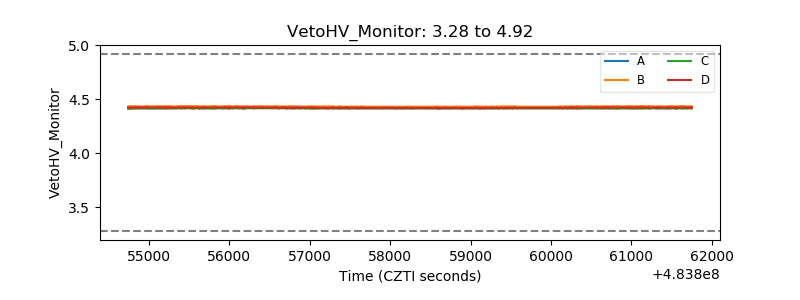 |
| Veto LLD | 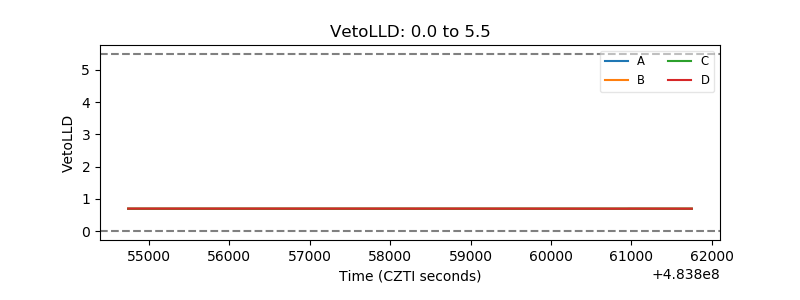 |
| Alpha Counter | 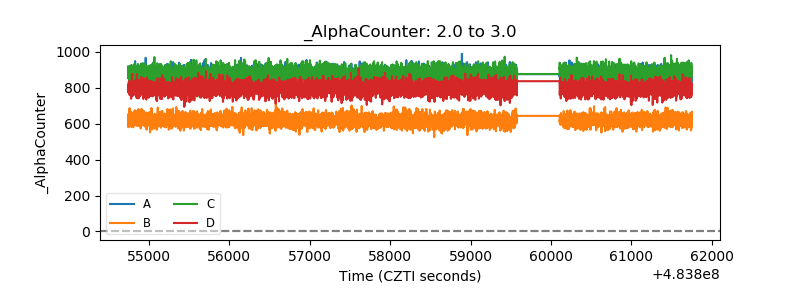 |
| _CPM_Rate | 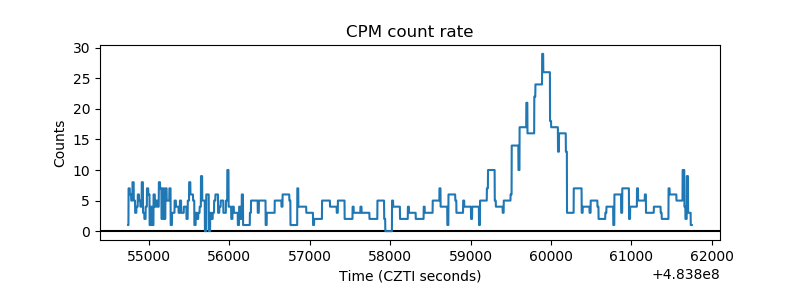 |
| CZT Counter | 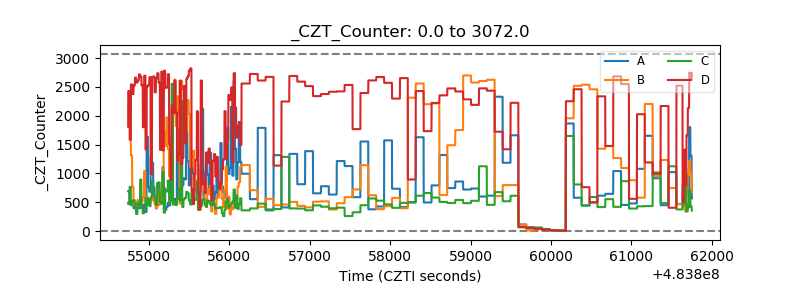 |
| +2.5 Volts monitor | 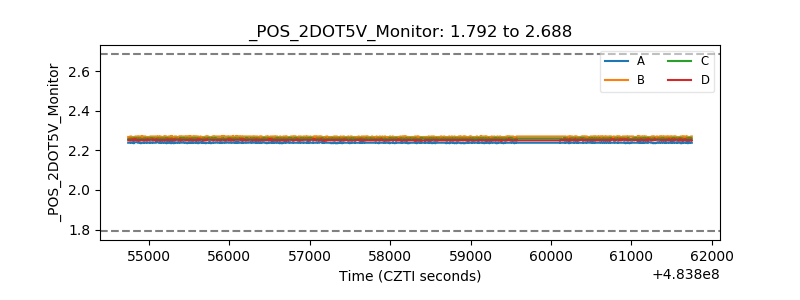 |
| +5 Volts monitor | 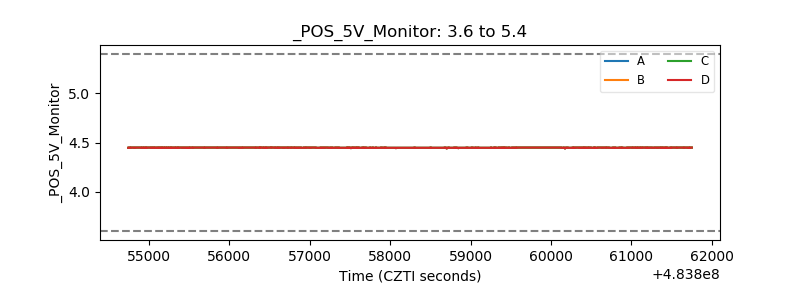 |
| _ROLL_ROT | 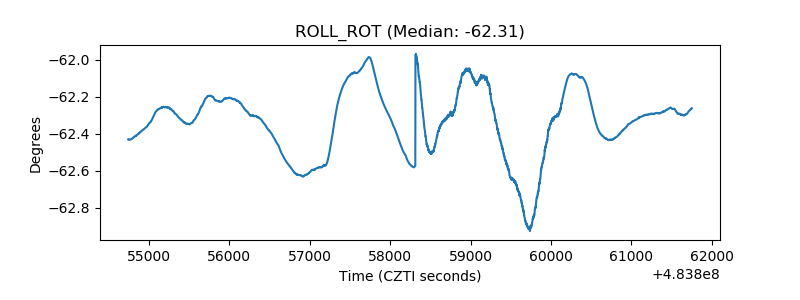 |
| _Roll_DEC | 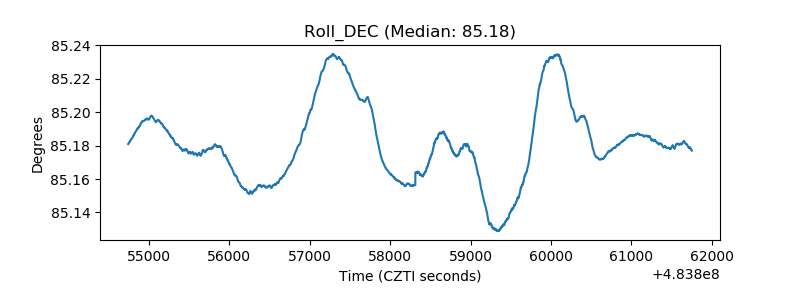 |
| _Roll_RA | 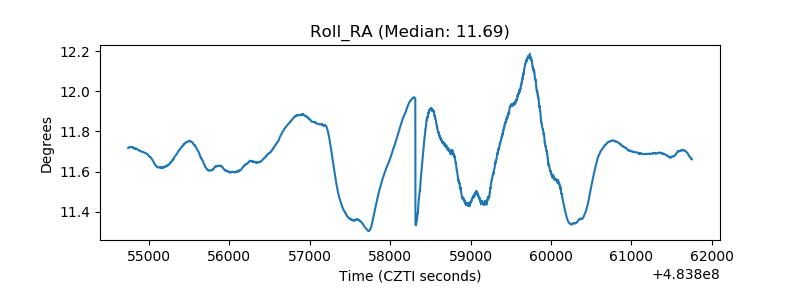 |
| Veto Counter | 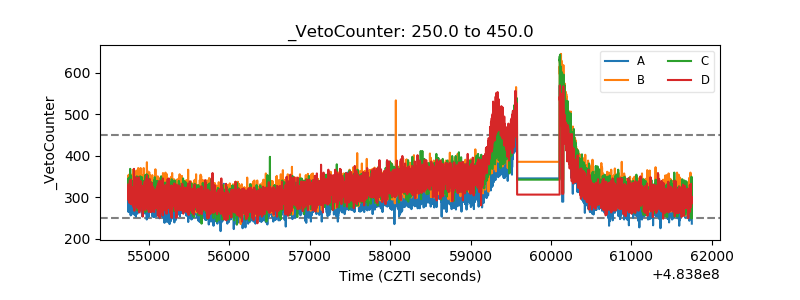 |