| Param | Original file | Final file |
|---|---|---|
| Filename | modeM0/AS1C09_011T05_9000006466_51891cztM0_level2.fits | modeM0/AS1C09_011T05_9000006466_51891cztM0_level2_quad_clean.evt |
| Size (bytes) | 946,503,360 | 88,718,400 |
| Size | 902.7 MB | 84.6 MB |
| Events in quadrant A | 6,523,288 | 655,672 |
| Events in quadrant B | 7,680,145 | 647,564 |
| Events in quadrant C | 4,974,990 | 643,285 |
| Events in quadrant D | 15,294,359 | 230,987 |
| Mode SS | |||
|---|---|---|---|
| Quadrant | BADHDUFLAG | Total packets | Discarded packets |
| A | 0 | 146 | 0 |
| B | 0 | 146 | 0 |
| C | 0 | 146 | 0 |
| D | 0 | 146 | 0 |
| Mode M0 | |||
|---|---|---|---|
| Quadrant | BADHDUFLAG | Total packets | Discarded packets |
| A | 0 | 24493 | 0 |
| B | 0 | 27910 | 0 |
| C | 0 | 19815 | 0 |
| D | 0 | 50472 | 0 |
| Quadrant | Total seconds | Saturated seconds | Saturation percentage |
|---|---|---|---|
| A | 7300 | 264 | 3.616438% |
| B | 7300 | 1118 | 15.315068% |
| C | 7301 | 219 | 2.999589% |
| D | 7301 | 4880 | 66.840159% |
Noise dominated data is calculated using 1-second bins in cleaned event files. If a bin has >2000 counts, and if more than 50% of those come from <1% of pixels, then it is considered to be noise-dominated and hence unusable.
| Quadrant | # 1 sec bins | Bins with >0 counts | Bins with >2000 counts | High rate bins dominated by noise | Noise dominated (total time) | Noise dominated (detector-on time) | Marked lightcurve |
|---|---|---|---|---|---|---|---|
| A | 7300 | 7300 | 185 | 185 | 2.53% | 2.53% | 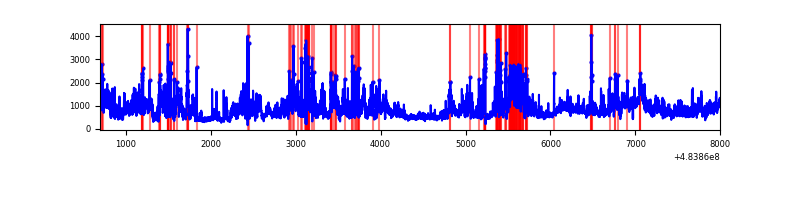 |
| B | 7300 | 7300 | 724 | 724 | 9.92% | 9.92% | 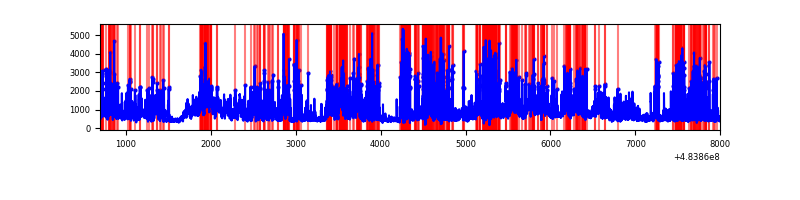 |
| C | 7301 | 7301 | 179 | 179 | 2.45% | 2.45% | 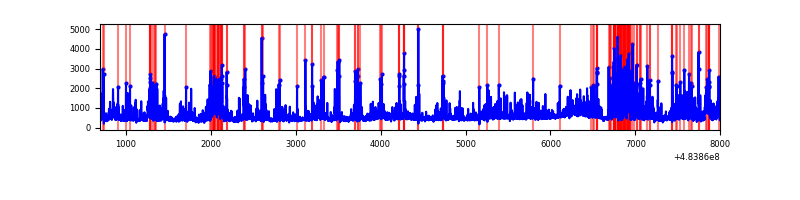 |
| D | 7300 | 7300 | 4120 | 4120 | 56.44% | 56.44% | 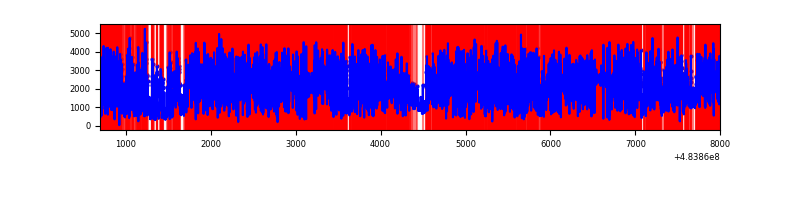 |
Top three noisy pixels from each quadrant. If the there are fewer than three noisy pixels in the level2.evt file, extra rows are filled as -1
| Pixel properties | Quadrant properties | ||||||
|---|---|---|---|---|---|---|---|
| Quadrant | DetID | PixID | Counts | Sigma | Mean | Median | Sigma |
| A | 12 | 3 | 2026319 | 10905.19 | 748 | 730 | 185.7 |
| A | 4 | 175 | 276948 | 1487.08 | 748 | 730 | 185.7 |
| A | 12 | 194 | 235056 | 1261.54 | 748 | 730 | 185.7 |
| B | 4 | 170 | 3011596 | 19718.83 | 713 | 687 | 152.7 |
| B | 10 | 254 | 508083 | 3323.0 | 713 | 687 | 152.7 |
| B | 4 | 171 | 309557 | 2022.83 | 713 | 687 | 152.7 |
| C | 13 | 3 | 561398 | 2787.7 | 729 | 719 | 201.1 |
| C | 15 | 189 | 329234 | 1633.38 | 729 | 719 | 201.1 |
| C | 14 | 245 | 273253 | 1355.04 | 729 | 719 | 201.1 |
| D | 11 | 129 | 10526596 | 83491.44 | 447 | 431 | 126.1 |
| D | 12 | 17 | 752852 | 5968.05 | 447 | 431 | 126.1 |
| D | 6 | 42 | 488598 | 3872.04 | 447 | 431 | 126.1 |
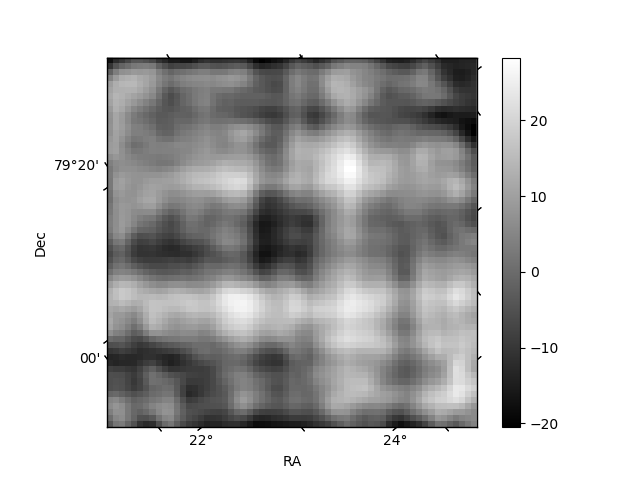
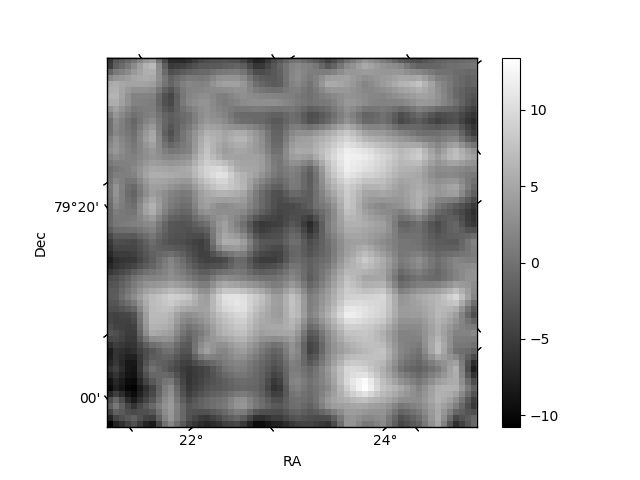
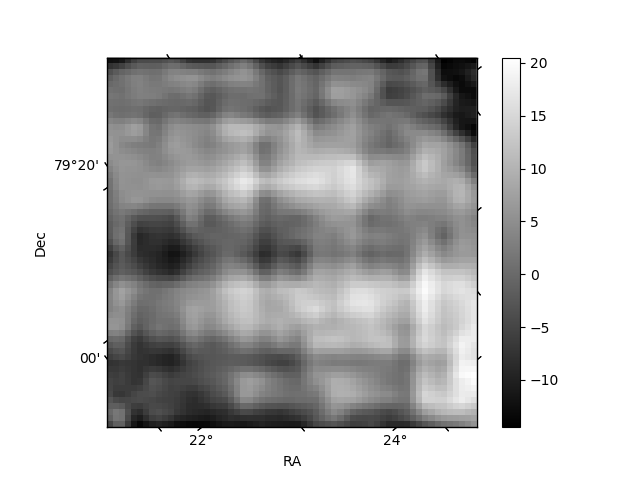
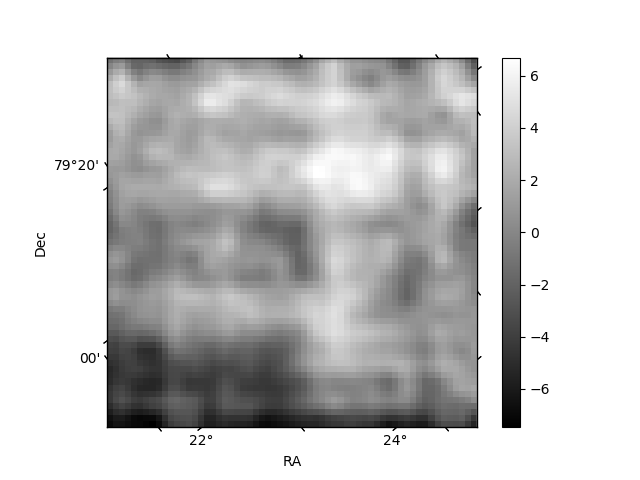
Histogram calculated using DETX and DETY for each event in the final _common_clean file
| Quadrant A | 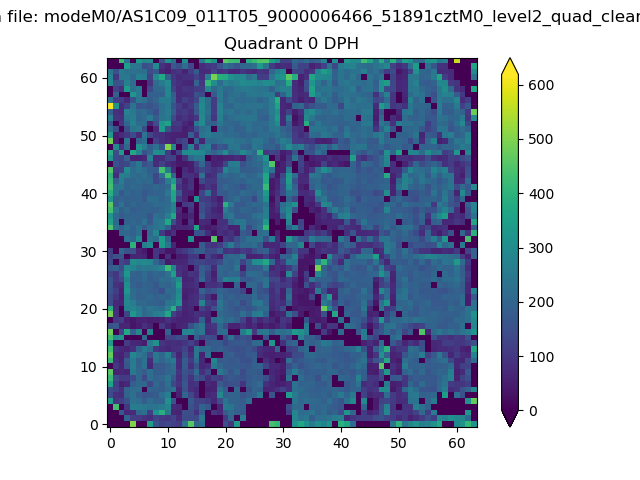 |
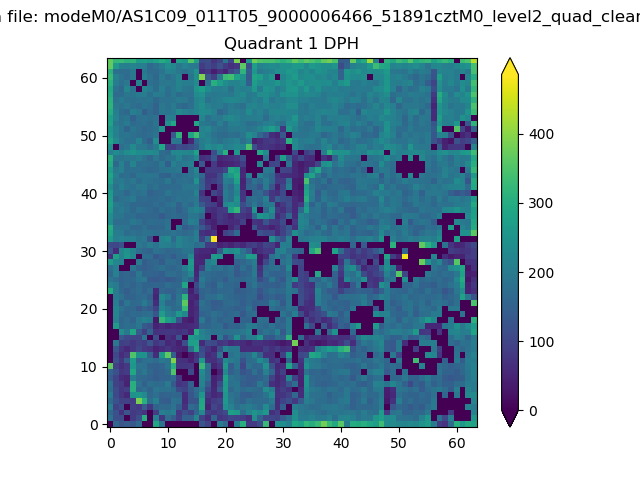 |
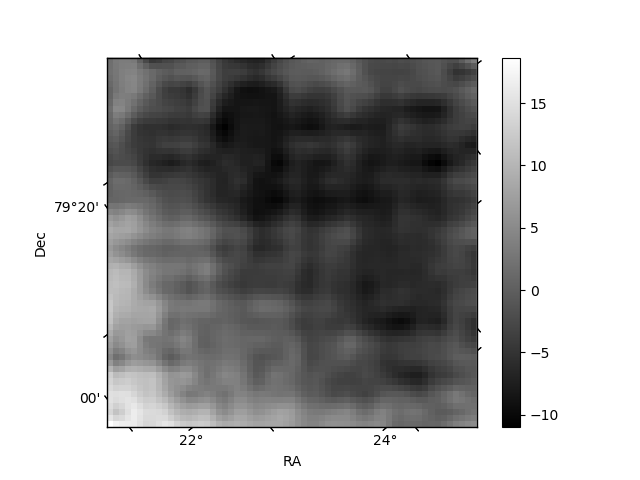
Quadrant B |
|---|---|---|---|
| Quadrant D | 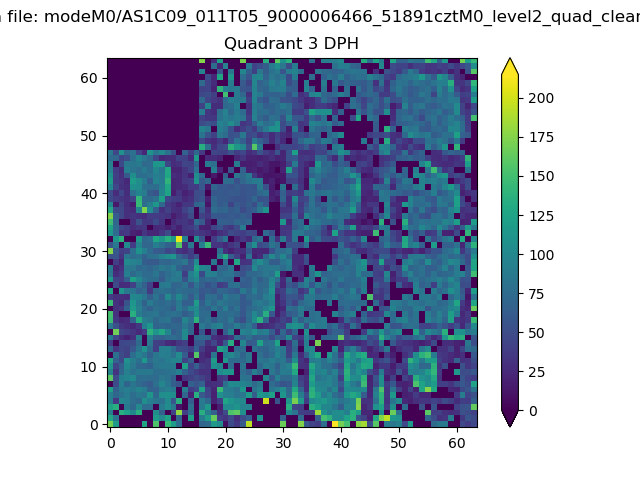 |
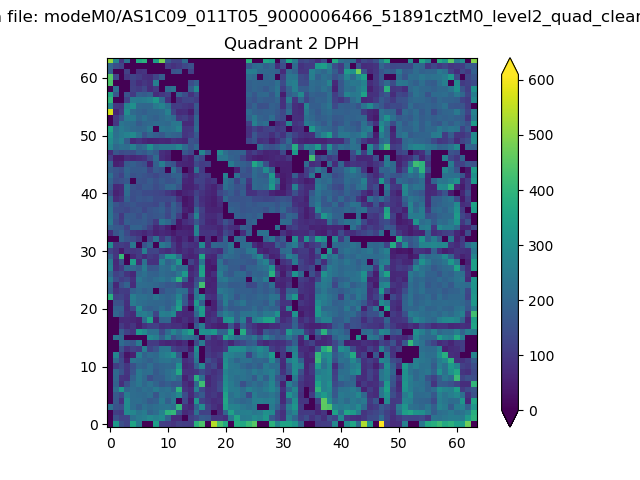 |
Quadrant C |
| Plot type | Count rate plots | Images |
|---|---|---|
| Comparison with Poisson distribution Blue bars denote a histogram of data divided into 1 sec bins. Red curve is a Poisson curve with rate = median count rate of data. |
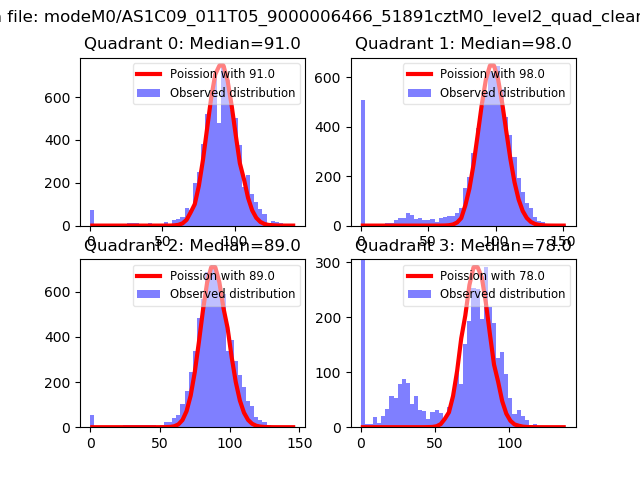 |
 |
| Quadrant-wise count rates Data is divided into 100 sec bins |
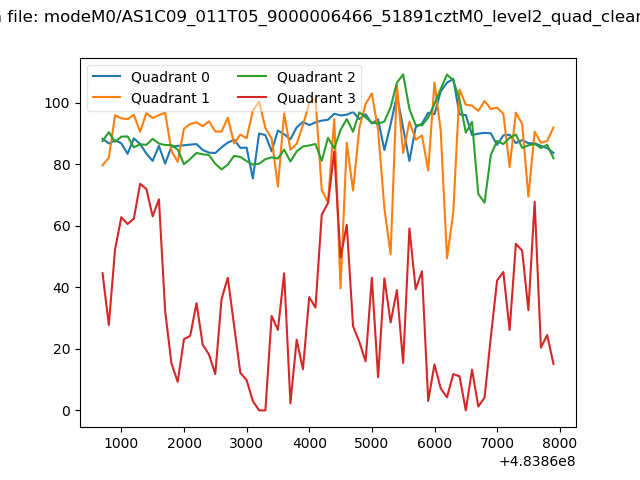 |
|
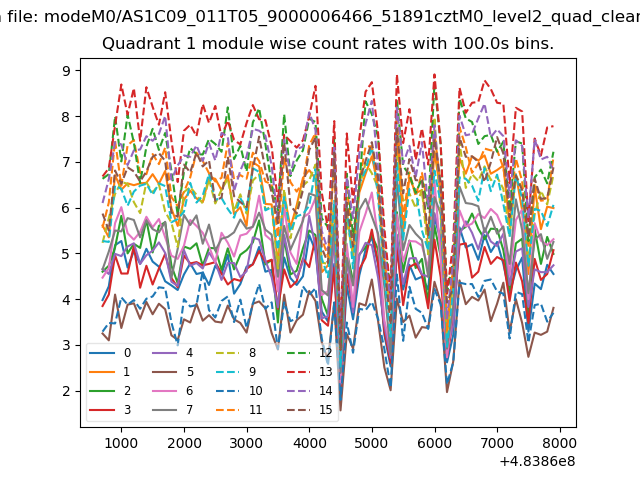
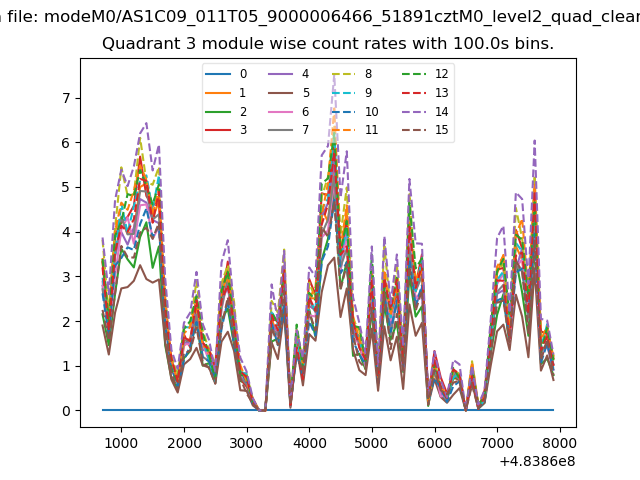
| Module-wise count rates for Quadrant A Data is divided into 100 sec bins |
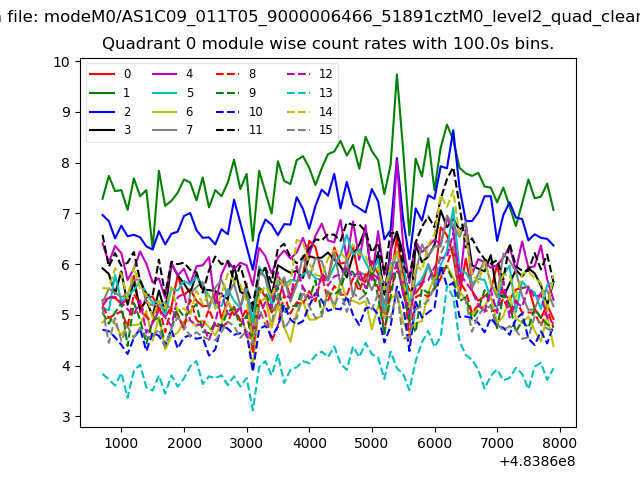 |
 |
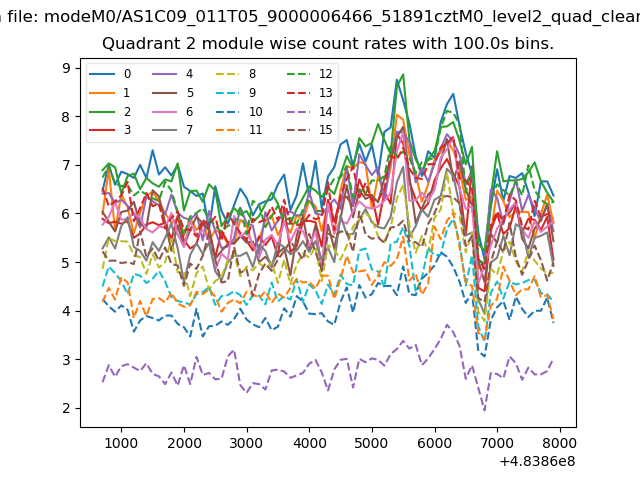
| Module-wise count rates for Quadrant B Data is divided into 100 sec bins |
 |
 |
| Module-wise count rates for Quadrant C Data is divided into 100 sec bins |
 |
 |
| Module-wise count rates for Quadrant D Data is divided into 100 sec bins |
 |
 |
| Parameter | Plot |
|---|---|
| CZT HV Monitor | 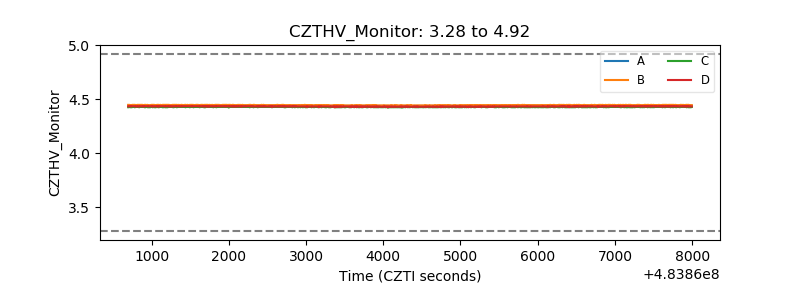 |
| D_VDD | 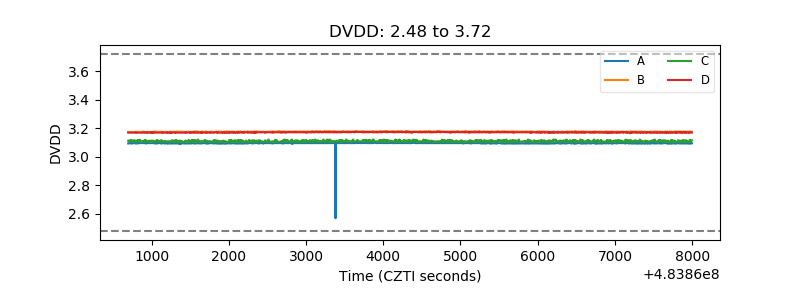 |
| Temperature 1 | 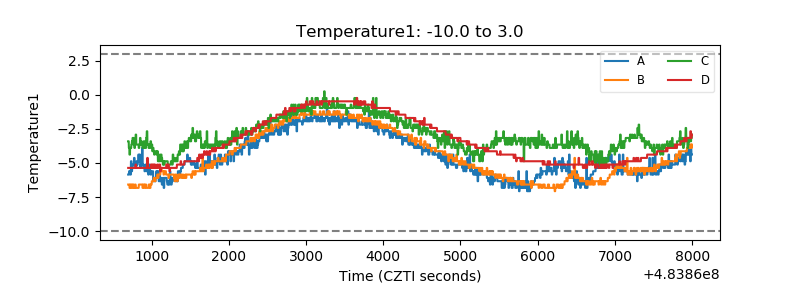 |
| Veto HV Monitor | 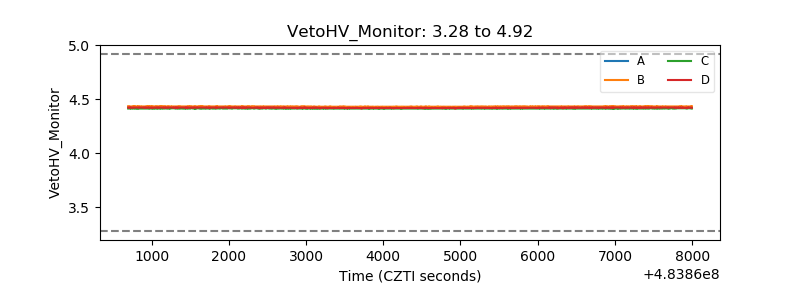 |
| Veto LLD | 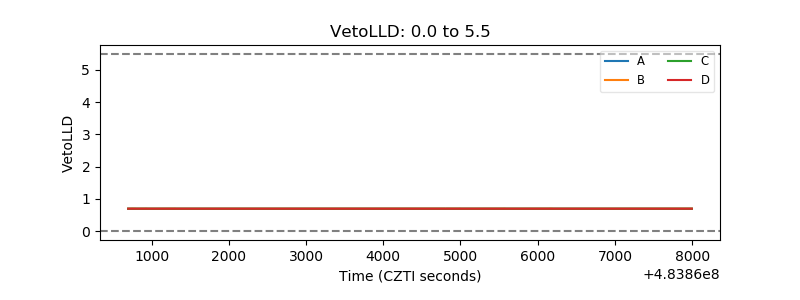 |
| Alpha Counter | 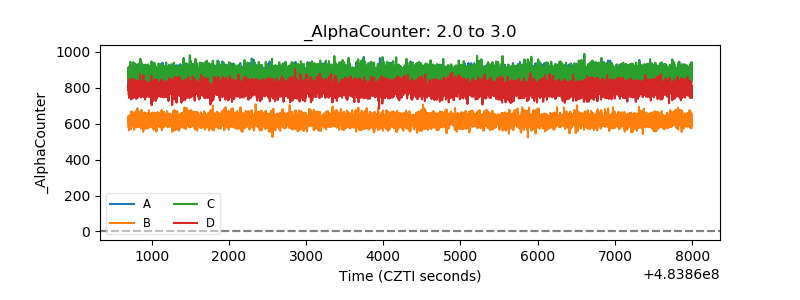 |
| _CPM_Rate | 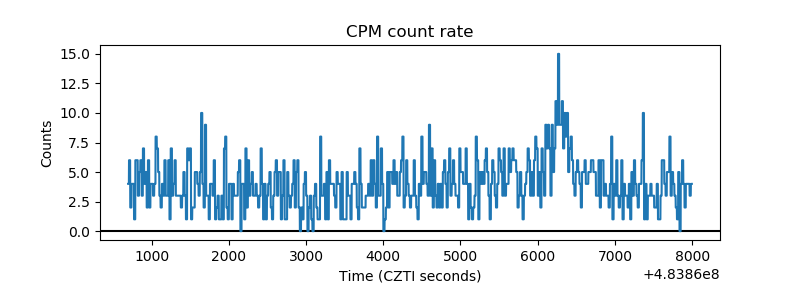 |
| CZT Counter | 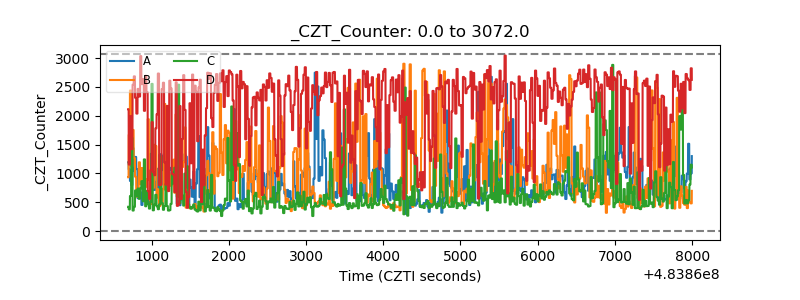 |
| +2.5 Volts monitor | 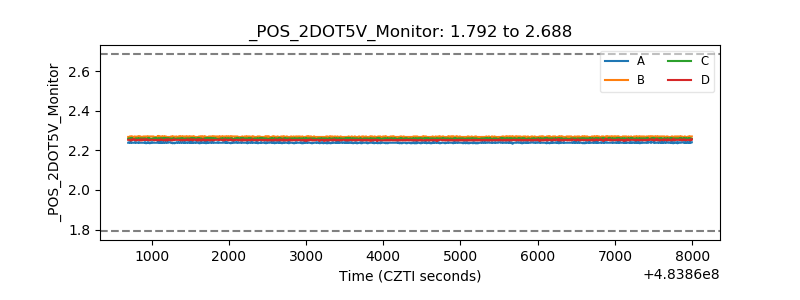 |
| +5 Volts monitor |  |
| _ROLL_ROT | 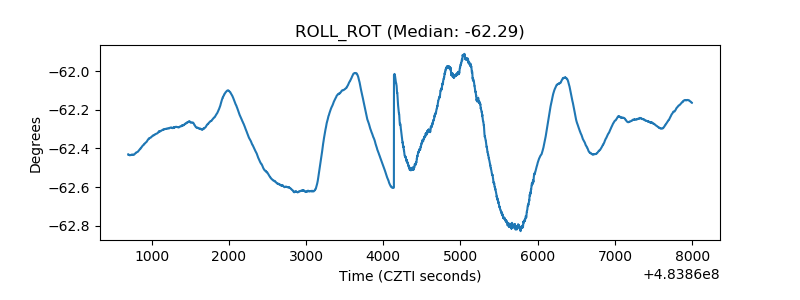 |
| _Roll_DEC | 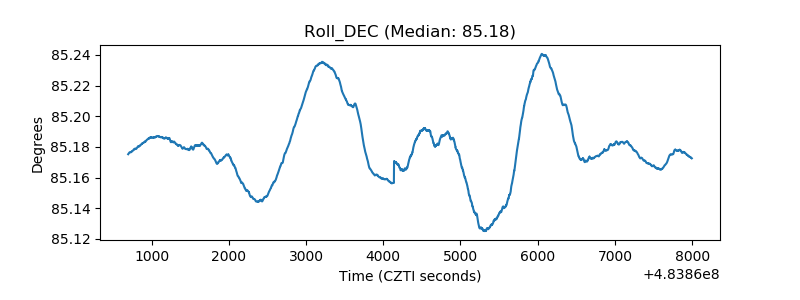 |
| _Roll_RA | 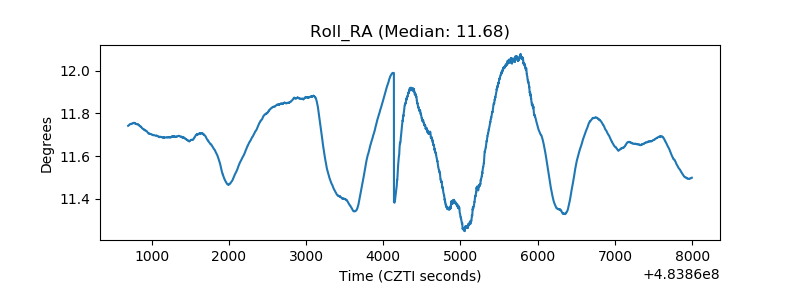 |
| Veto Counter | 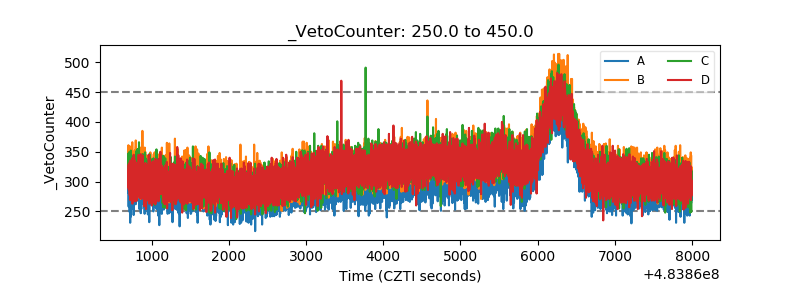 |