| Param | Original file | Final file |
|---|---|---|
| Filename | modeM0/AS1C09_011T05_9000006466_51896cztM0_level2.fits | modeM0/AS1C09_011T05_9000006466_51896cztM0_level2_quad_clean.evt |
| Size (bytes) | 2,274,212,160 | 210,571,200 |
| Size | 2.1 GB | 200.8 MB |
| Events in quadrant A | 15,904,968 | 1,537,081 |
| Events in quadrant B | 19,232,208 | 1,422,500 |
| Events in quadrant C | 11,918,311 | 1,542,922 |
| Events in quadrant D | 35,736,634 | 625,905 |
| Mode SS | |||
|---|---|---|---|
| Quadrant | BADHDUFLAG | Total packets | Discarded packets |
| A | 0 | 369 | 0 |
| B | 0 | 370 | 0 |
| C | 0 | 370 | 0 |
| D | 0 | 369 | 1 |
| Mode M0 | |||
|---|---|---|---|
| Quadrant | BADHDUFLAG | Total packets | Discarded packets |
| A | 0 | 59696 | 105 |
| B | 0 | 69599 | 136 |
| C | 0 | 47533 | 68 |
| D | 0 | 118846 | 296 |
| Mode M9 | |||
|---|---|---|---|
| Quadrant | BADHDUFLAG | Total packets | Discarded packets |
| A | 0 | 13 | 0 |
| B | 0 | 13 | 0 |
| C | 0 | 13 | 0 |
| D | 0 | 13 | 0 |
| Quadrant | Total seconds | Saturated seconds | Saturation percentage |
|---|---|---|---|
| A | 18071 | 1398 | 7.736152% |
| B | 18074 | 3847 | 21.284718% |
| C | 18072 | 758 | 4.194334% |
| D | 18054 | 11314 | 62.667553% |
Noise dominated data is calculated using 1-second bins in cleaned event files. If a bin has >2000 counts, and if more than 50% of those come from <1% of pixels, then it is considered to be noise-dominated and hence unusable.
| Quadrant | # 1 sec bins | Bins with >0 counts | Bins with >2000 counts | High rate bins dominated by noise | Noise dominated (total time) | Noise dominated (detector-on time) | Marked lightcurve |
|---|---|---|---|---|---|---|---|
| A | 19442 | 18096 | 998 | 998 | 5.13% | 5.52% | 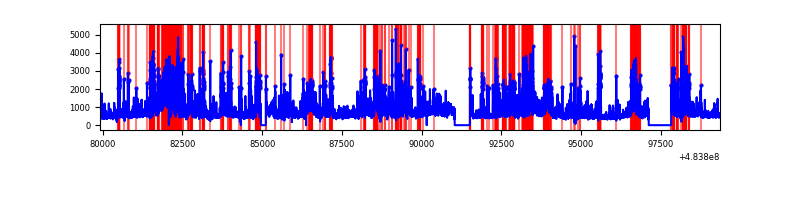 |
| B | 19442 | 18094 | 2801 | 2801 | 14.41% | 15.48% | 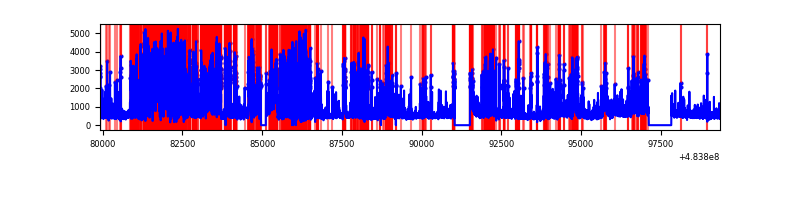 |
| C | 19442 | 18092 | 485 | 485 | 2.49% | 2.68% | 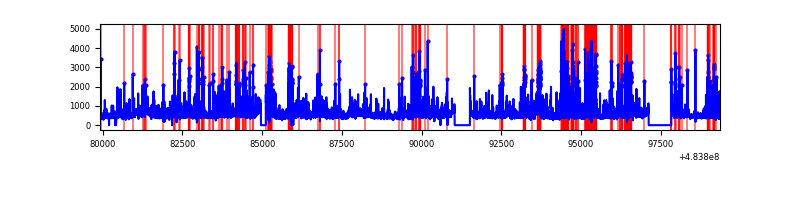 |
| D | 19440 | 18076 | 9563 | 9563 | 49.19% | 52.90% | 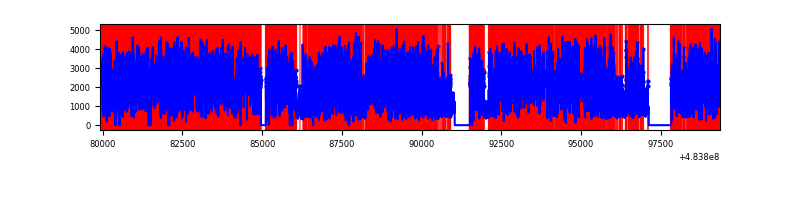 |
Top three noisy pixels from each quadrant. If the there are fewer than three noisy pixels in the level2.evt file, extra rows are filled as -1
| Pixel properties | Quadrant properties | ||||||
|---|---|---|---|---|---|---|---|
| Quadrant | DetID | PixID | Counts | Sigma | Mean | Median | Sigma |
| A | 12 | 3 | 2644386 | 5742.65 | 1863 | 1817 | 460.2 |
| A | 5 | 241 | 1047686 | 2272.81 | 1863 | 1817 | 460.2 |
| A | 15 | 174 | 782884 | 1697.36 | 1863 | 1817 | 460.2 |
| B | 4 | 170 | 8636839 | 23703.65 | 1722 | 1661 | 364.3 |
| B | 10 | 254 | 702249 | 1923.12 | 1722 | 1661 | 364.3 |
| B | 4 | 171 | 594419 | 1627.13 | 1722 | 1661 | 364.3 |
| C | 3 | 233 | 529939 | 1047.18 | 1848 | 1827 | 504.3 |
| C | 15 | 230 | 516033 | 1019.6 | 1848 | 1827 | 504.3 |
| C | 13 | 3 | 510357 | 1008.35 | 1848 | 1827 | 504.3 |
| D | 11 | 129 | 16065277 | 43286.64 | 1192 | 1145 | 371.1 |
| D | 6 | 42 | 8200628 | 22094.44 | 1192 | 1145 | 371.1 |
| D | 12 | 17 | 1954236 | 5262.83 | 1192 | 1145 | 371.1 |
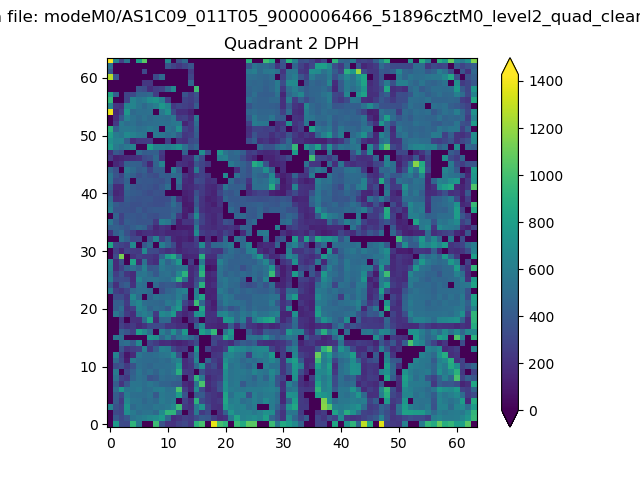
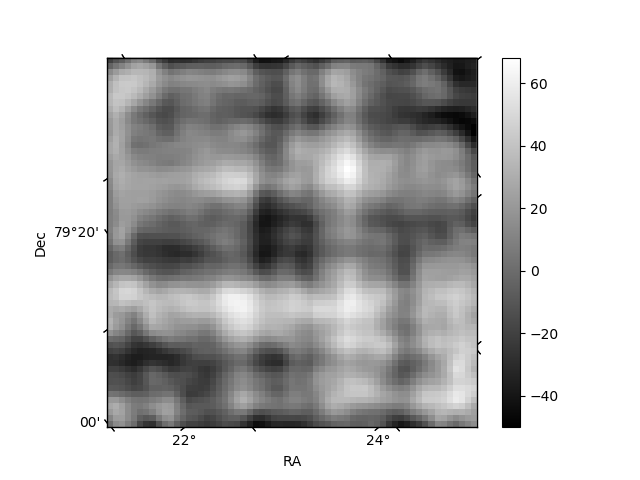
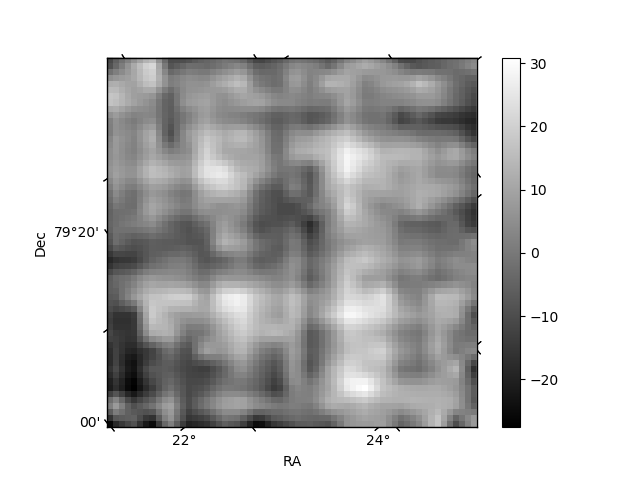
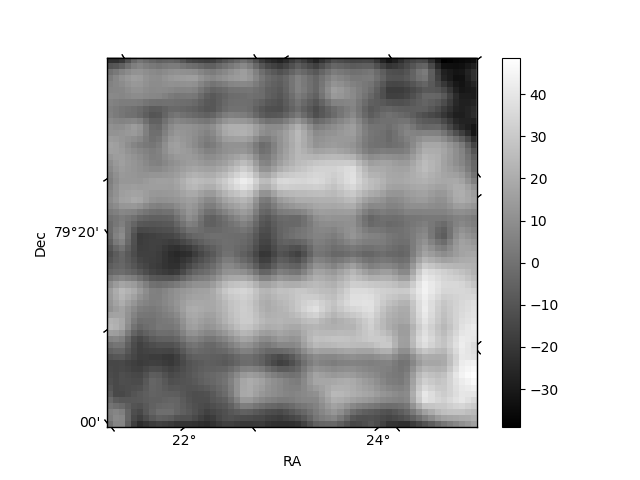
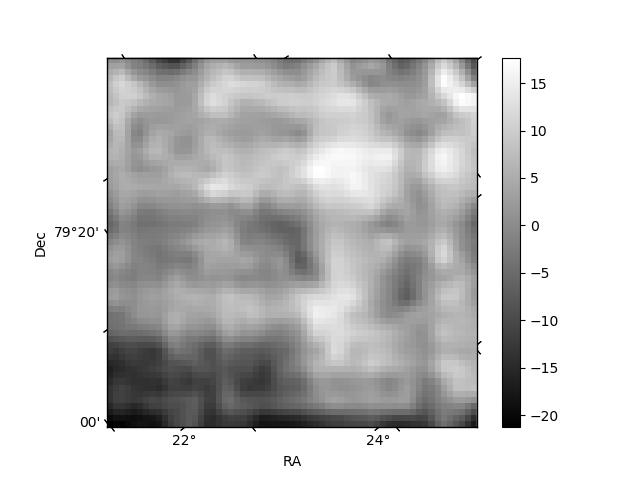
Histogram calculated using DETX and DETY for each event in the final _common_clean file
| Quadrant A | 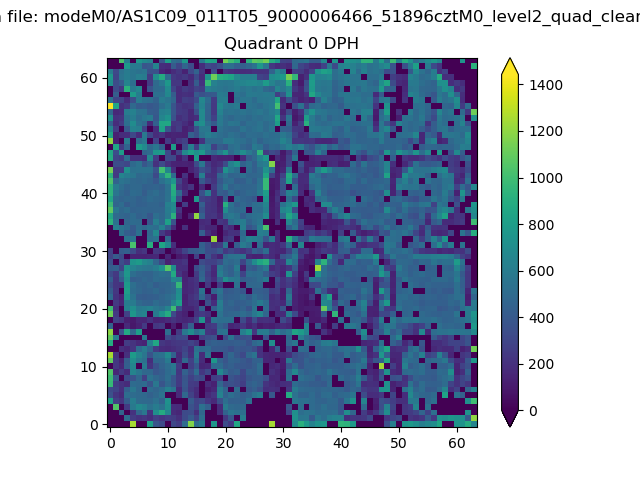 |
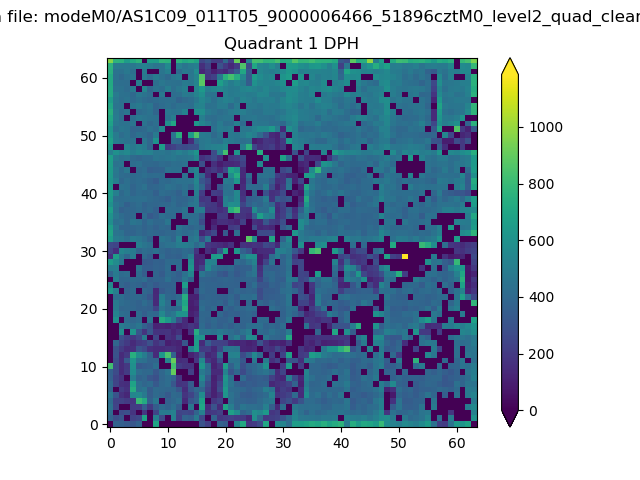 |
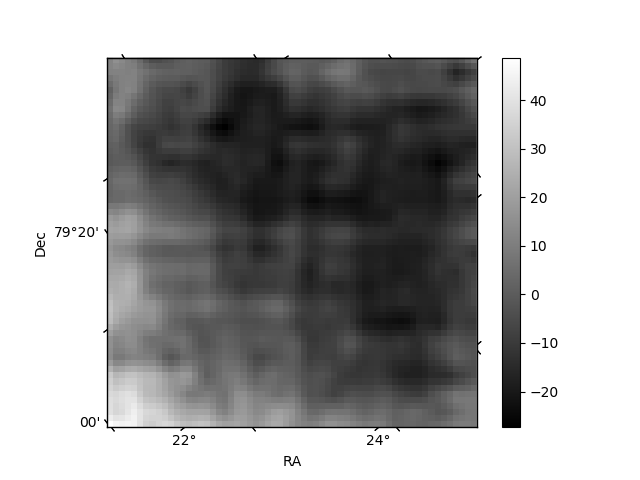
Quadrant B |
|---|---|---|---|
| Quadrant D | 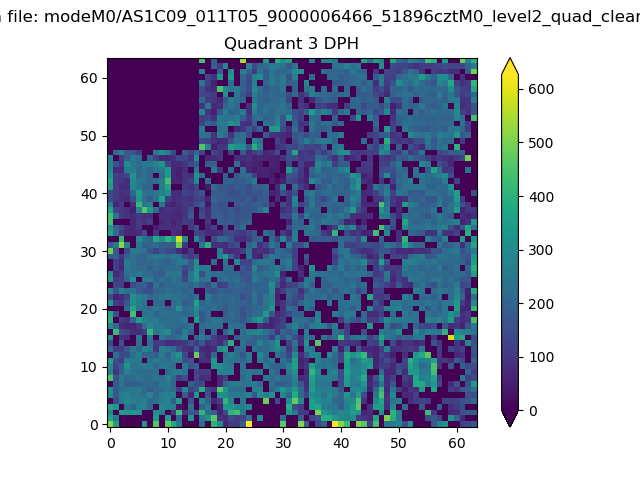 |
 |
Quadrant C |
| Plot type | Count rate plots | Images |
|---|---|---|
| Comparison with Poisson distribution Blue bars denote a histogram of data divided into 1 sec bins. Red curve is a Poisson curve with rate = median count rate of data. |
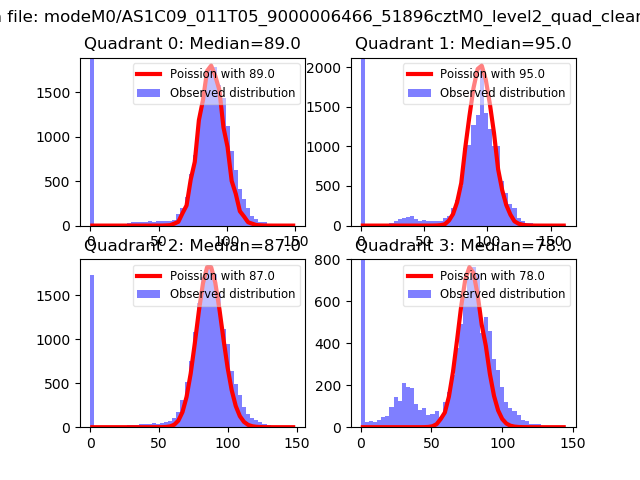 |
 |
| Quadrant-wise count rates Data is divided into 100 sec bins |
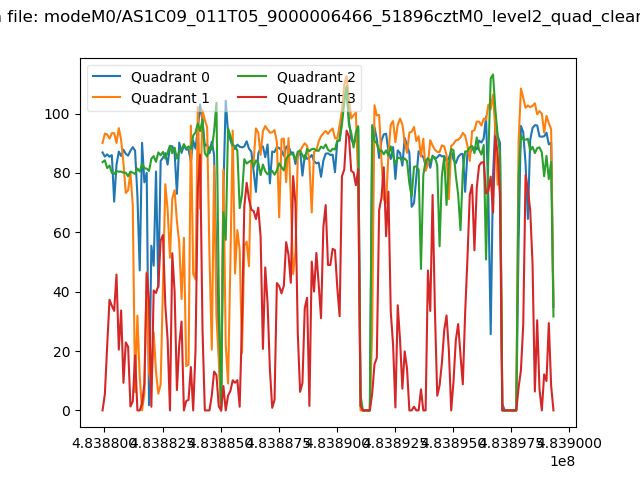 |
|
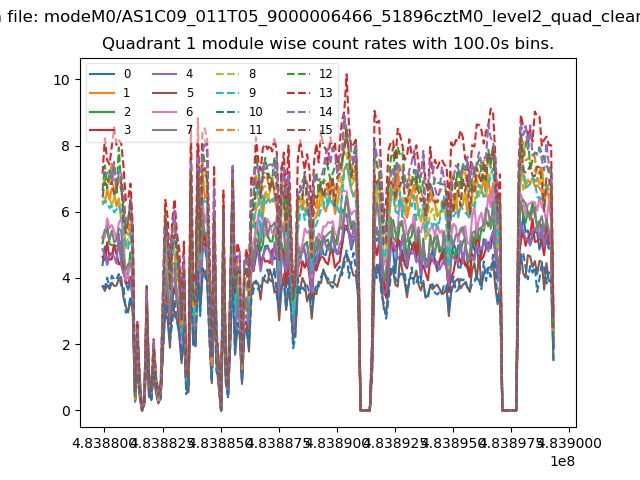
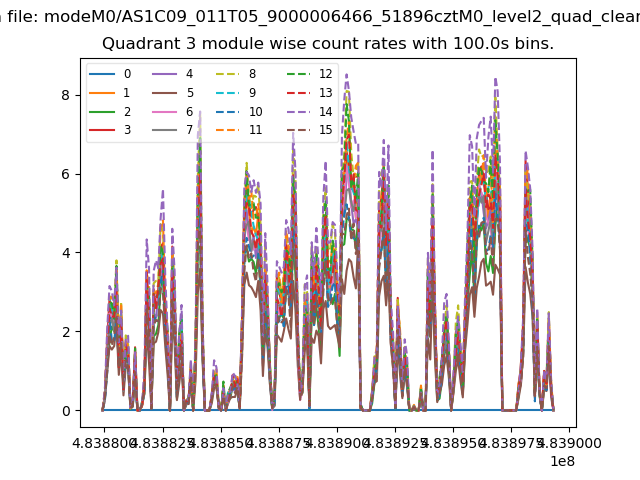
| Module-wise count rates for Quadrant A Data is divided into 100 sec bins |
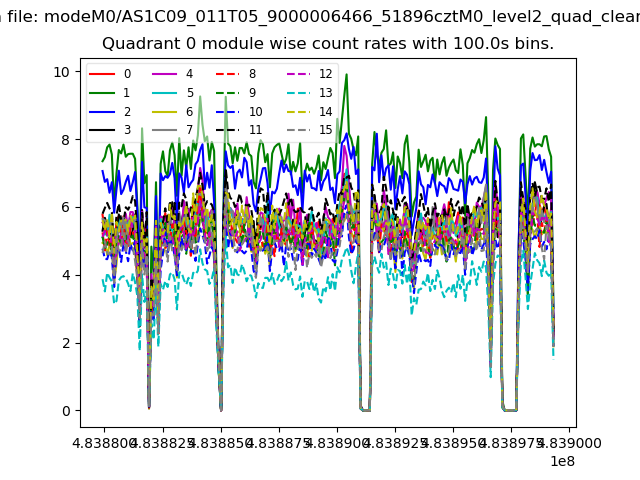 |
 |
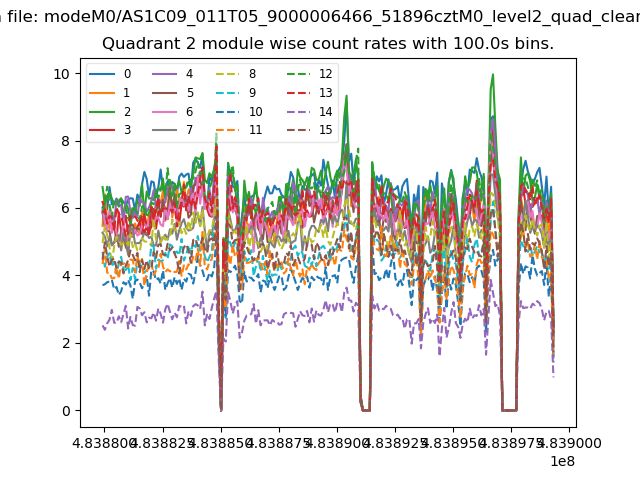
| Module-wise count rates for Quadrant B Data is divided into 100 sec bins |
 |
 |
| Module-wise count rates for Quadrant C Data is divided into 100 sec bins |
 |
 |
| Module-wise count rates for Quadrant D Data is divided into 100 sec bins |
 |
 |
| Parameter | Plot |
|---|---|
| CZT HV Monitor | 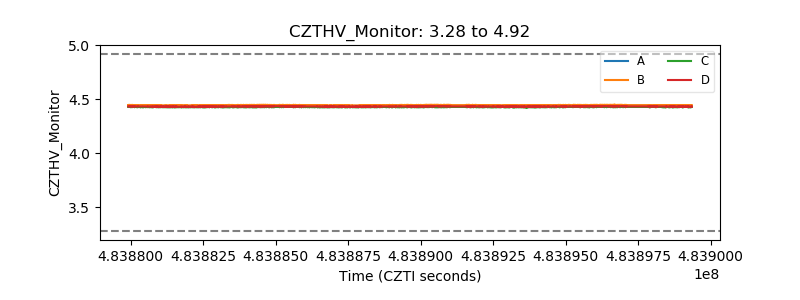 |
| D_VDD | 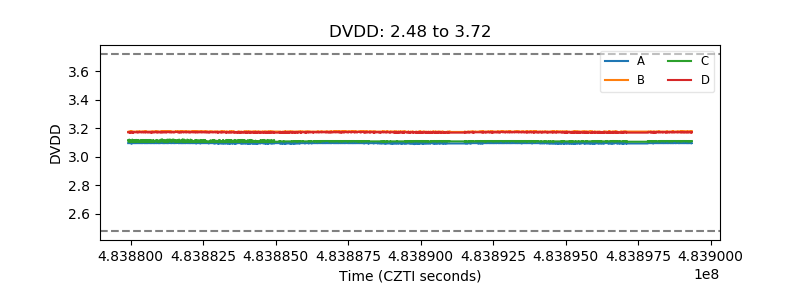 |
| Temperature 1 | 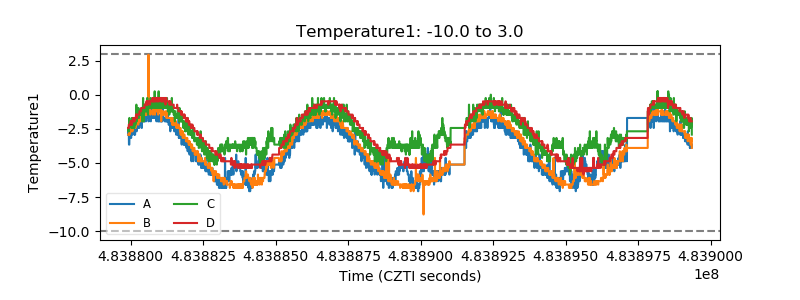 |
| Veto HV Monitor |  |
| Veto LLD | 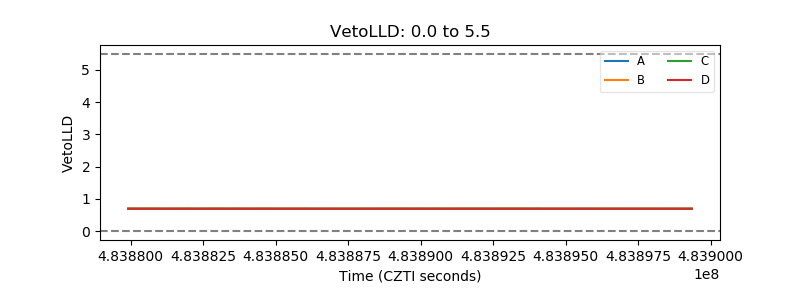 |
| Alpha Counter | 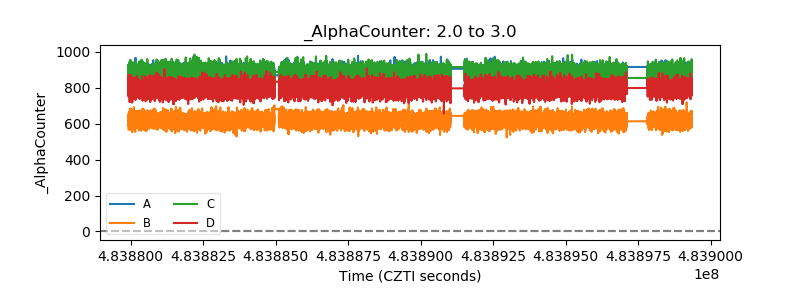 |
| _CPM_Rate | 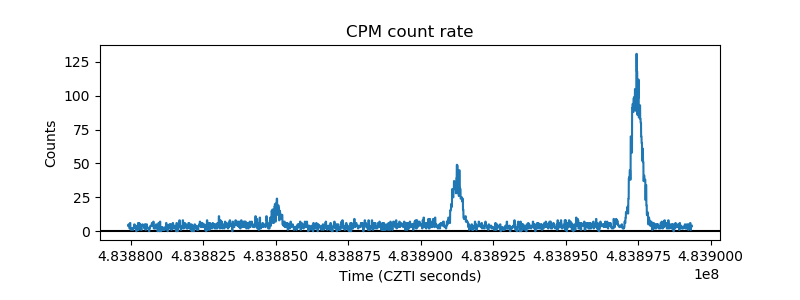 |
| CZT Counter | 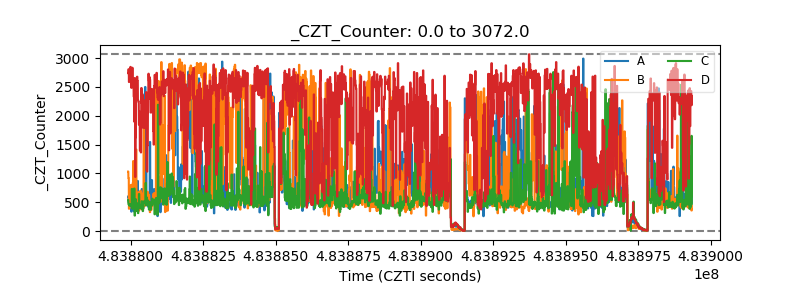 |
| +2.5 Volts monitor | 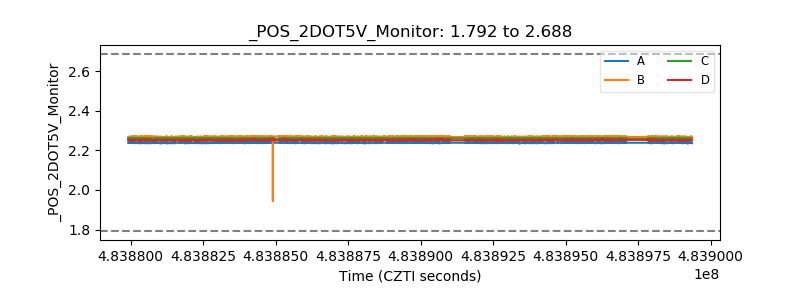 |
| +5 Volts monitor | 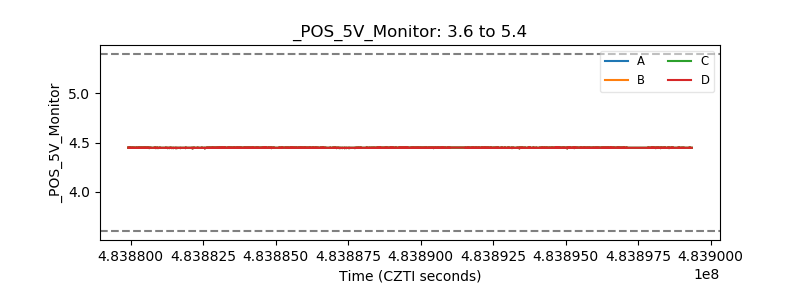 |
| _ROLL_ROT | 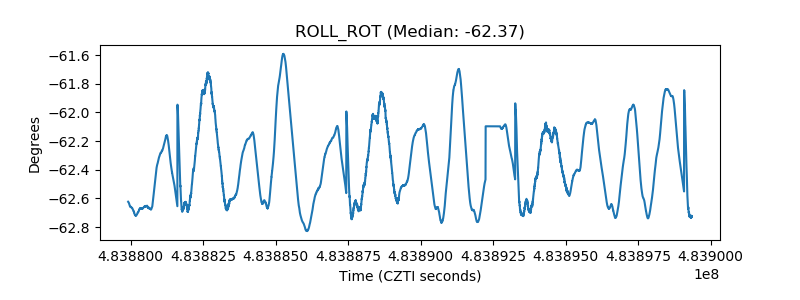 |
| _Roll_DEC | 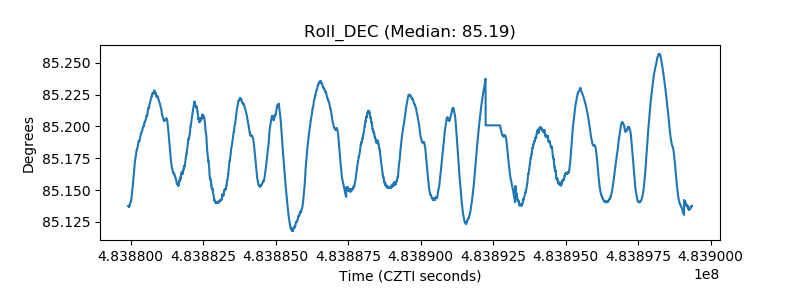 |
| _Roll_RA | 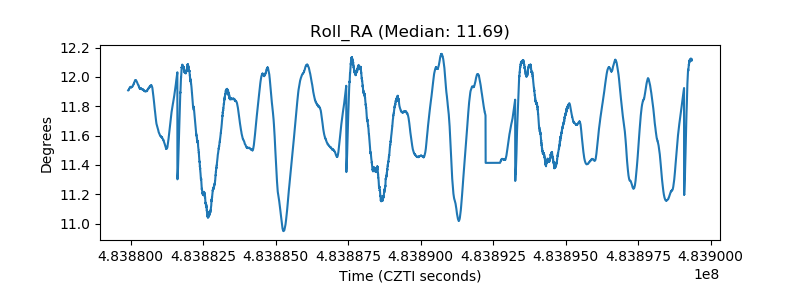 |
| Veto Counter | 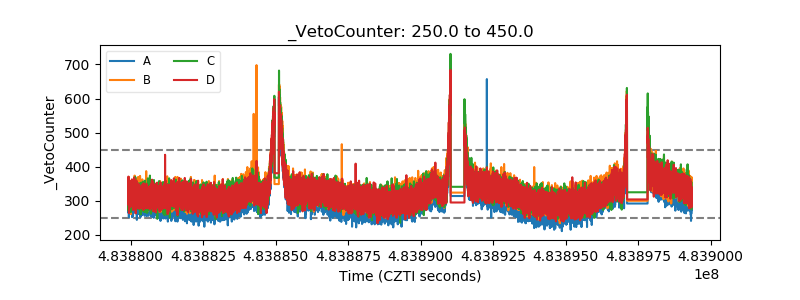 |