| Param | Original file | Final file |
|---|---|---|
| Filename | modeM0/AS1C09_011T05_9000006466_51897cztM0_level2.fits | modeM0/AS1C09_011T05_9000006466_51897cztM0_level2_quad_clean.evt |
| Size (bytes) | 691,416,000 | 83,597,760 |
| Size | 659.4 MB | 79.7 MB |
| Events in quadrant A | 4,374,042 | 610,115 |
| Events in quadrant B | 3,941,678 | 655,557 |
| Events in quadrant C | 4,374,906 | 583,503 |
| Events in quadrant D | 12,404,256 | 233,357 |
| Mode SS | |||
|---|---|---|---|
| Quadrant | BADHDUFLAG | Total packets | Discarded packets |
| A | 0 | 130 | 0 |
| B | 0 | 130 | 0 |
| C | 0 | 130 | 0 |
| D | 0 | 130 | 0 |
| Mode M0 | |||
|---|---|---|---|
| Quadrant | BADHDUFLAG | Total packets | Discarded packets |
| A | 0 | 17329 | 1 |
| B | 0 | 16151 | 1 |
| C | 0 | 17386 | 1 |
| D | 0 | 41321 | 1 |
| Mode M9 | |||
|---|---|---|---|
| Quadrant | BADHDUFLAG | Total packets | Discarded packets |
| A | 0 | 9 | 0 |
| B | 0 | 9 | 0 |
| C | 0 | 9 | 0 |
| D | 0 | 9 | 0 |
| Quadrant | Total seconds | Saturated seconds | Saturation percentage |
|---|---|---|---|
| A | 6433 | 110 | 1.709933% |
| B | 6433 | 130 | 2.020830% |
| C | 6433 | 276 | 4.290378% |
| D | 6433 | 4110 | 63.889321% |
Noise dominated data is calculated using 1-second bins in cleaned event files. If a bin has >2000 counts, and if more than 50% of those come from <1% of pixels, then it is considered to be noise-dominated and hence unusable.
| Quadrant | # 1 sec bins | Bins with >0 counts | Bins with >2000 counts | High rate bins dominated by noise | Noise dominated (total time) | Noise dominated (detector-on time) | Marked lightcurve |
|---|---|---|---|---|---|---|---|
| A | 7308 | 6434 | 64 | 64 | 0.88% | 0.99% |  |
| B | 7308 | 6434 | 62 | 62 | 0.85% | 0.96% |  |
| C | 7308 | 6434 | 228 | 228 | 3.12% | 3.54% | 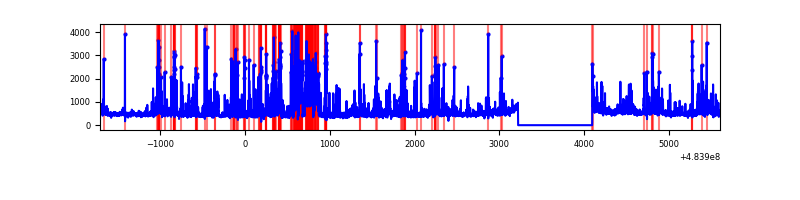 |
| D | 7308 | 6434 | 3483 | 3483 | 47.66% | 54.13% | 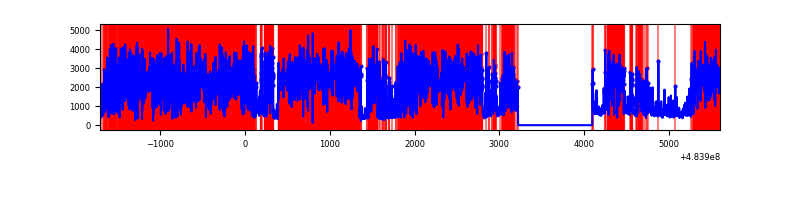 |
Top three noisy pixels from each quadrant. If the there are fewer than three noisy pixels in the level2.evt file, extra rows are filled as -1
| Pixel properties | Quadrant properties | ||||||
|---|---|---|---|---|---|---|---|
| Quadrant | DetID | PixID | Counts | Sigma | Mean | Median | Sigma |
| A | 12 | 3 | 427720 | 2544.61 | 676 | 660 | 167.8 |
| A | 4 | 3 | 288409 | 1714.53 | 676 | 660 | 167.8 |
| A | 15 | 174 | 186128 | 1105.1 | 676 | 660 | 167.8 |
| B | 10 | 254 | 410648 | 2890.73 | 672 | 649 | 141.8 |
| B | 12 | 32 | 141053 | 989.93 | 672 | 649 | 141.8 |
| B | 8 | 128 | 126126 | 884.69 | 672 | 649 | 141.8 |
| C | 10 | 171 | 600531 | 3273.6 | 661 | 656 | 183.2 |
| C | 15 | 230 | 272990 | 1486.16 | 661 | 656 | 183.2 |
| C | 13 | 3 | 260325 | 1417.05 | 661 | 656 | 183.2 |
| D | 6 | 42 | 5995298 | 45339.02 | 421 | 405 | 132.2 |
| D | 11 | 129 | 3495332 | 26431.93 | 421 | 405 | 132.2 |
| D | 12 | 17 | 492327 | 3720.38 | 421 | 405 | 132.2 |
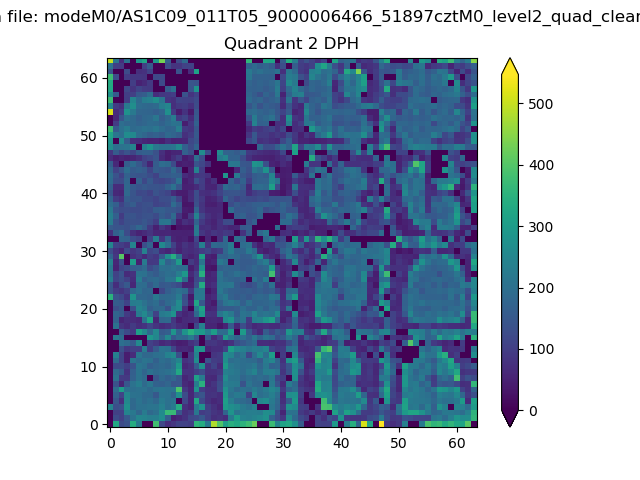
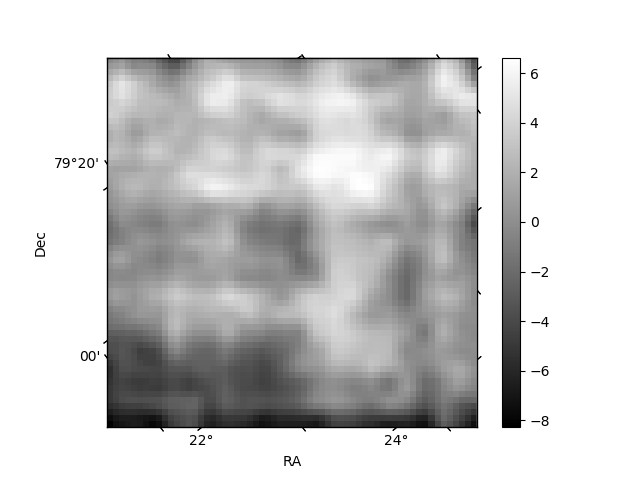
Histogram calculated using DETX and DETY for each event in the final _common_clean file
| Quadrant A | 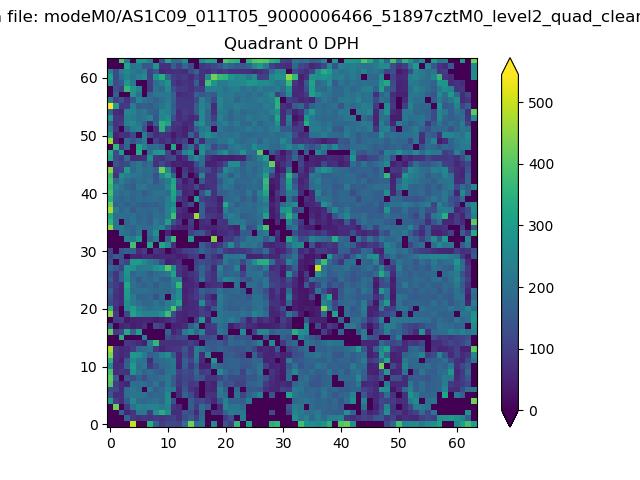 |
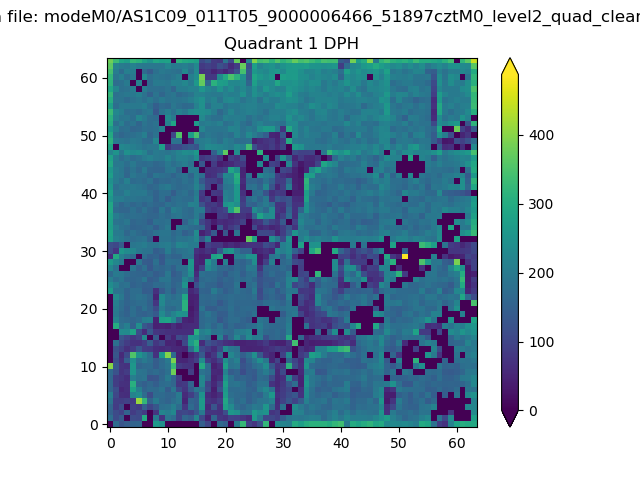 |
Quadrant B |
|---|---|---|---|
| Quadrant D | 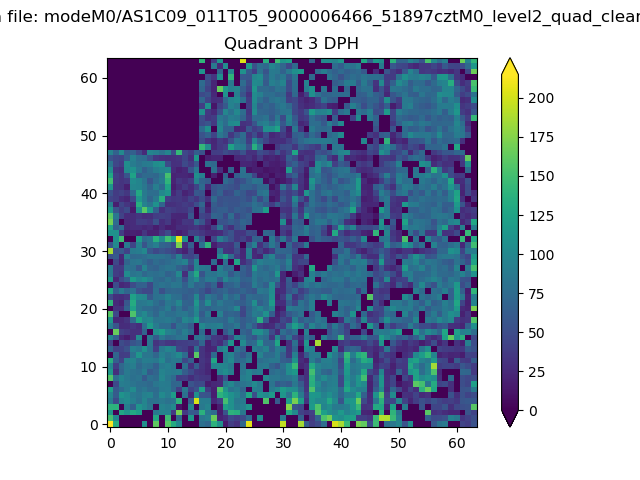 |
 |
Quadrant C |
| Plot type | Count rate plots | Images |
|---|---|---|
| Comparison with Poisson distribution Blue bars denote a histogram of data divided into 1 sec bins. Red curve is a Poisson curve with rate = median count rate of data. |
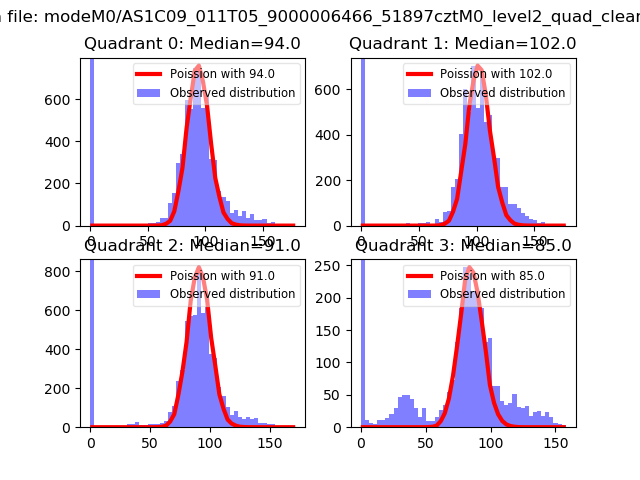 |
 |
| Quadrant-wise count rates Data is divided into 100 sec bins |
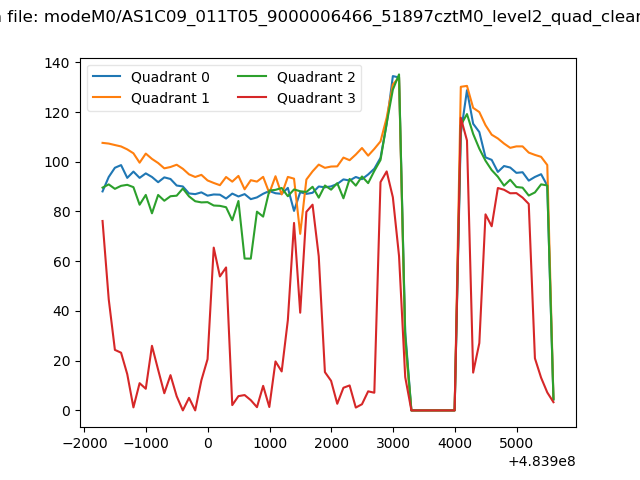 |
|
| Module-wise count rates for Quadrant A Data is divided into 100 sec bins |
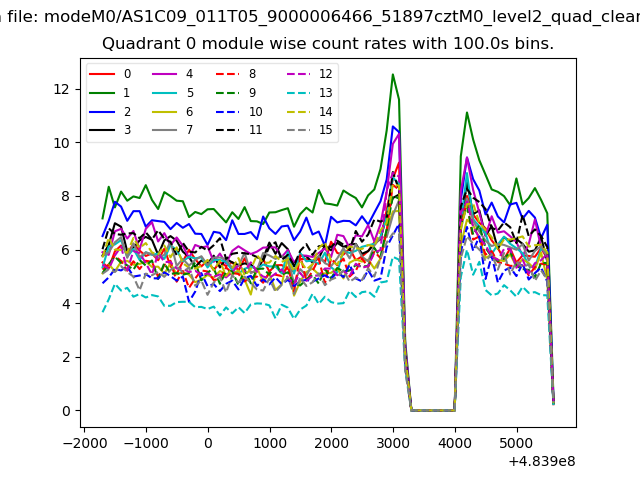 |
 |
| Module-wise count rates for Quadrant B Data is divided into 100 sec bins |
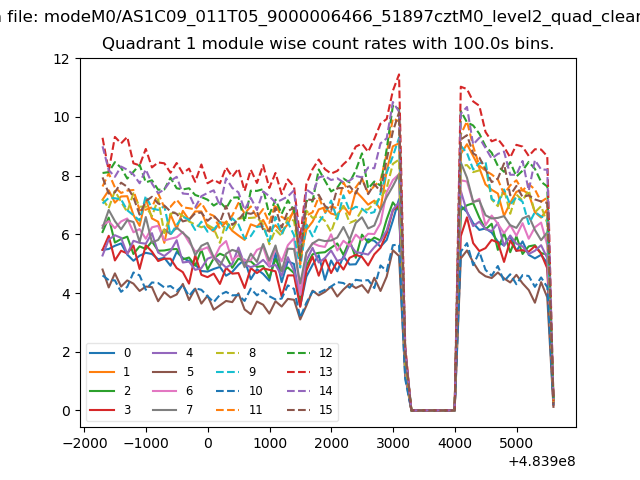 |
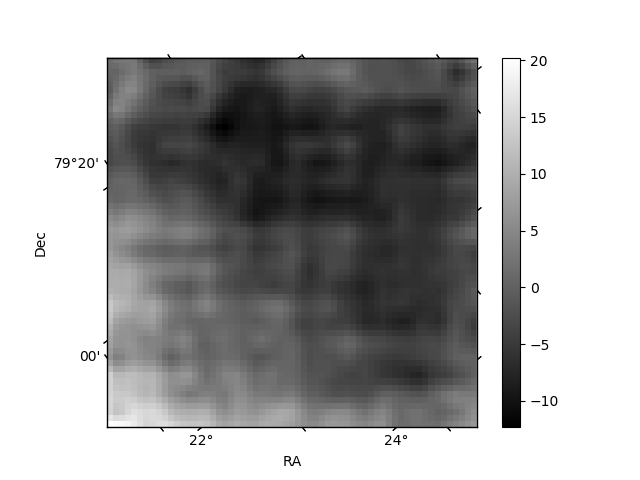 |
| Module-wise count rates for Quadrant C Data is divided into 100 sec bins |
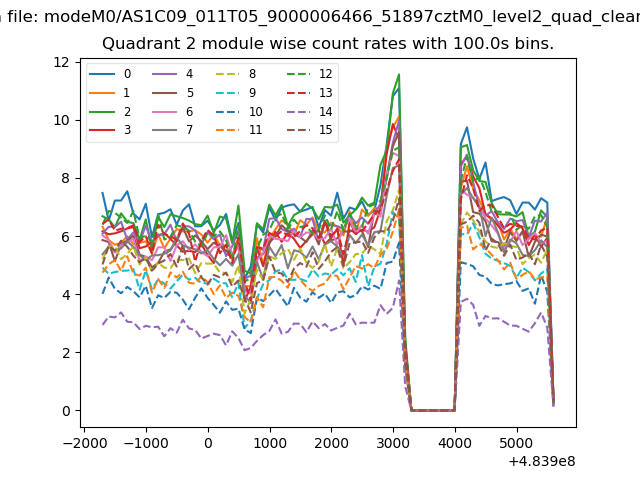 |
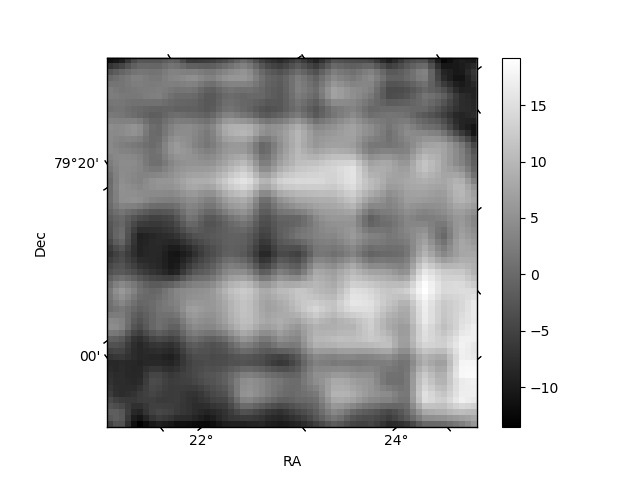 |
| Module-wise count rates for Quadrant D Data is divided into 100 sec bins |
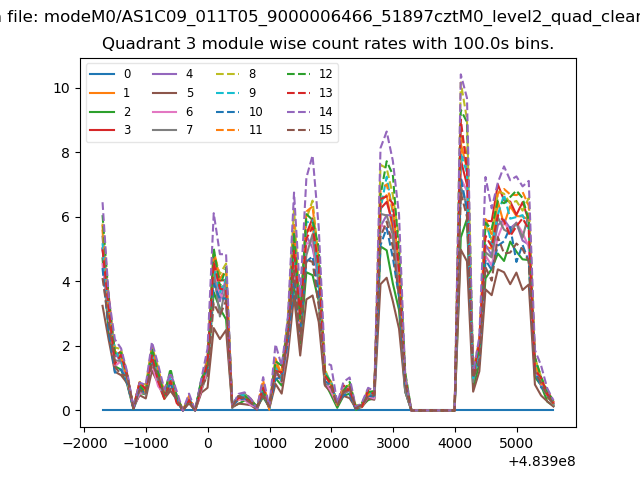 |
 |
| Parameter | Plot |
|---|---|
| CZT HV Monitor | 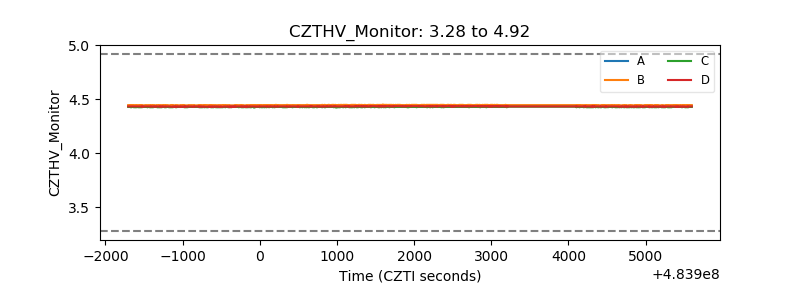 |
| D_VDD | 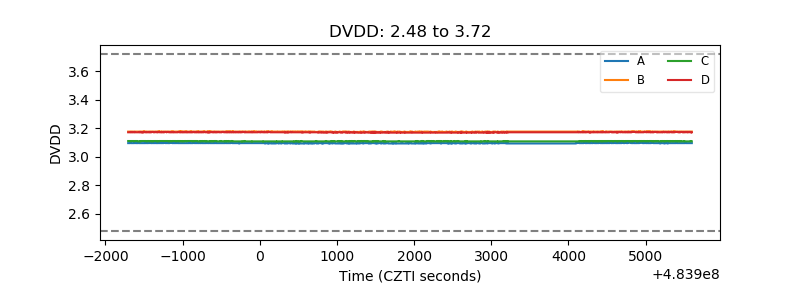 |
| Temperature 1 | 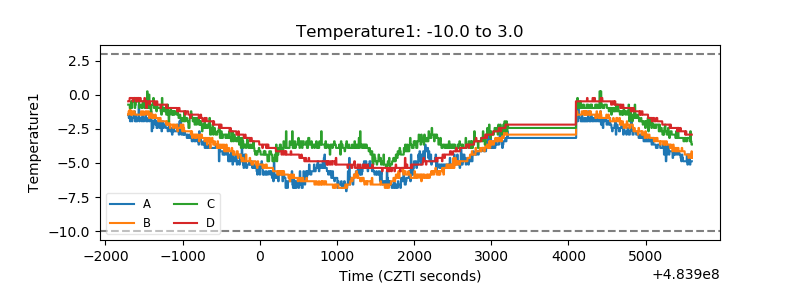 |
| Veto HV Monitor | 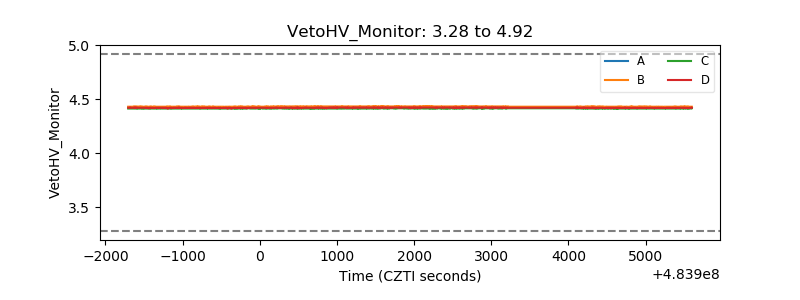 |
| Veto LLD | 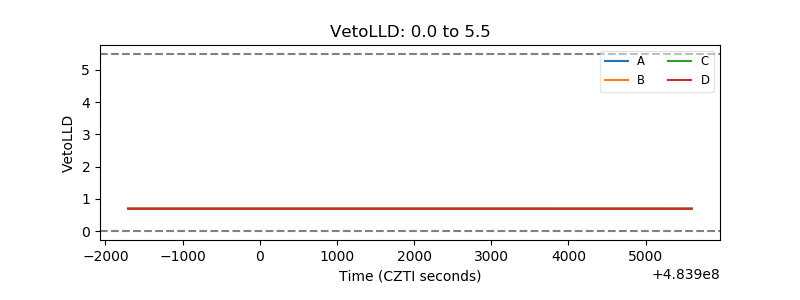 |
| Alpha Counter | 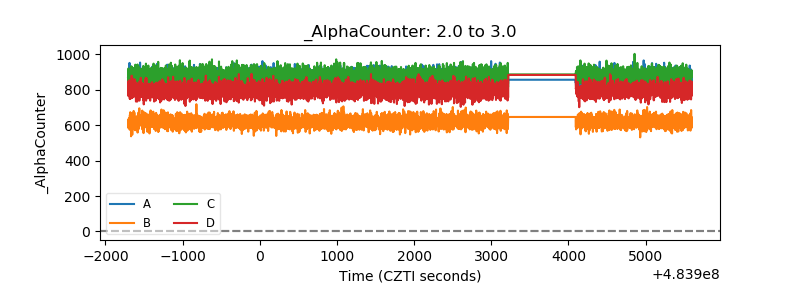 |
| _CPM_Rate | 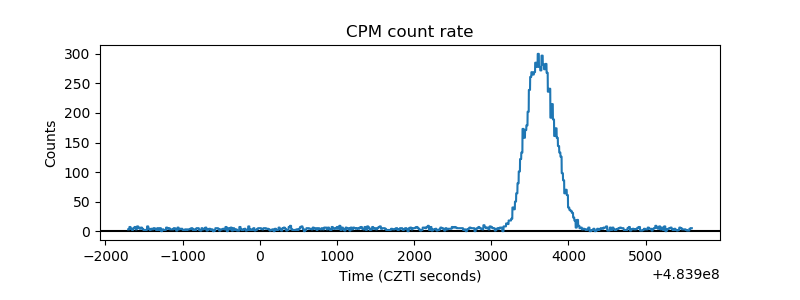 |
| CZT Counter | 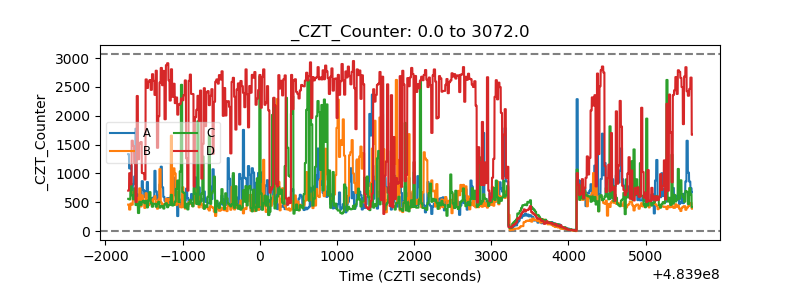 |
| +2.5 Volts monitor | 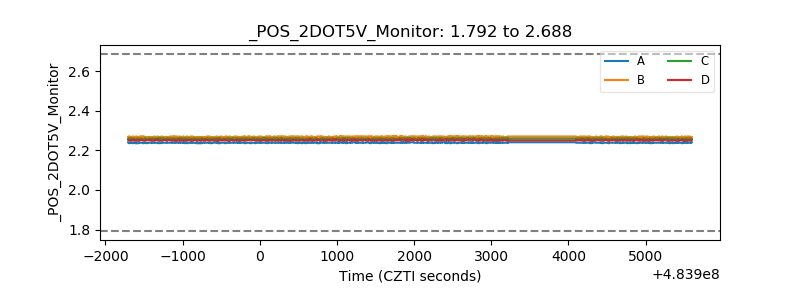 |
| +5 Volts monitor |  |
| _ROLL_ROT | 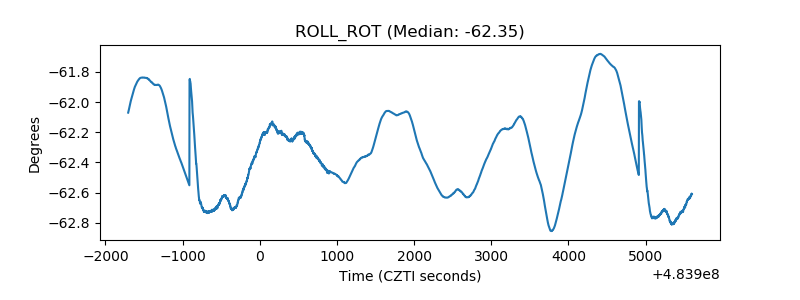 |
| _Roll_DEC | 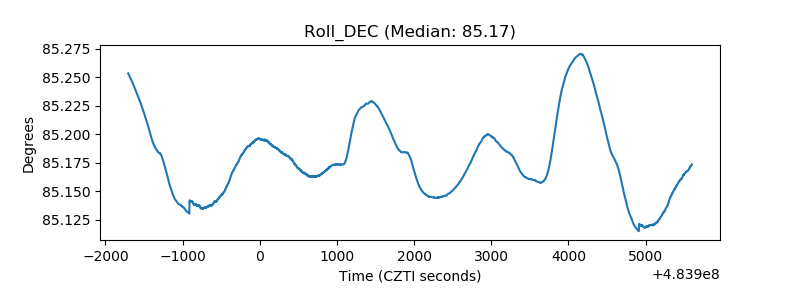 |
| _Roll_RA | 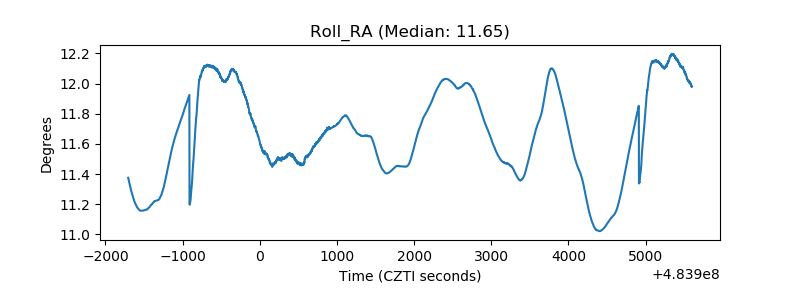 |
| Veto Counter | 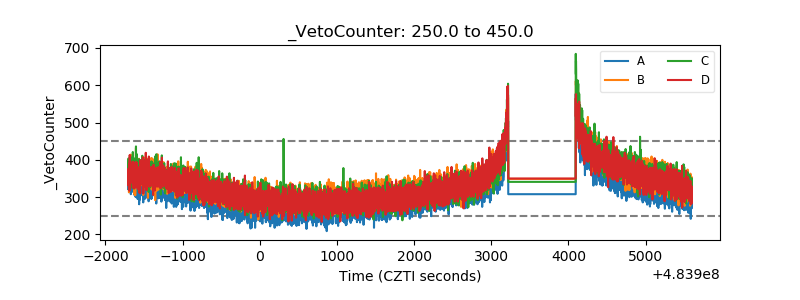 |