| Param | Original file | Final file |
|---|---|---|
| Filename | modeM0/AS1C09_011T05_9000006466_51899cztM0_level2.fits | modeM0/AS1C09_011T05_9000006466_51899cztM0_level2_quad_clean.evt |
| Size (bytes) | 687,467,520 | 89,752,320 |
| Size | 655.6 MB | 85.6 MB |
| Events in quadrant A | 5,714,588 | 605,802 |
| Events in quadrant B | 3,434,834 | 694,808 |
| Events in quadrant C | 4,132,449 | 619,771 |
| Events in quadrant D | 11,646,617 | 329,915 |
| Mode SS | |||
|---|---|---|---|
| Quadrant | BADHDUFLAG | Total packets | Discarded packets |
| A | 0 | 136 | 0 |
| B | 0 | 136 | 0 |
| C | 0 | 136 | 0 |
| D | 0 | 136 | 0 |
| Mode M0 | |||
|---|---|---|---|
| Quadrant | BADHDUFLAG | Total packets | Discarded packets |
| A | 0 | 21723 | 2 |
| B | 0 | 14923 | 2 |
| C | 0 | 16866 | 2 |
| D | 0 | 39277 | 9 |
| Mode M9 | |||
|---|---|---|---|
| Quadrant | BADHDUFLAG | Total packets | Discarded packets |
| A | 0 | 13 | 0 |
| B | 0 | 14 | 0 |
| C | 0 | 14 | 0 |
| D | 0 | 14 | 0 |
| Quadrant | Total seconds | Saturated seconds | Saturation percentage |
|---|---|---|---|
| A | 6699 | 464 | 6.926407% |
| B | 6699 | 81 | 1.209136% |
| C | 6699 | 165 | 2.463054% |
| D | 6698 | 3260 | 48.671245% |
Noise dominated data is calculated using 1-second bins in cleaned event files. If a bin has >2000 counts, and if more than 50% of those come from <1% of pixels, then it is considered to be noise-dominated and hence unusable.
| Quadrant | # 1 sec bins | Bins with >0 counts | Bins with >2000 counts | High rate bins dominated by noise | Noise dominated (total time) | Noise dominated (detector-on time) | Marked lightcurve |
|---|---|---|---|---|---|---|---|
| A | 7709 | 6700 | 355 | 355 | 4.61% | 5.30% |  |
| B | 7709 | 6700 | 19 | 19 | 0.25% | 0.28% |  |
| C | 7709 | 6700 | 89 | 89 | 1.15% | 1.33% | 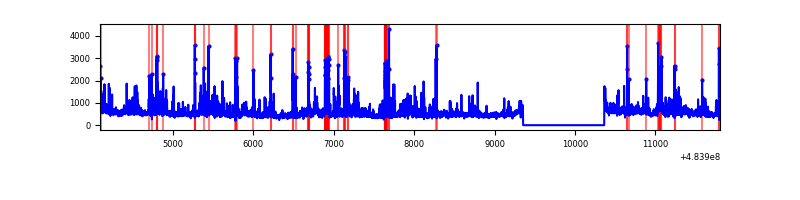 |
| D | 7708 | 6698 | 2870 | 2870 | 37.23% | 42.85% | 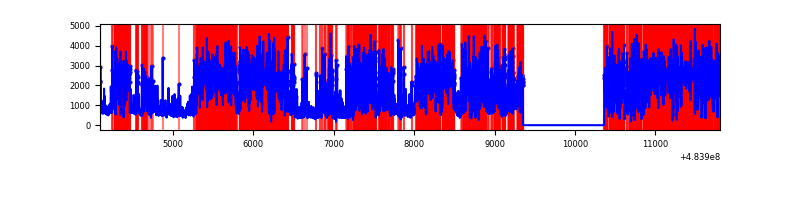 |
Top three noisy pixels from each quadrant. If the there are fewer than three noisy pixels in the level2.evt file, extra rows are filled as -1
| Pixel properties | Quadrant properties | ||||||
|---|---|---|---|---|---|---|---|
| Quadrant | DetID | PixID | Counts | Sigma | Mean | Median | Sigma |
| A | 12 | 3 | 760304 | 4483.72 | 685 | 670 | 169.4 |
| A | 15 | 174 | 582412 | 3433.72 | 685 | 670 | 169.4 |
| A | 4 | 175 | 257892 | 1518.25 | 685 | 670 | 169.4 |
| B | 4 | 171 | 139951 | 917.94 | 711 | 684 | 151.7 |
| B | 0 | 213 | 73992 | 483.19 | 711 | 684 | 151.7 |
| B | 0 | 216 | 62717 | 408.87 | 711 | 684 | 151.7 |
| C | 15 | 248 | 301617 | 1571.19 | 700 | 694 | 191.5 |
| C | 13 | 3 | 216068 | 1124.52 | 700 | 694 | 191.5 |
| C | 15 | 230 | 154331 | 802.18 | 700 | 694 | 191.5 |
| D | 6 | 42 | 6071558 | 39423.84 | 527 | 503 | 154.0 |
| D | 12 | 17 | 1723896 | 11191.26 | 527 | 503 | 154.0 |
| D | 3 | 12 | 850047 | 5516.72 | 527 | 503 | 154.0 |
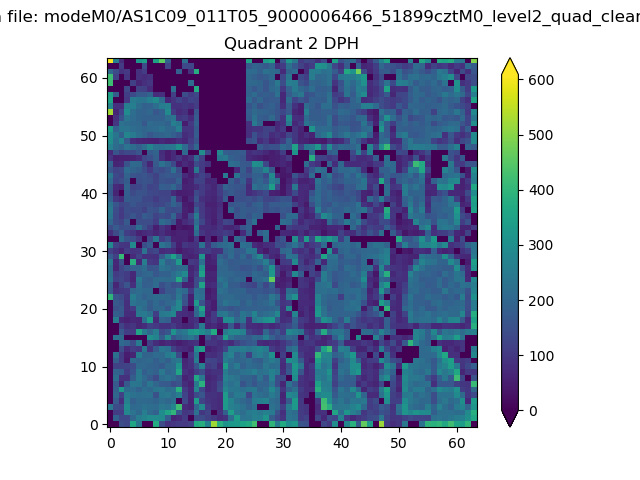
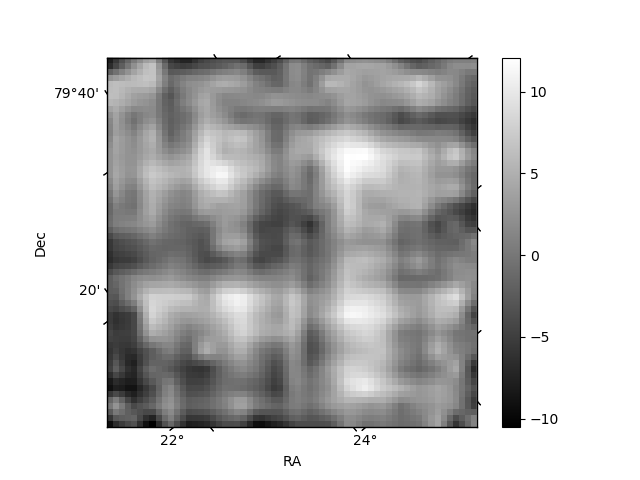
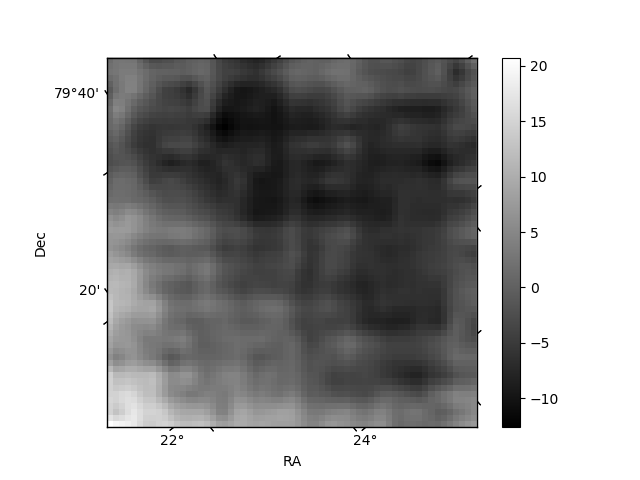
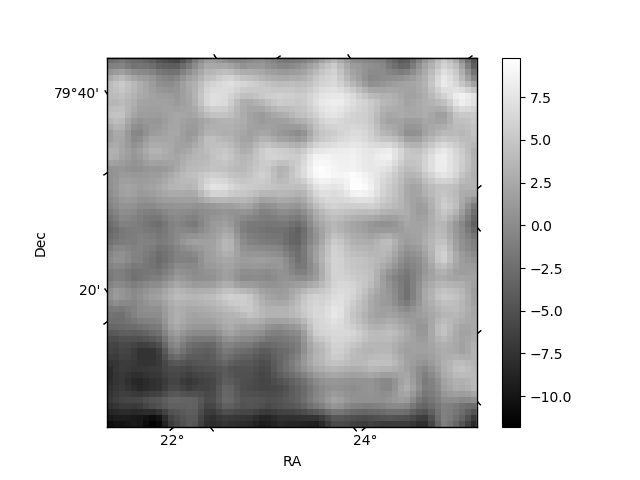
Histogram calculated using DETX and DETY for each event in the final _common_clean file
| Quadrant A | 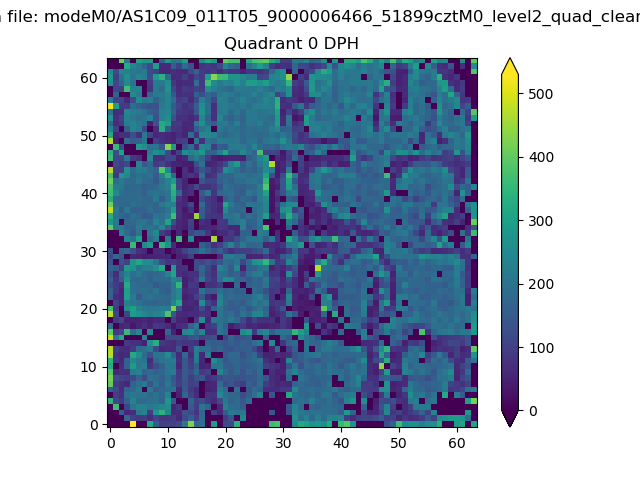 |
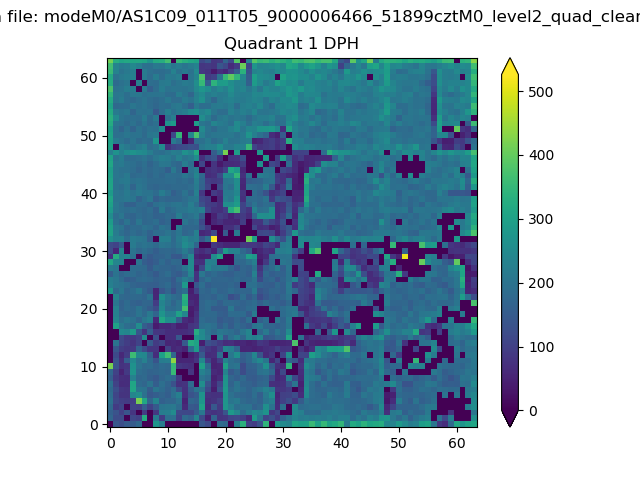 |
Quadrant B |
|---|---|---|---|
| Quadrant D | 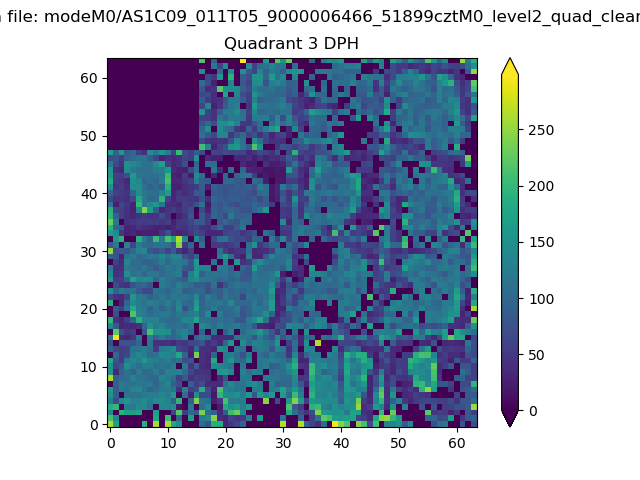 |
 |
Quadrant C |
| Plot type | Count rate plots | Images |
|---|---|---|
| Comparison with Poisson distribution Blue bars denote a histogram of data divided into 1 sec bins. Red curve is a Poisson curve with rate = median count rate of data. |
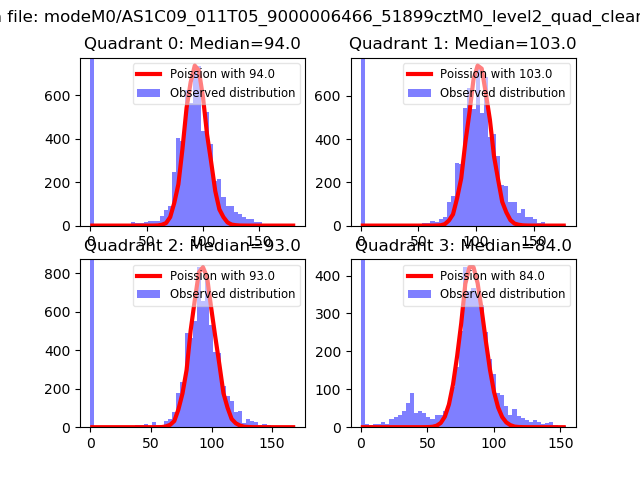 |
 |
| Quadrant-wise count rates Data is divided into 100 sec bins |
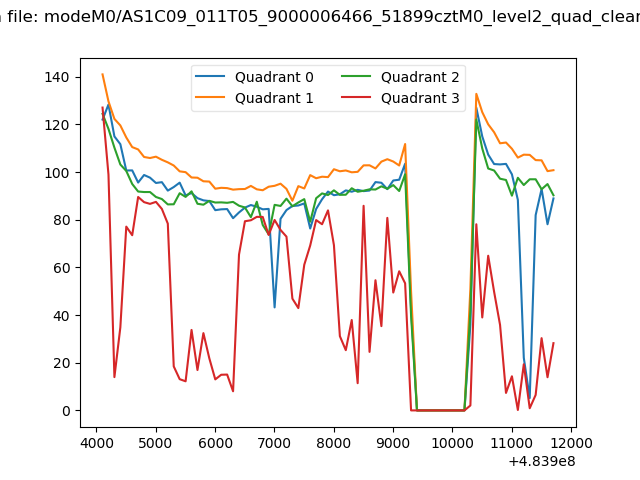 |
|
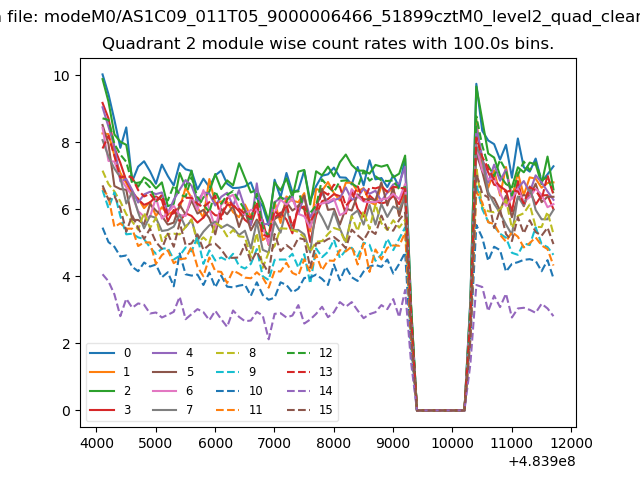
| Module-wise count rates for Quadrant A Data is divided into 100 sec bins |
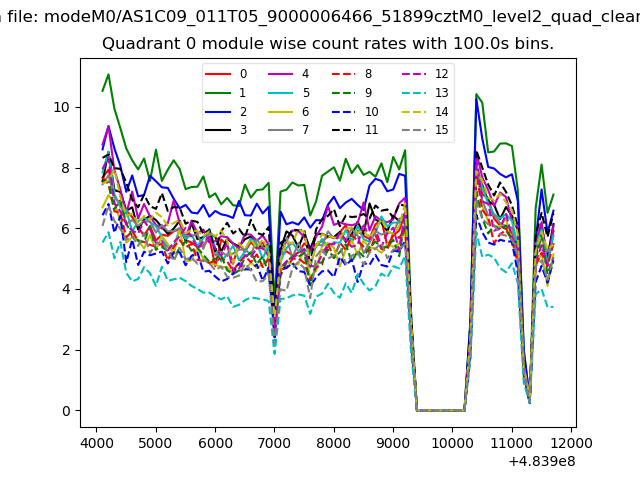 |
 |
| Module-wise count rates for Quadrant B Data is divided into 100 sec bins |
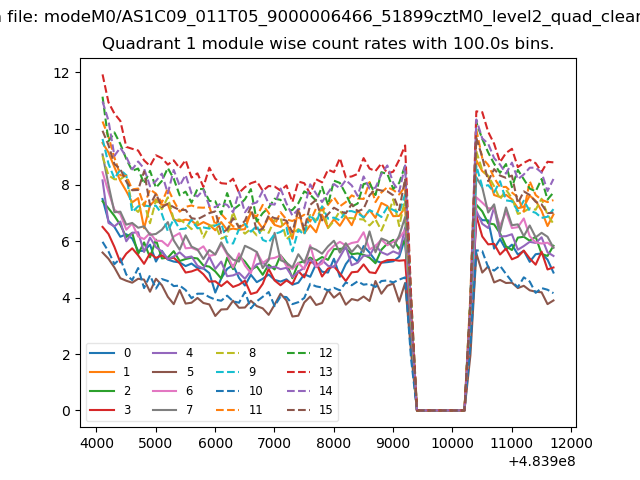 |
 |
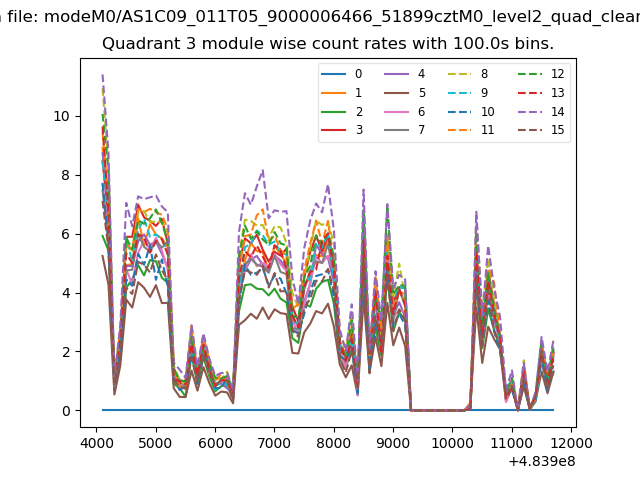
| Module-wise count rates for Quadrant C Data is divided into 100 sec bins |
 |
 |
| Module-wise count rates for Quadrant D Data is divided into 100 sec bins |
 |
 |
| Parameter | Plot |
|---|---|
| CZT HV Monitor | 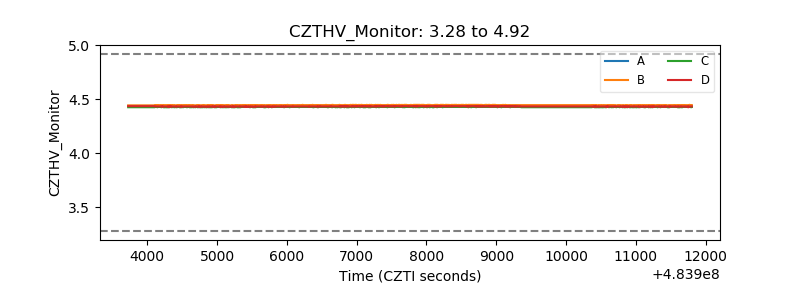 |
| D_VDD | 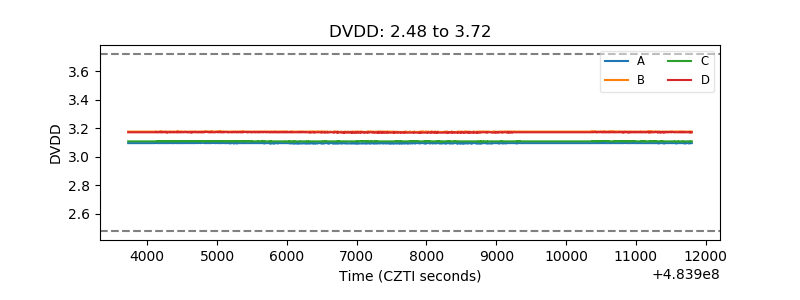 |
| Temperature 1 | 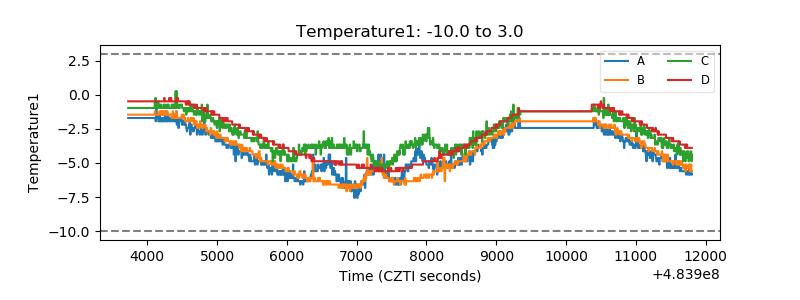 |
| Veto HV Monitor | 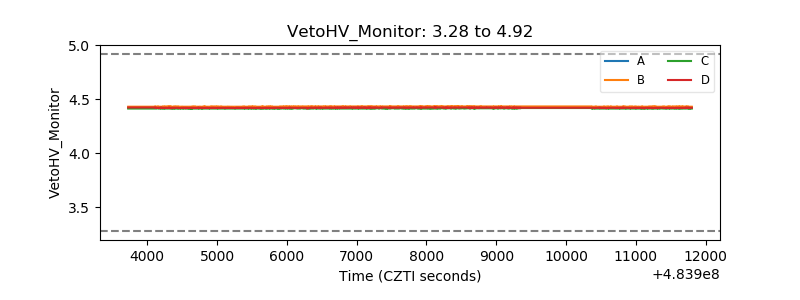 |
| Veto LLD | 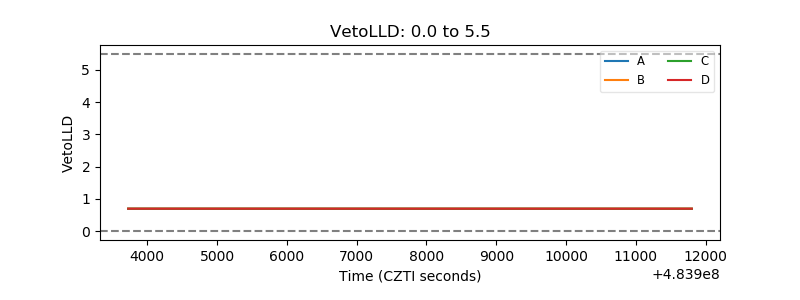 |
| Alpha Counter | 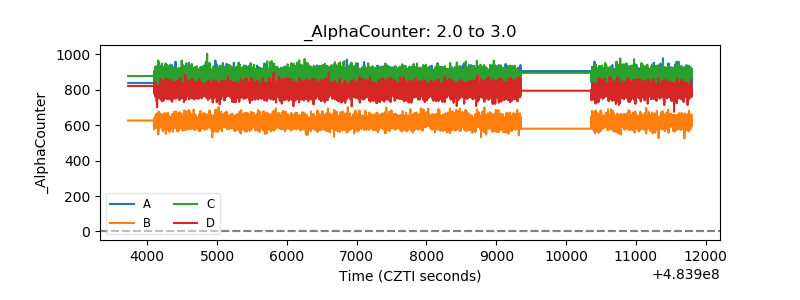 |
| _CPM_Rate | 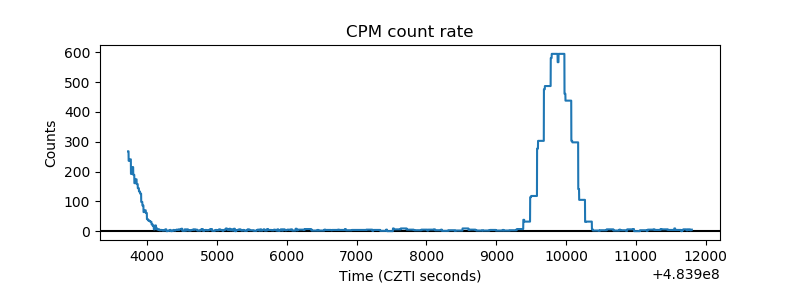 |
| CZT Counter | 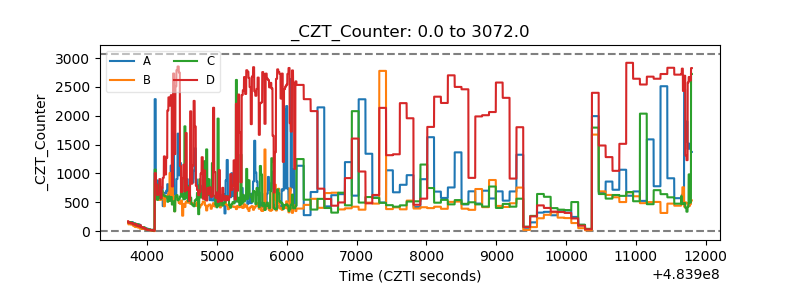 |
| +2.5 Volts monitor | 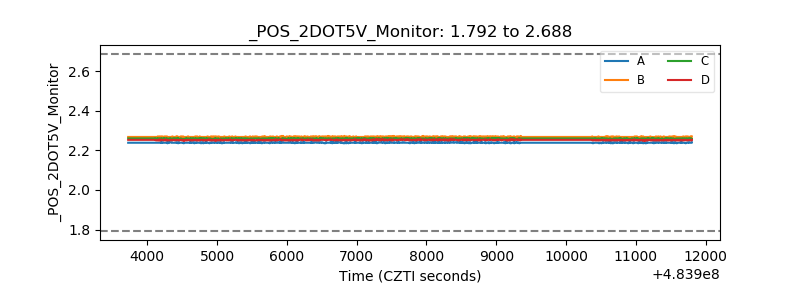 |
| +5 Volts monitor |  |
| _ROLL_ROT | 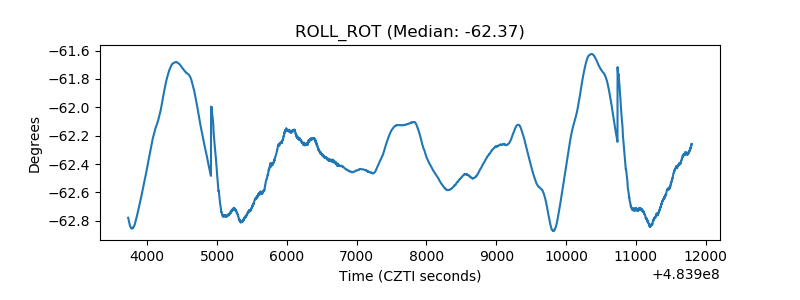 |
| _Roll_DEC | 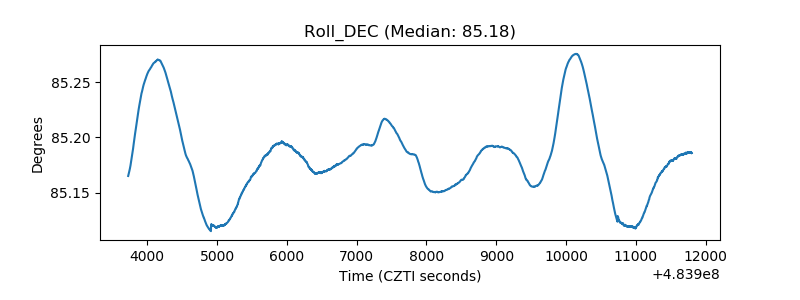 |
| _Roll_RA | 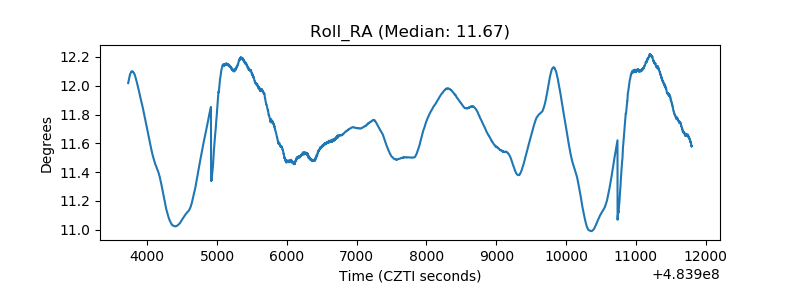 |
| Veto Counter | 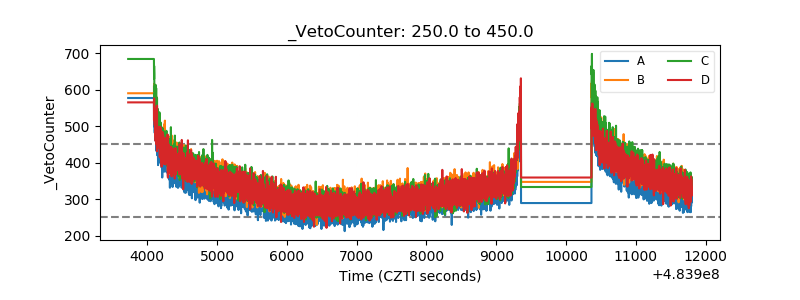 |