| Param | Original file | Final file |
|---|---|---|
| Filename | modeM0/AS1C09_011T05_9000006466_51900cztM0_level2.fits | modeM0/AS1C09_011T05_9000006466_51900cztM0_level2_quad_clean.evt |
| Size (bytes) | 735,799,680 | 86,365,440 |
| Size | 701.7 MB | 82.4 MB |
| Events in quadrant A | 5,365,829 | 592,510 |
| Events in quadrant B | 3,850,124 | 679,087 |
| Events in quadrant C | 4,849,633 | 595,834 |
| Events in quadrant D | 12,665,807 | 292,067 |
| Mode SS | |||
|---|---|---|---|
| Quadrant | BADHDUFLAG | Total packets | Discarded packets |
| A | 0 | 132 | 0 |
| B | 0 | 132 | 0 |
| C | 0 | 132 | 0 |
| D | 0 | 132 | 0 |
| Mode M0 | |||
|---|---|---|---|
| Quadrant | BADHDUFLAG | Total packets | Discarded packets |
| A | 0 | 20574 | 2 |
| B | 0 | 15978 | 8 |
| C | 0 | 18880 | 2 |
| D | 0 | 42145 | 2 |
| Mode M9 | |||
|---|---|---|---|
| Quadrant | BADHDUFLAG | Total packets | Discarded packets |
| A | 0 | 11 | 0 |
| B | 0 | 11 | 0 |
| C | 0 | 11 | 0 |
| D | 0 | 11 | 0 |
| Quadrant | Total seconds | Saturated seconds | Saturation percentage |
|---|---|---|---|
| A | 6528 | 456 | 6.985294% |
| B | 6528 | 127 | 1.945466% |
| C | 6528 | 341 | 5.223652% |
| D | 6528 | 3582 | 54.871324% |
Noise dominated data is calculated using 1-second bins in cleaned event files. If a bin has >2000 counts, and if more than 50% of those come from <1% of pixels, then it is considered to be noise-dominated and hence unusable.
| Quadrant | # 1 sec bins | Bins with >0 counts | Bins with >2000 counts | High rate bins dominated by noise | Noise dominated (total time) | Noise dominated (detector-on time) | Marked lightcurve |
|---|---|---|---|---|---|---|---|
| A | 7653 | 6529 | 374 | 374 | 4.89% | 5.73% | 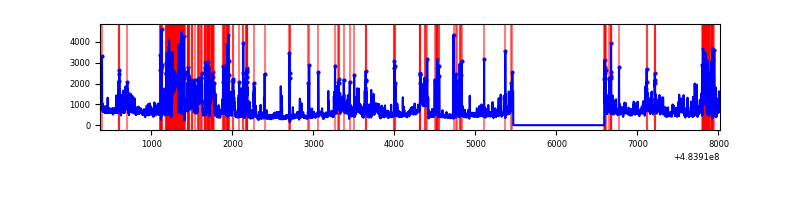 |
| B | 7653 | 6529 | 57 | 57 | 0.74% | 0.87% |  |
| C | 7653 | 6529 | 242 | 242 | 3.16% | 3.71% | 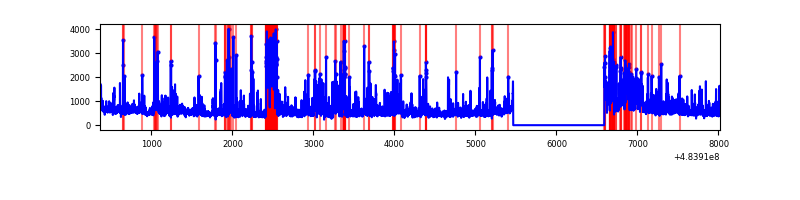 |
| D | 7653 | 6529 | 3359 | 3359 | 43.89% | 51.45% | 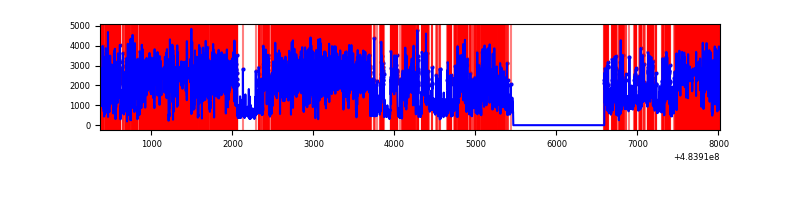 |
Top three noisy pixels from each quadrant. If the there are fewer than three noisy pixels in the level2.evt file, extra rows are filled as -1
| Pixel properties | Quadrant properties | ||||||
|---|---|---|---|---|---|---|---|
| Quadrant | DetID | PixID | Counts | Sigma | Mean | Median | Sigma |
| A | 15 | 174 | 1206206 | 7408.28 | 660 | 644 | 162.7 |
| A | 12 | 3 | 543259 | 3334.42 | 660 | 644 | 162.7 |
| A | 4 | 3 | 173983 | 1065.18 | 660 | 644 | 162.7 |
| B | 4 | 171 | 357099 | 2447.16 | 686 | 663 | 145.7 |
| B | 10 | 254 | 184305 | 1260.82 | 686 | 663 | 145.7 |
| B | 5 | 172 | 86003 | 585.91 | 686 | 663 | 145.7 |
| C | 14 | 245 | 657562 | 3525.14 | 670 | 663 | 186.3 |
| C | 10 | 171 | 389051 | 2084.22 | 670 | 663 | 186.3 |
| C | 15 | 248 | 264336 | 1414.96 | 670 | 663 | 186.3 |
| D | 6 | 42 | 8121824 | 50600.31 | 501 | 481 | 160.5 |
| D | 12 | 17 | 1008610 | 6281.18 | 501 | 481 | 160.5 |
| D | 3 | 12 | 466497 | 2903.53 | 501 | 481 | 160.5 |
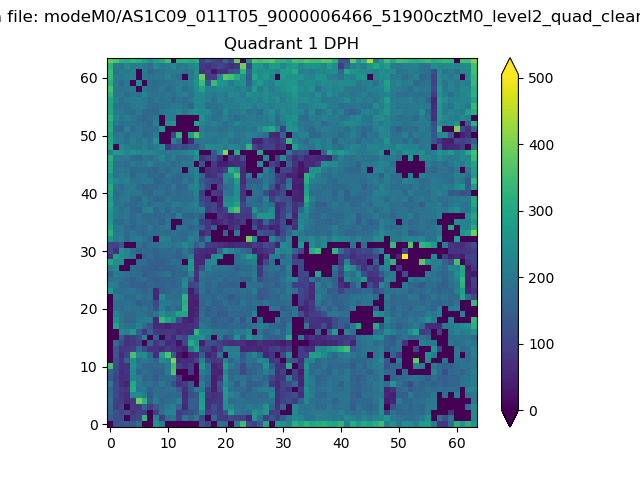
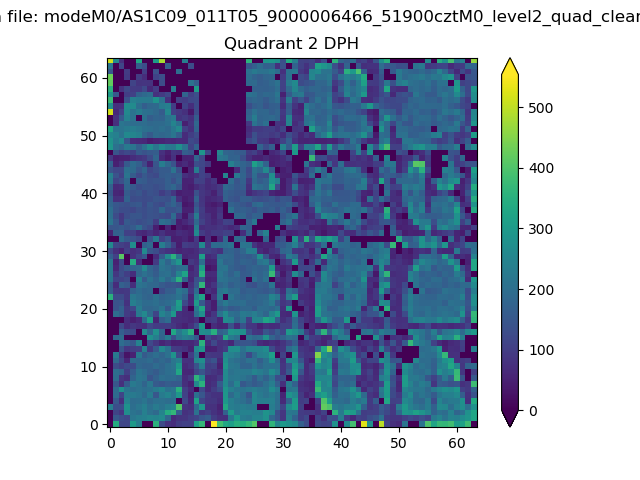
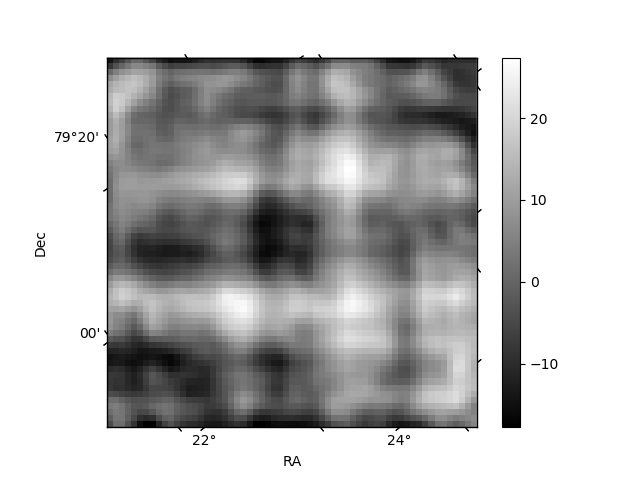
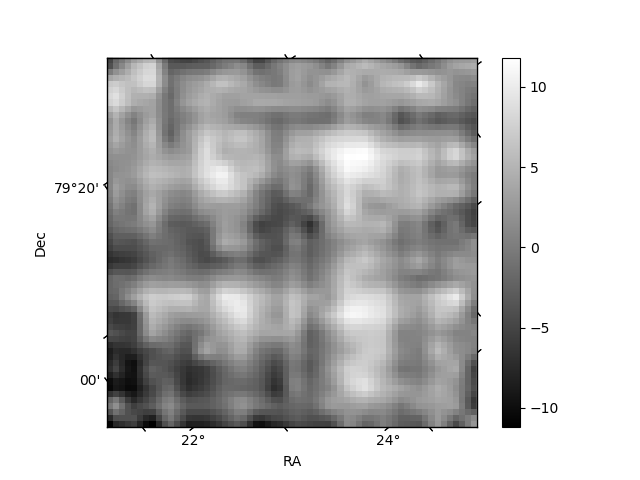
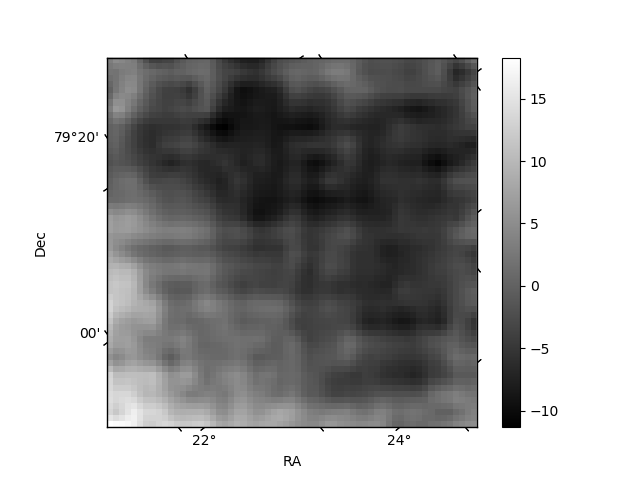
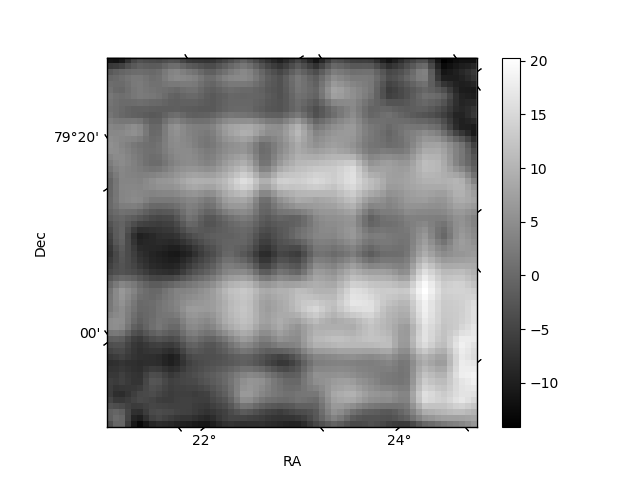
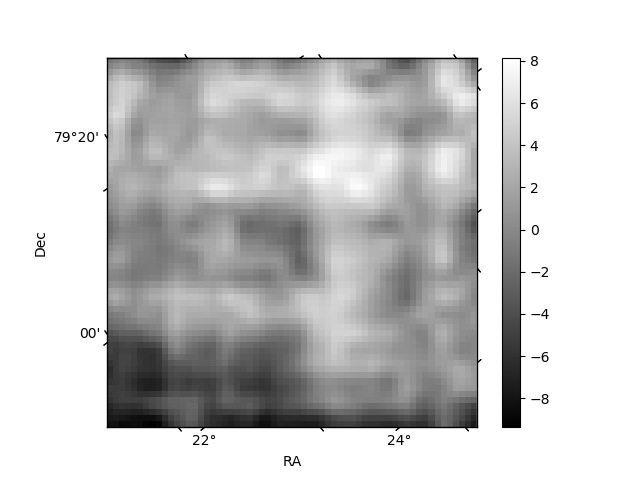
Histogram calculated using DETX and DETY for each event in the final _common_clean file
| Quadrant A | 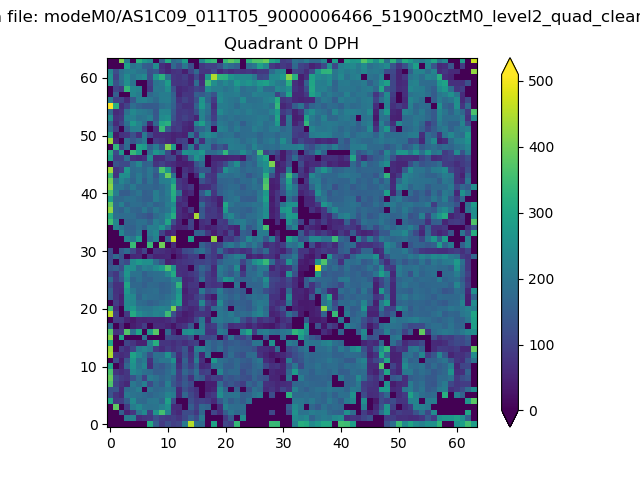 |
 |
Quadrant B |
|---|---|---|---|
| Quadrant D | 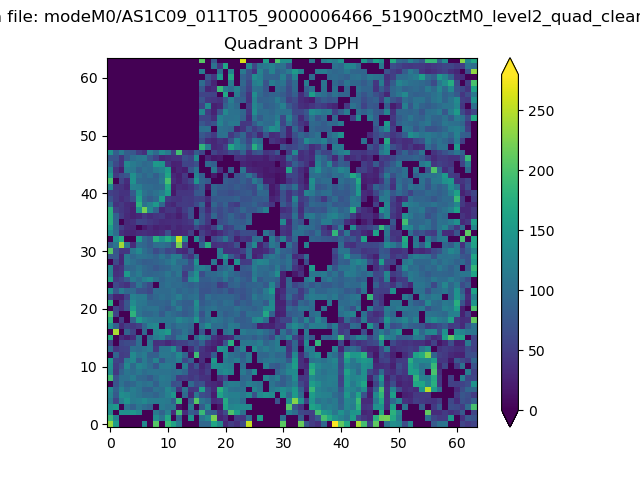 |
 |
Quadrant C |
| Plot type | Count rate plots | Images |
|---|---|---|
| Comparison with Poisson distribution Blue bars denote a histogram of data divided into 1 sec bins. Red curve is a Poisson curve with rate = median count rate of data. |
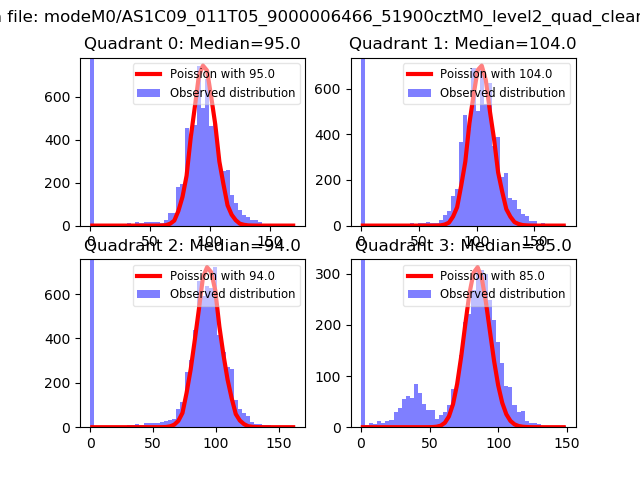 |
 |
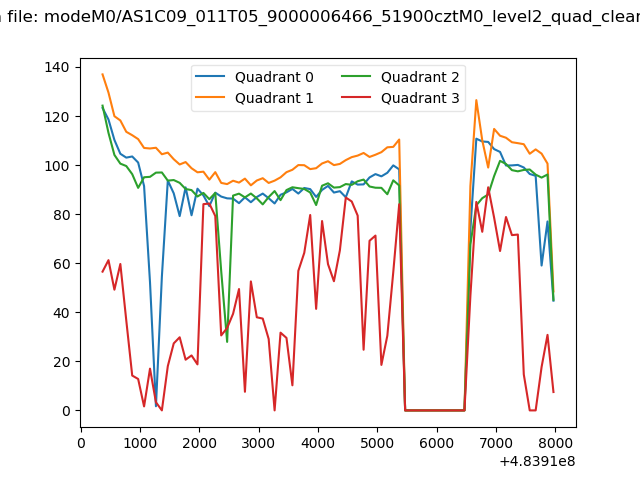
| Quadrant-wise count rates Data is divided into 100 sec bins |
 |
|
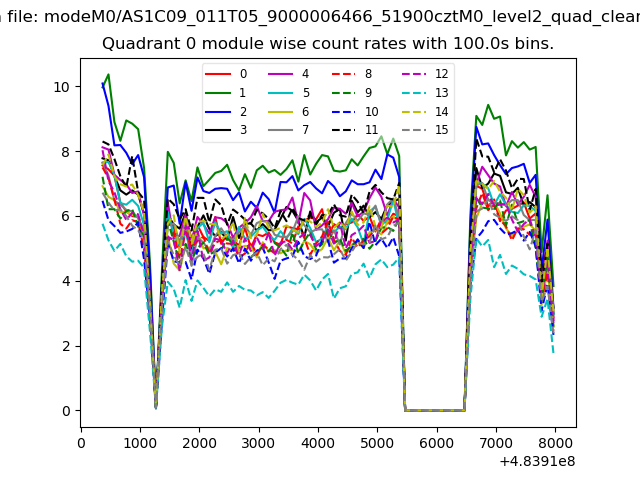
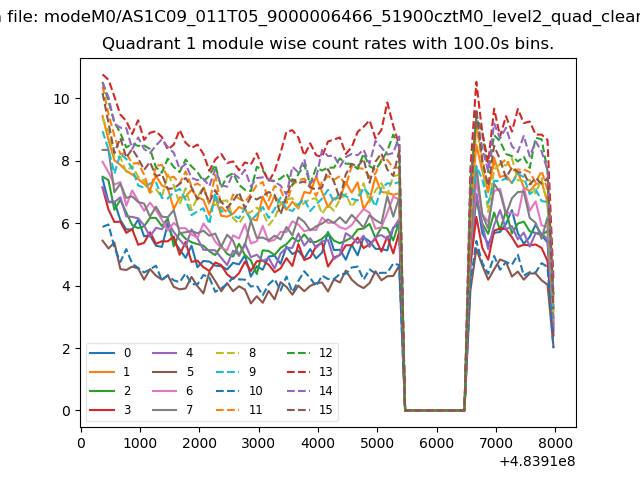
| Module-wise count rates for Quadrant A Data is divided into 100 sec bins |
 |
 |
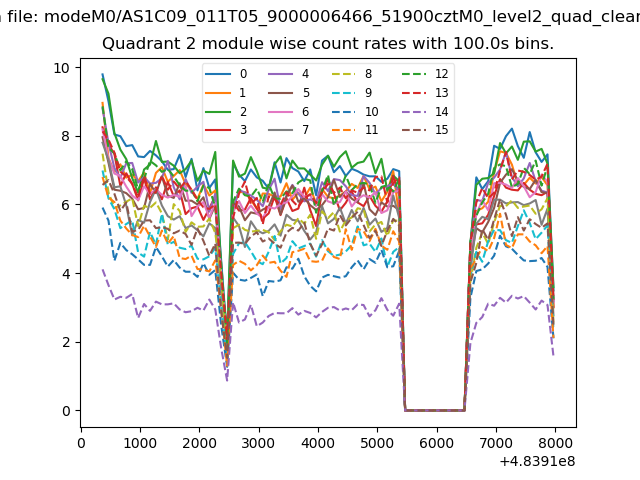
| Module-wise count rates for Quadrant B Data is divided into 100 sec bins |
 |
 |
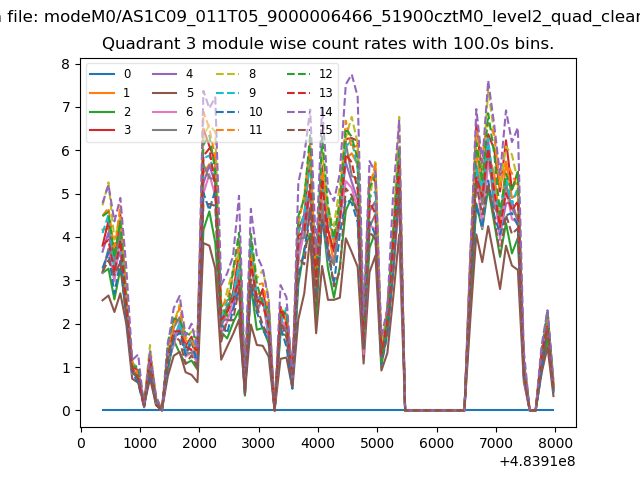
| Module-wise count rates for Quadrant C Data is divided into 100 sec bins |
 |
 |
| Module-wise count rates for Quadrant D Data is divided into 100 sec bins |
 |
 |
| Parameter | Plot |
|---|---|
| CZT HV Monitor |  |
| D_VDD | 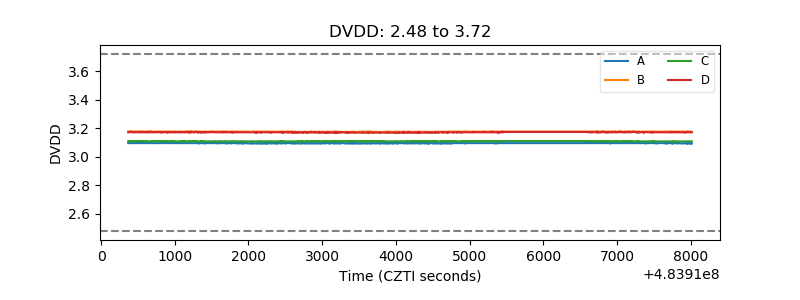 |
| Temperature 1 | 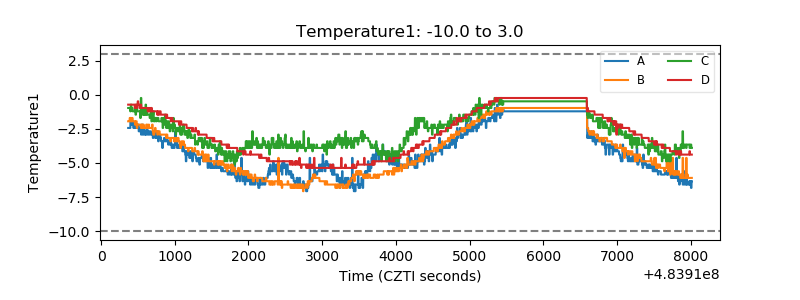 |
| Veto HV Monitor | 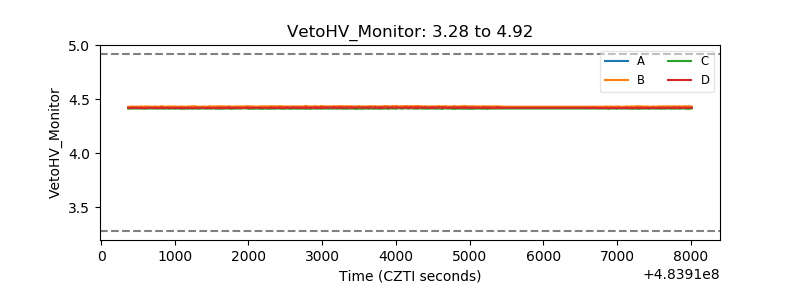 |
| Veto LLD | 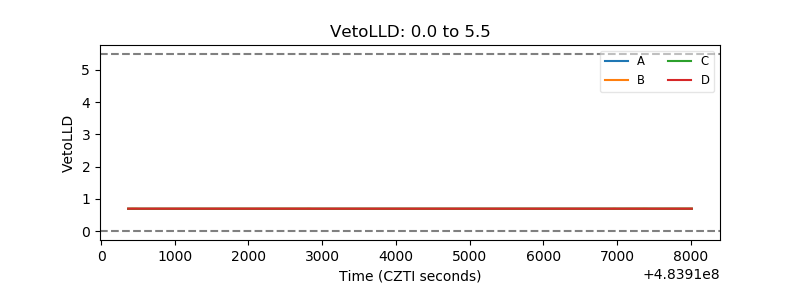 |
| Alpha Counter | 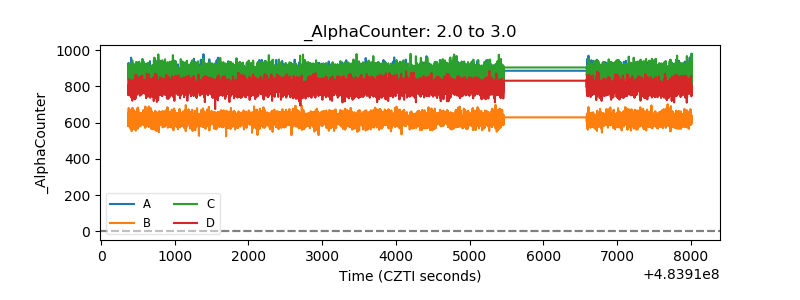 |
| _CPM_Rate | 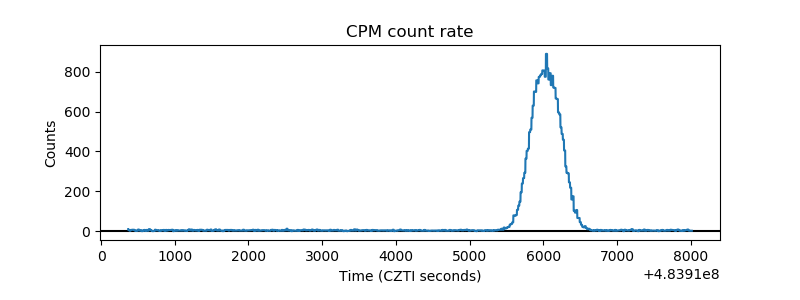 |
| CZT Counter | 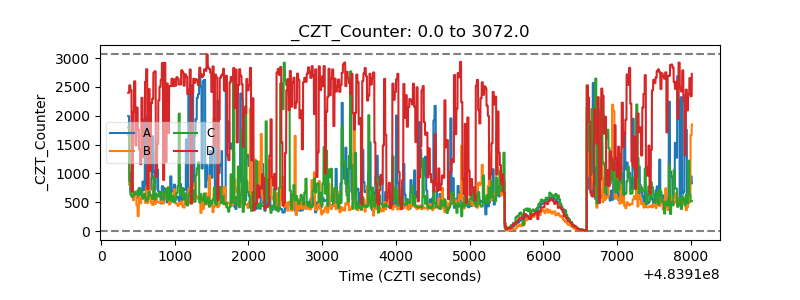 |
| +2.5 Volts monitor | 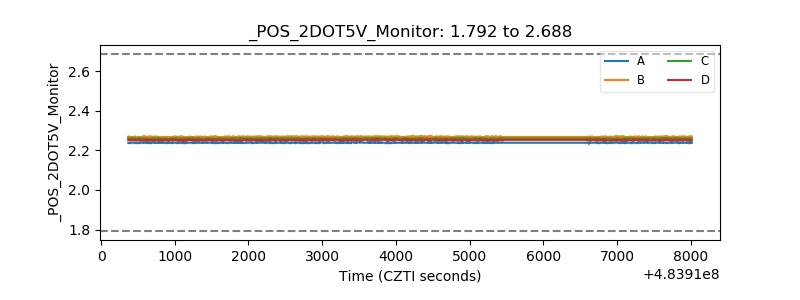 |
| +5 Volts monitor |  |
| _ROLL_ROT | 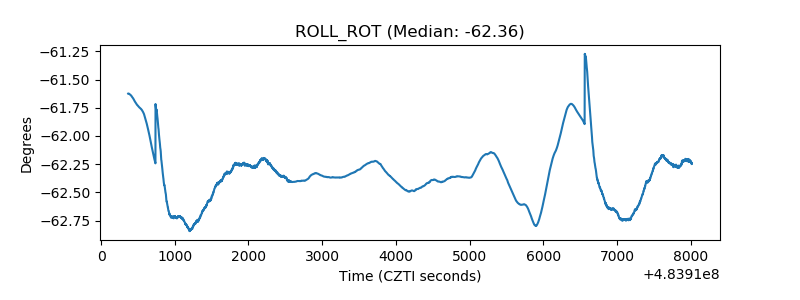 |
| _Roll_DEC | 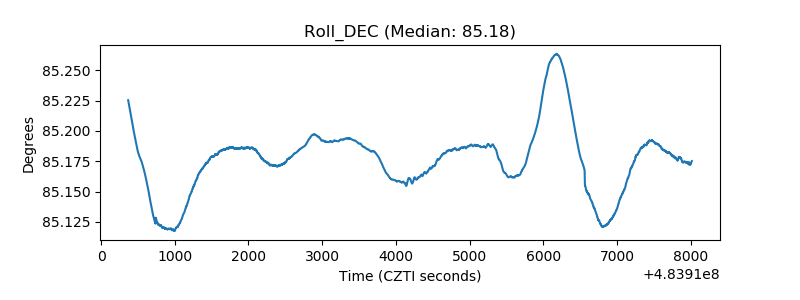 |
| _Roll_RA | 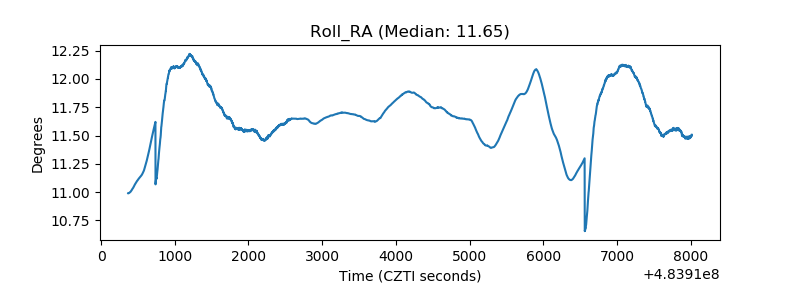 |
| Veto Counter | 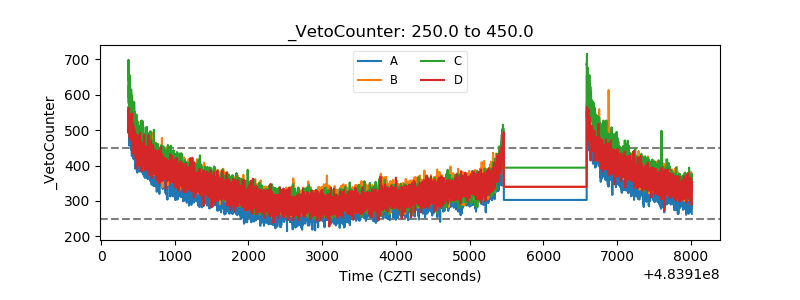 |