| Param | Original file | Final file |
|---|---|---|
| Filename | modeM0/AS1C09_011T05_9000006466_51901cztM0_level2.fits | modeM0/AS1C09_011T05_9000006466_51901cztM0_level2_quad_clean.evt |
| Size (bytes) | 671,728,320 | 89,285,760 |
| Size | 640.6 MB | 85.1 MB |
| Events in quadrant A | 5,002,875 | 598,069 |
| Events in quadrant B | 4,421,167 | 665,654 |
| Events in quadrant C | 4,699,786 | 596,467 |
| Events in quadrant D | 10,238,452 | 390,124 |
| Mode SS | |||
|---|---|---|---|
| Quadrant | BADHDUFLAG | Total packets | Discarded packets |
| A | 0 | 132 | 0 |
| B | 0 | 132 | 0 |
| C | 0 | 132 | 0 |
| D | 0 | 132 | 0 |
| Mode M0 | |||
|---|---|---|---|
| Quadrant | BADHDUFLAG | Total packets | Discarded packets |
| A | 0 | 19423 | 2 |
| B | 0 | 17631 | 3 |
| C | 0 | 18513 | 2 |
| D | 0 | 34931 | 2 |
| Mode M9 | |||
|---|---|---|---|
| Quadrant | BADHDUFLAG | Total packets | Discarded packets |
| A | 0 | 19 | 0 |
| B | 0 | 20 | 0 |
| C | 0 | 20 | 0 |
| D | 0 | 20 | 0 |
| Quadrant | Total seconds | Saturated seconds | Saturation percentage |
|---|---|---|---|
| A | 6494 | 392 | 6.036341% |
| B | 6493 | 302 | 4.651163% |
| C | 6493 | 324 | 4.989989% |
| D | 6493 | 2383 | 36.701063% |
Noise dominated data is calculated using 1-second bins in cleaned event files. If a bin has >2000 counts, and if more than 50% of those come from <1% of pixels, then it is considered to be noise-dominated and hence unusable.
| Quadrant | # 1 sec bins | Bins with >0 counts | Bins with >2000 counts | High rate bins dominated by noise | Noise dominated (total time) | Noise dominated (detector-on time) | Marked lightcurve |
|---|---|---|---|---|---|---|---|
| A | 7629 | 6495 | 292 | 292 | 3.83% | 4.50% | 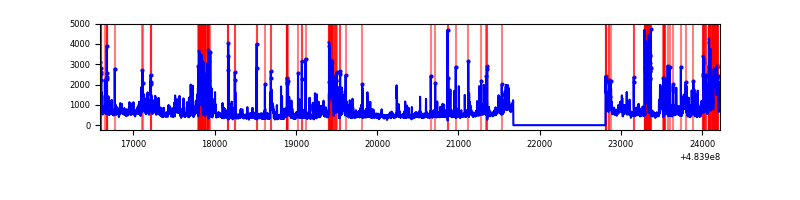 |
| B | 7628 | 6494 | 159 | 159 | 2.08% | 2.45% | 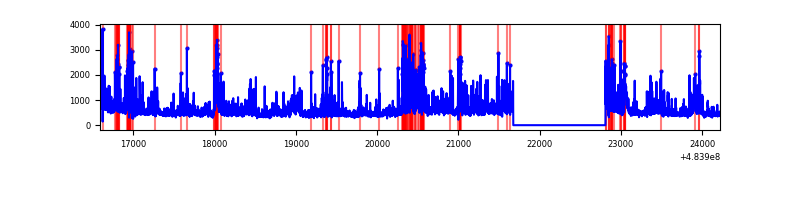 |
| C | 7628 | 6494 | 190 | 190 | 2.49% | 2.93% | 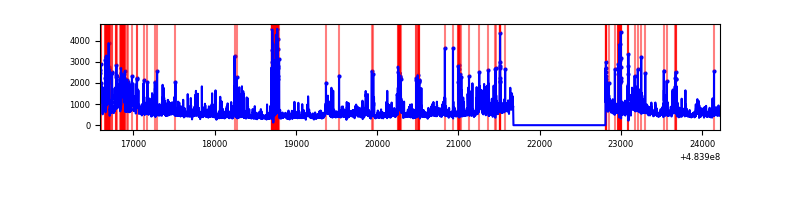 |
| D | 7628 | 6493 | 2211 | 2211 | 28.99% | 34.05% | 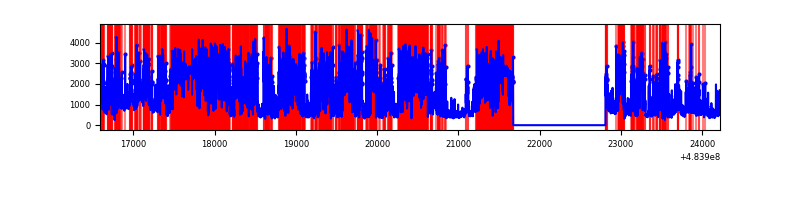 |
Top three noisy pixels from each quadrant. If the there are fewer than three noisy pixels in the level2.evt file, extra rows are filled as -1
| Pixel properties | Quadrant properties | ||||||
|---|---|---|---|---|---|---|---|
| Quadrant | DetID | PixID | Counts | Sigma | Mean | Median | Sigma |
| A | 12 | 3 | 471991 | 2829.35 | 669 | 655 | 166.6 |
| A | 4 | 175 | 302883 | 1814.22 | 669 | 655 | 166.6 |
| A | 15 | 174 | 270660 | 1620.79 | 669 | 655 | 166.6 |
| B | 5 | 185 | 442411 | 3080.07 | 680 | 658 | 143.4 |
| B | 4 | 171 | 354827 | 2469.4 | 680 | 658 | 143.4 |
| B | 7 | 252 | 159041 | 1104.31 | 680 | 658 | 143.4 |
| C | 15 | 248 | 408551 | 2205.38 | 665 | 658 | 185.0 |
| C | 10 | 171 | 198350 | 1068.87 | 665 | 658 | 185.0 |
| C | 15 | 224 | 188716 | 1016.78 | 665 | 658 | 185.0 |
| D | 6 | 42 | 4343049 | 26014.83 | 547 | 526 | 166.9 |
| D | 0 | 5 | 1127742 | 6752.83 | 547 | 526 | 166.9 |
| D | 3 | 12 | 995734 | 5962.01 | 547 | 526 | 166.9 |
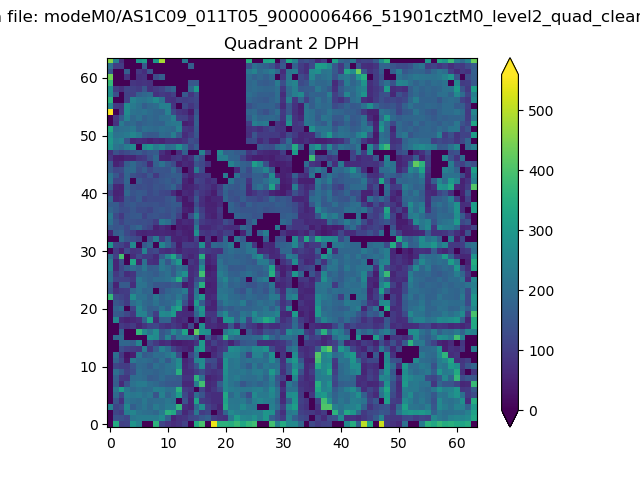
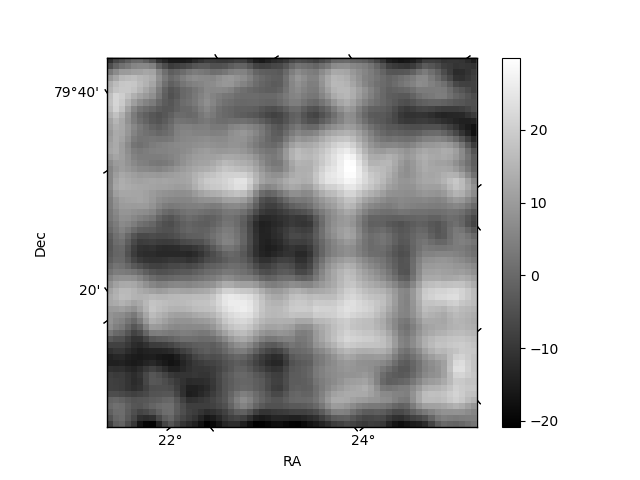
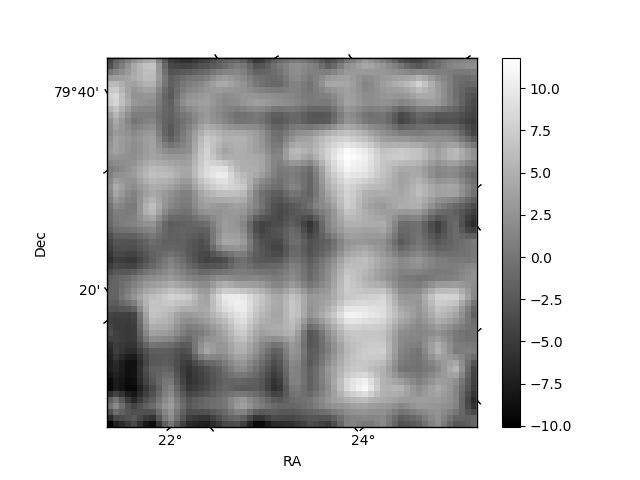
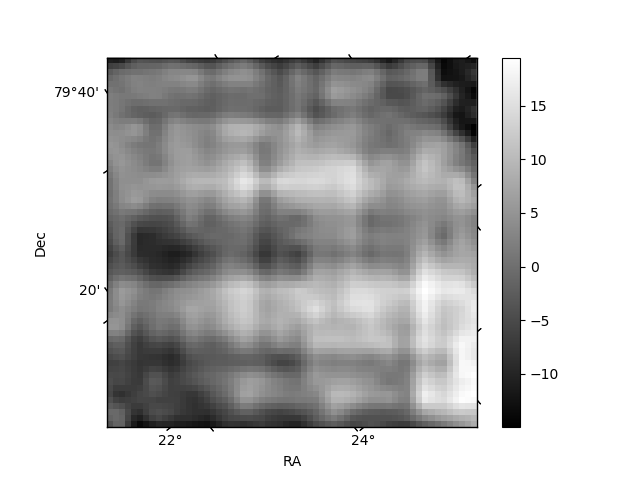
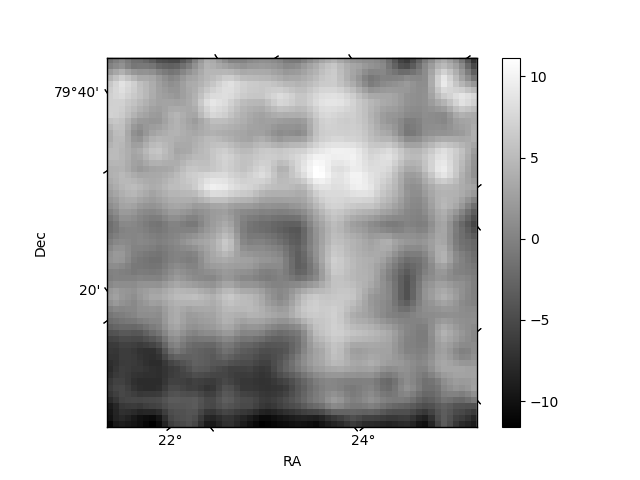
Histogram calculated using DETX and DETY for each event in the final _common_clean file
| Quadrant A | 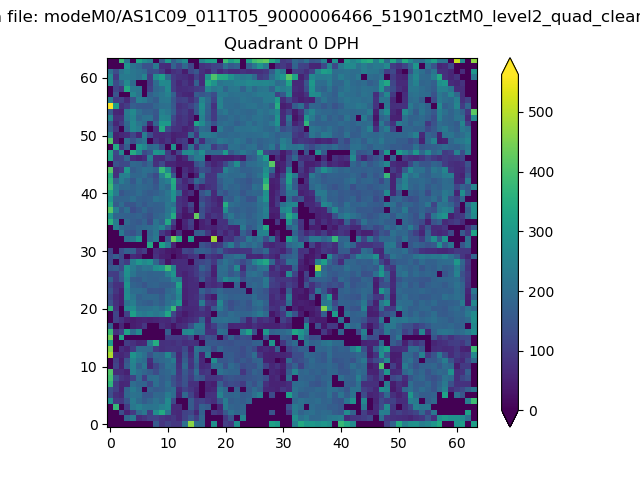 |
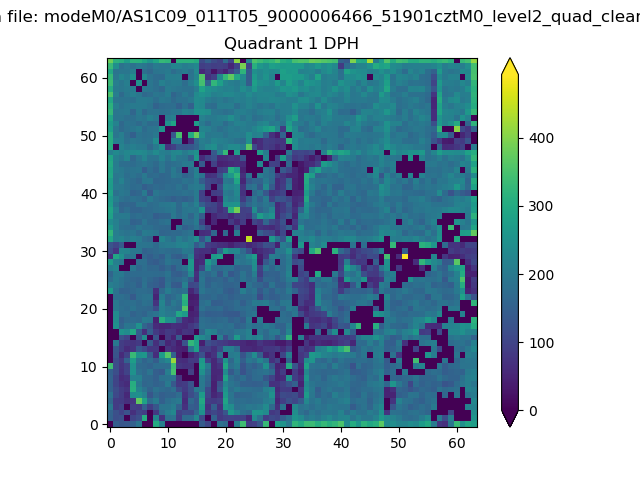 |
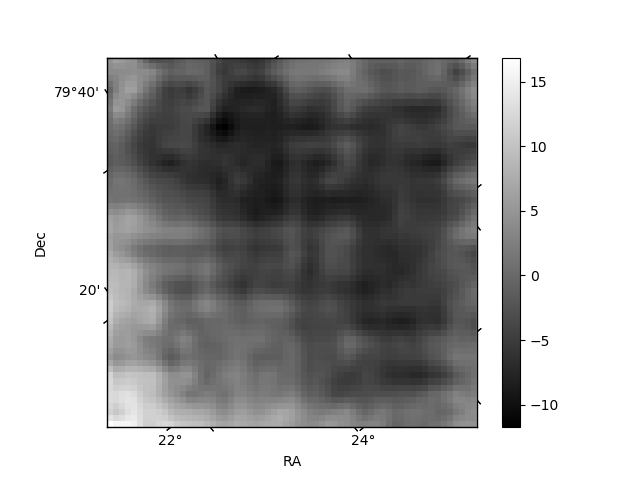
Quadrant B |
|---|---|---|---|
| Quadrant D | 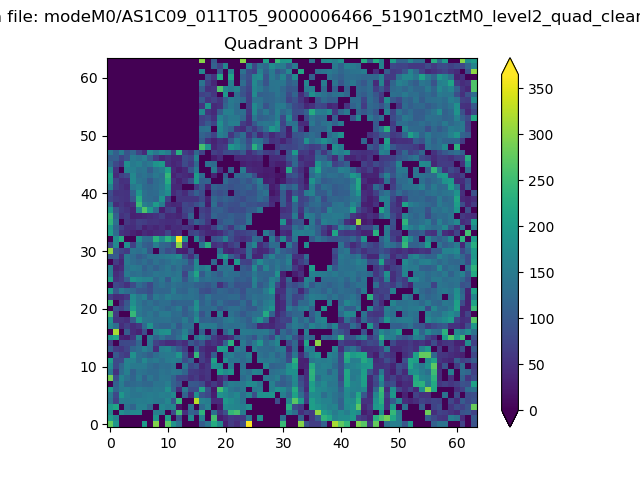 |
 |
Quadrant C |
| Plot type | Count rate plots | Images |
|---|---|---|
| Comparison with Poisson distribution Blue bars denote a histogram of data divided into 1 sec bins. Red curve is a Poisson curve with rate = median count rate of data. |
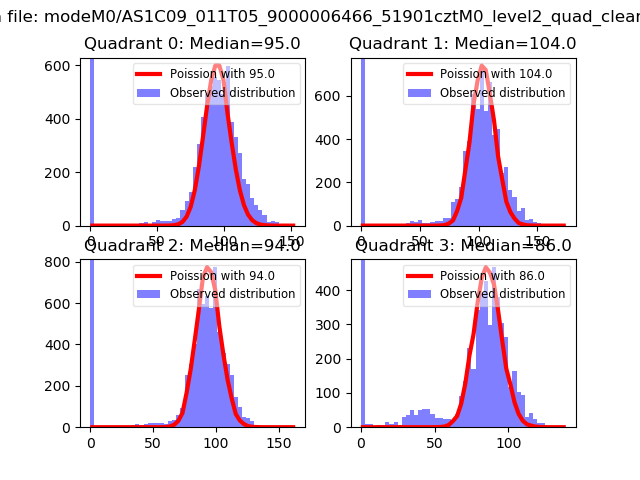 |
 |
| Quadrant-wise count rates Data is divided into 100 sec bins |
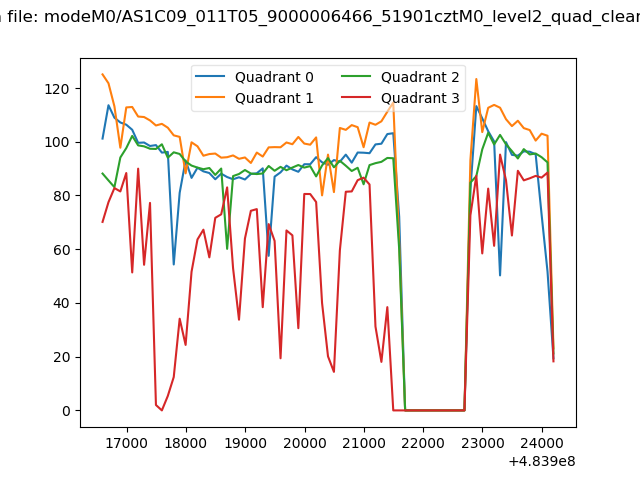 |
|
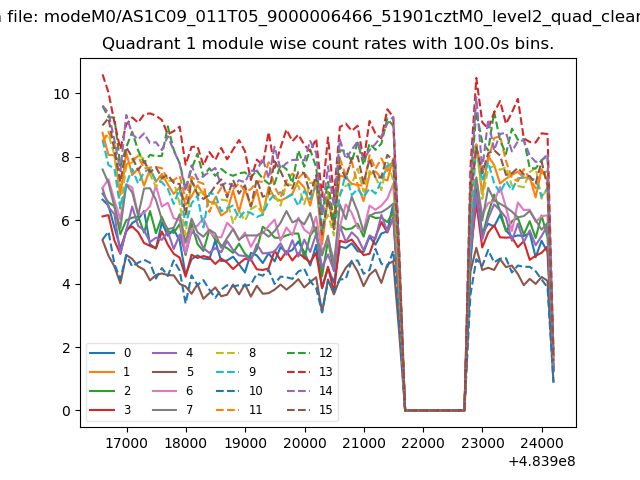
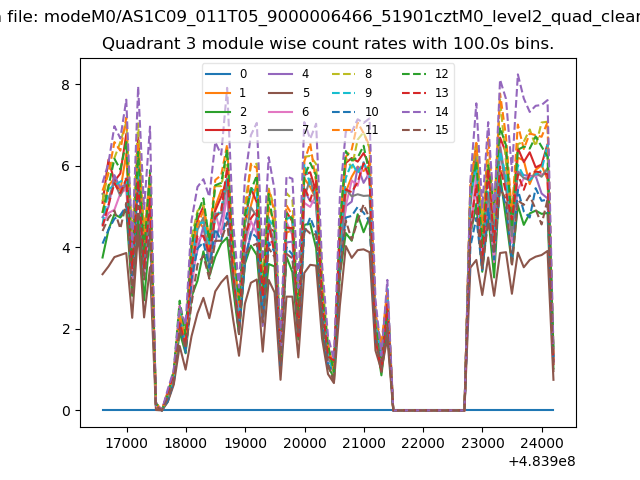
| Module-wise count rates for Quadrant A Data is divided into 100 sec bins |
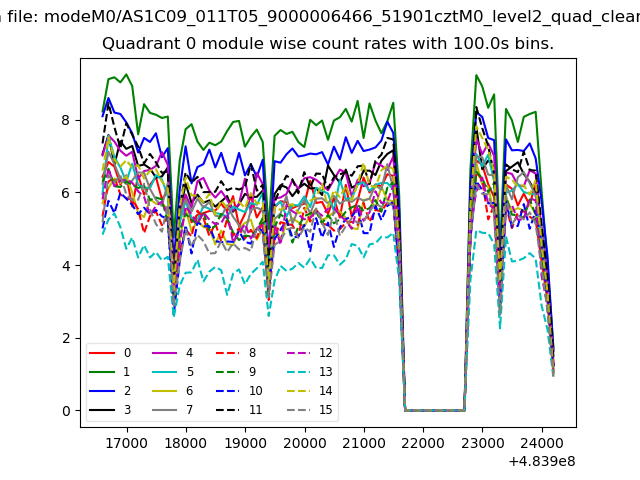 |
 |
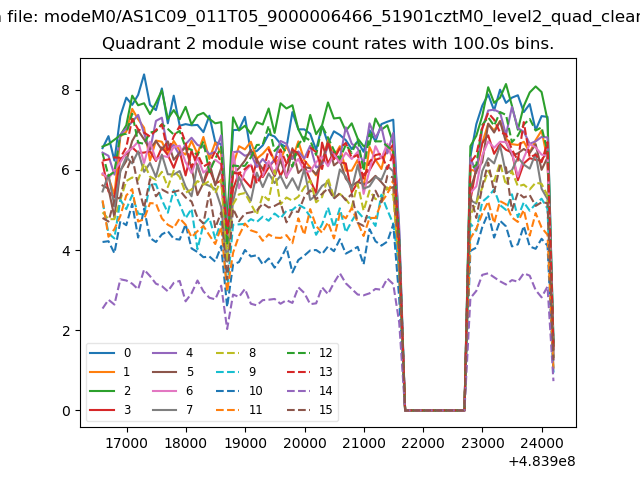
| Module-wise count rates for Quadrant B Data is divided into 100 sec bins |
 |
 |
| Module-wise count rates for Quadrant C Data is divided into 100 sec bins |
 |
 |
| Module-wise count rates for Quadrant D Data is divided into 100 sec bins |
 |
 |
| Parameter | Plot |
|---|---|
| CZT HV Monitor |  |
| D_VDD | 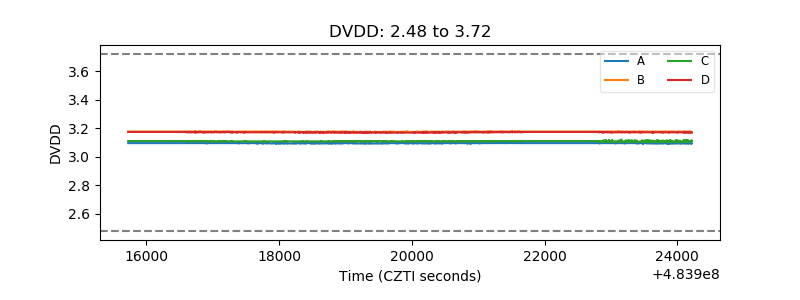 |
| Temperature 1 | 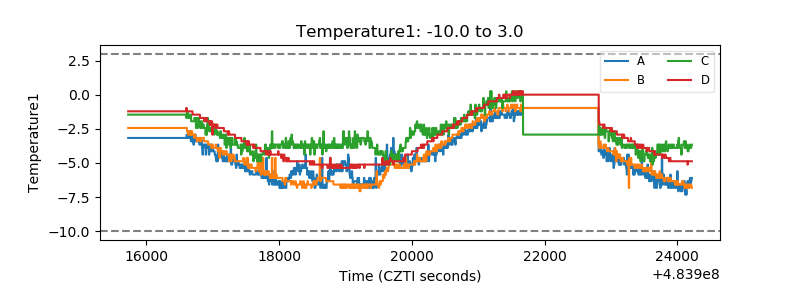 |
| Veto HV Monitor | 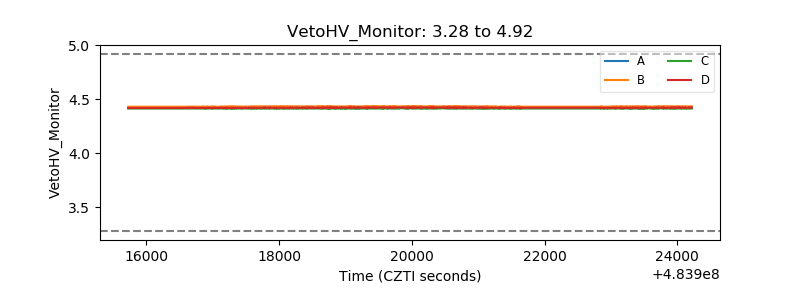 |
| Veto LLD | 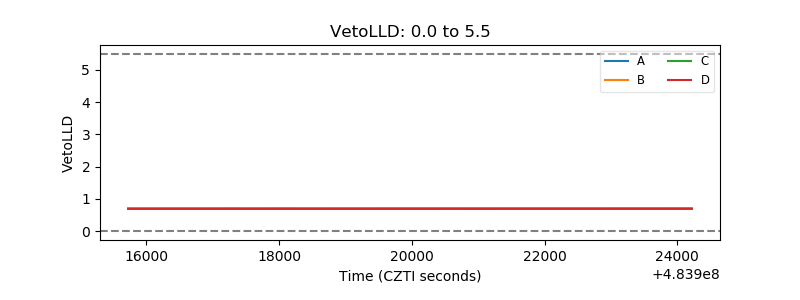 |
| Alpha Counter | 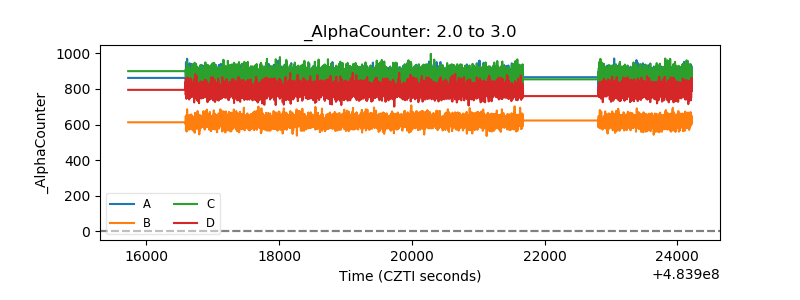 |
| _CPM_Rate | 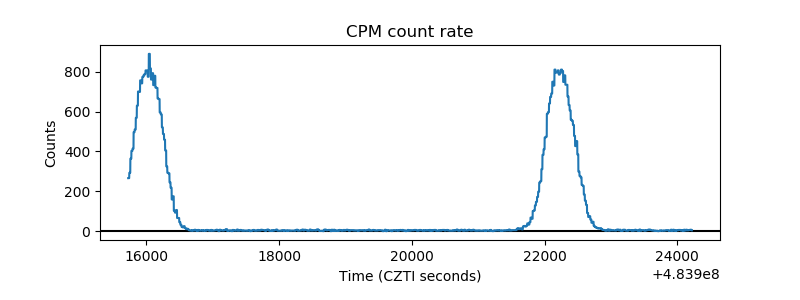 |
| CZT Counter | 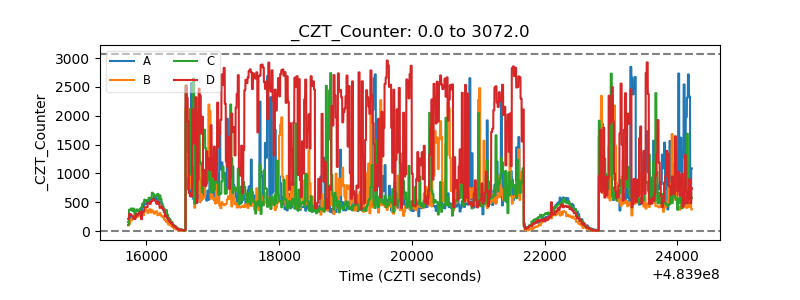 |
| +2.5 Volts monitor | 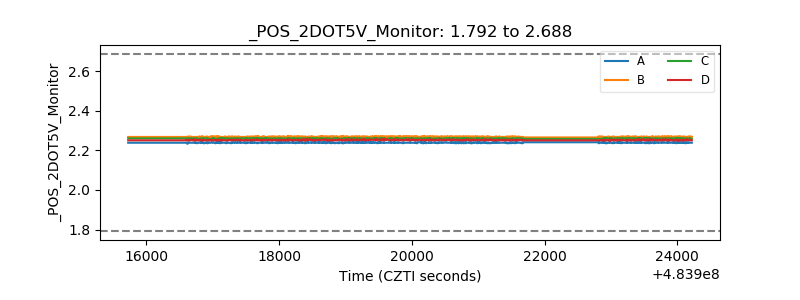 |
| +5 Volts monitor | 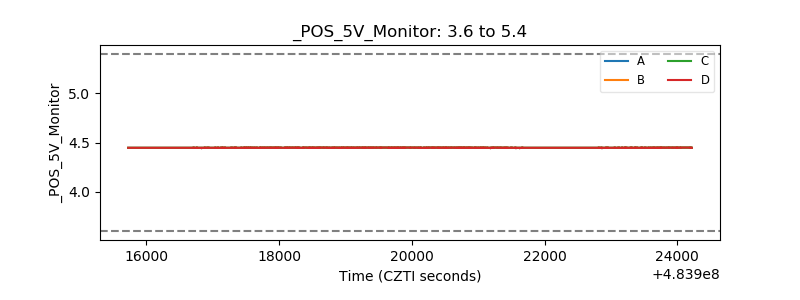 |
| _ROLL_ROT | 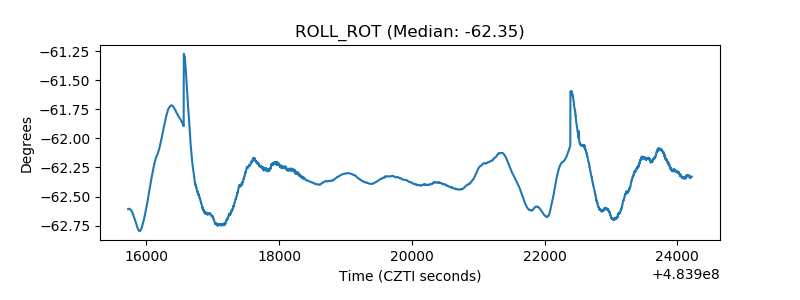 |
| _Roll_DEC | 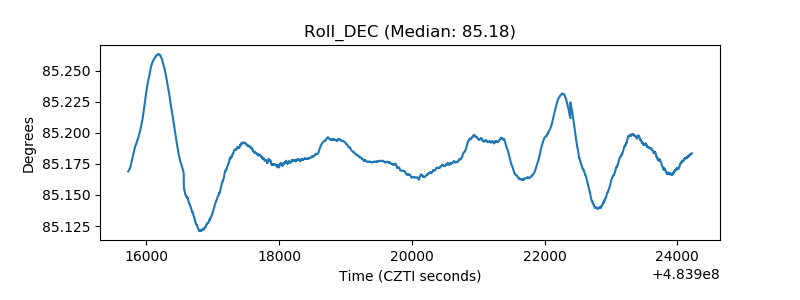 |
| _Roll_RA | 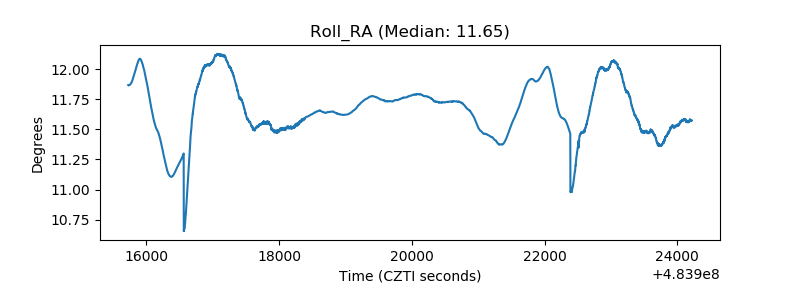 |
| Veto Counter | 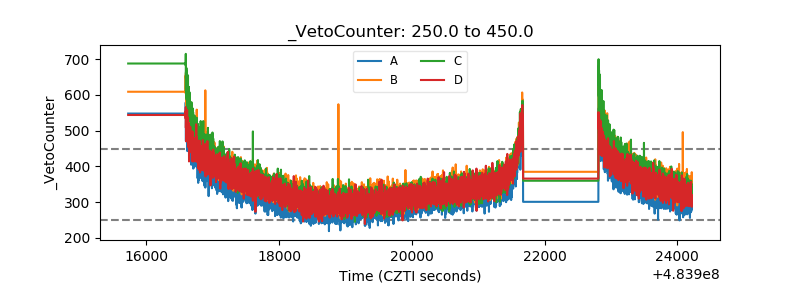 |