| Param | Original file | Final file |
|---|---|---|
| Filename | modeM0/AS1C09_011T05_9000006466_51902cztM0_level2.fits | modeM0/AS1C09_011T05_9000006466_51902cztM0_level2_quad_clean.evt |
| Size (bytes) | 654,828,480 | 95,022,720 |
| Size | 624.5 MB | 90.6 MB |
| Events in quadrant A | 7,150,503 | 599,041 |
| Events in quadrant B | 4,780,705 | 681,870 |
| Events in quadrant C | 4,797,522 | 621,095 |
| Events in quadrant D | 6,989,710 | 505,088 |
| Mode SS | |||
|---|---|---|---|
| Quadrant | BADHDUFLAG | Total packets | Discarded packets |
| A | 0 | 138 | 0 |
| B | 0 | 138 | 0 |
| C | 0 | 138 | 0 |
| D | 0 | 138 | 0 |
| Mode M0 | |||
|---|---|---|---|
| Quadrant | BADHDUFLAG | Total packets | Discarded packets |
| A | 0 | 25962 | 2 |
| B | 0 | 18979 | 2 |
| C | 0 | 18951 | 2 |
| D | 0 | 25523 | 2 |
| Mode M9 | |||
|---|---|---|---|
| Quadrant | BADHDUFLAG | Total packets | Discarded packets |
| A | 0 | 15 | 0 |
| B | 0 | 16 | 0 |
| C | 0 | 16 | 0 |
| D | 0 | 16 | 0 |
| Quadrant | Total seconds | Saturated seconds | Saturation percentage |
|---|---|---|---|
| A | 6738 | 635 | 9.424161% |
| B | 6738 | 377 | 5.595132% |
| C | 6738 | 280 | 4.155536% |
| D | 6738 | 1097 | 16.280795% |
Noise dominated data is calculated using 1-second bins in cleaned event files. If a bin has >2000 counts, and if more than 50% of those come from <1% of pixels, then it is considered to be noise-dominated and hence unusable.
| Quadrant | # 1 sec bins | Bins with >0 counts | Bins with >2000 counts | High rate bins dominated by noise | Noise dominated (total time) | Noise dominated (detector-on time) | Marked lightcurve |
|---|---|---|---|---|---|---|---|
| A | 7863 | 6739 | 566 | 566 | 7.20% | 8.40% | 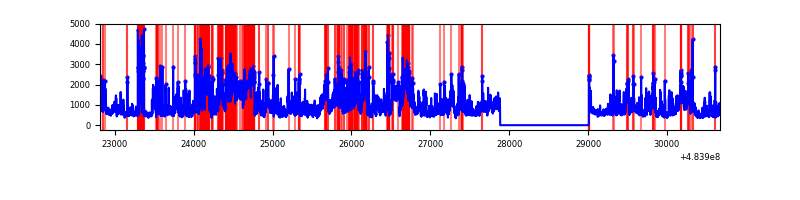 |
| B | 7863 | 6739 | 225 | 225 | 2.86% | 3.34% | 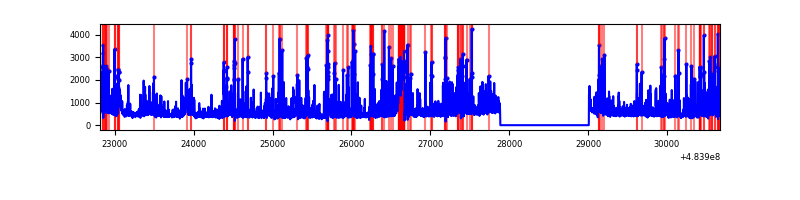 |
| C | 7863 | 6739 | 181 | 181 | 2.30% | 2.69% | 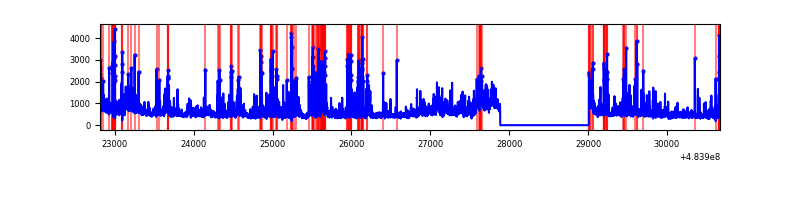 |
| D | 7863 | 6739 | 906 | 906 | 11.52% | 13.44% | 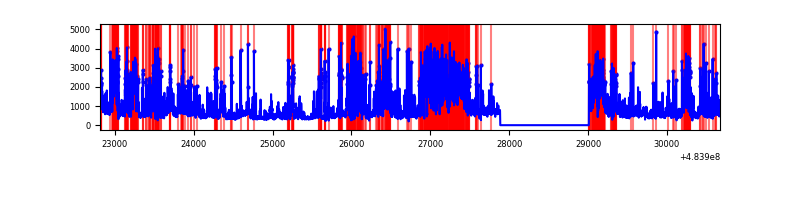 |
Top three noisy pixels from each quadrant. If the there are fewer than three noisy pixels in the level2.evt file, extra rows are filled as -1
| Pixel properties | Quadrant properties | ||||||
|---|---|---|---|---|---|---|---|
| Quadrant | DetID | PixID | Counts | Sigma | Mean | Median | Sigma |
| A | 15 | 174 | 1322177 | 7713.58 | 680 | 665 | 171.3 |
| A | 12 | 3 | 876497 | 5112.18 | 680 | 665 | 171.3 |
| A | 4 | 175 | 850481 | 4960.32 | 680 | 665 | 171.3 |
| B | 4 | 171 | 846758 | 5789.69 | 692 | 668 | 146.1 |
| B | 12 | 32 | 562602 | 3845.24 | 692 | 668 | 146.1 |
| B | 0 | 213 | 81627 | 553.99 | 692 | 668 | 146.1 |
| C | 15 | 178 | 358632 | 1878.14 | 683 | 677 | 190.6 |
| C | 15 | 248 | 339251 | 1776.45 | 683 | 677 | 190.6 |
| C | 15 | 224 | 285342 | 1493.6 | 683 | 677 | 190.6 |
| D | 6 | 42 | 876677 | 4539.45 | 624 | 600 | 193.0 |
| D | 12 | 17 | 735895 | 3809.98 | 624 | 600 | 193.0 |
| D | 13 | 187 | 703927 | 3644.34 | 624 | 600 | 193.0 |
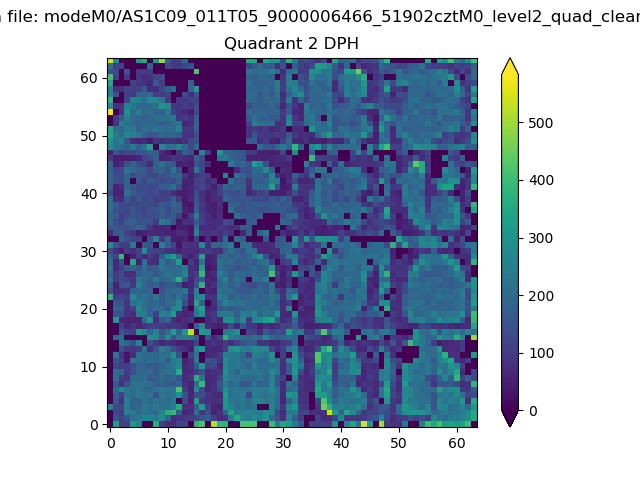
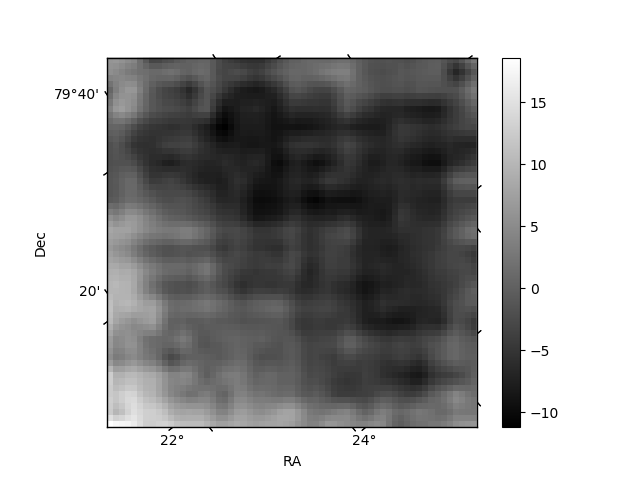
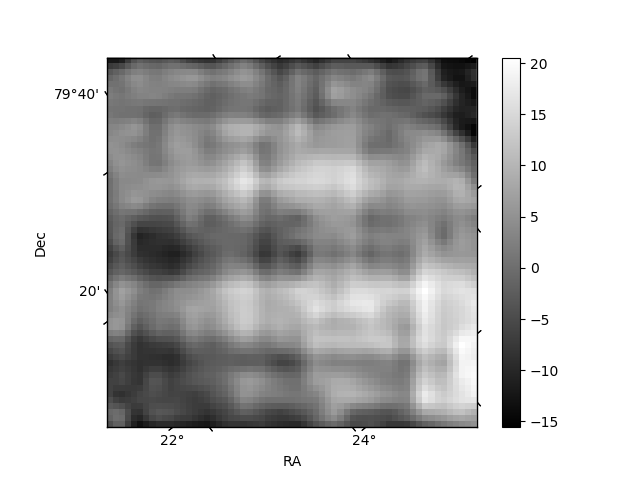
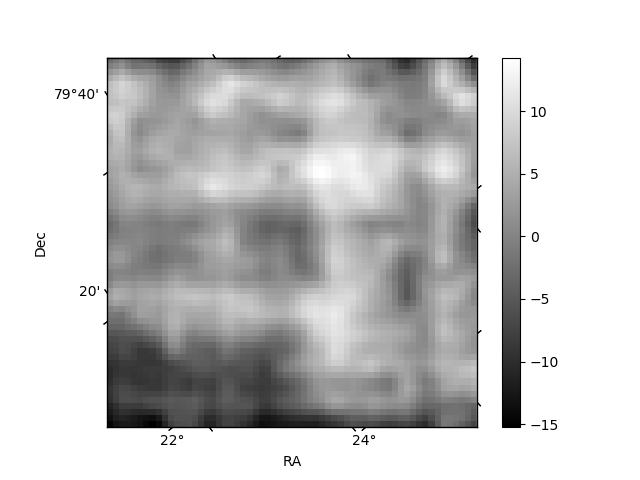
Histogram calculated using DETX and DETY for each event in the final _common_clean file
| Quadrant A | 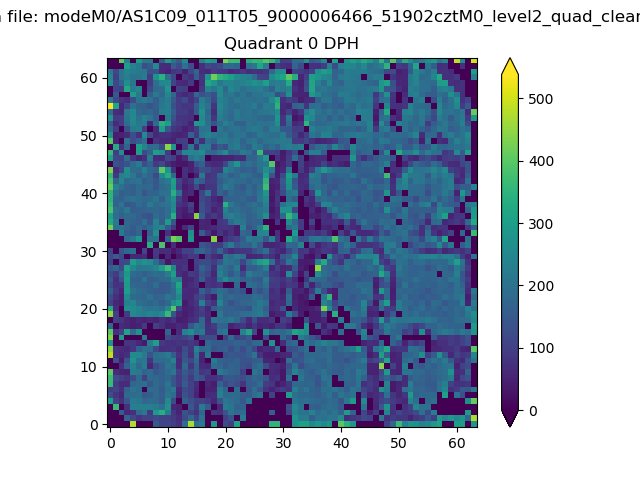 |
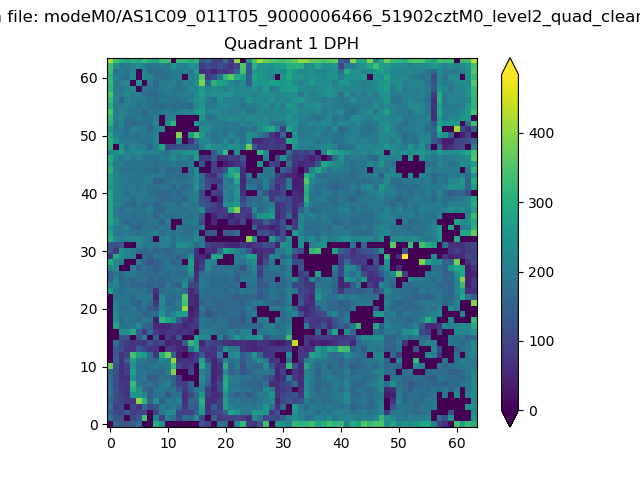 |
Quadrant B |
|---|---|---|---|
| Quadrant D | 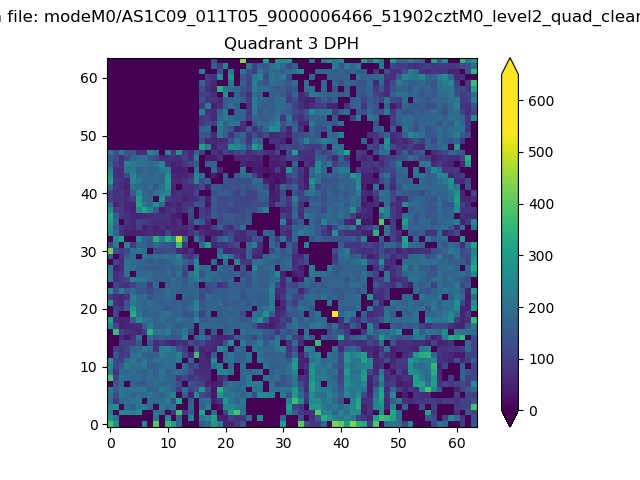 |
 |
Quadrant C |
| Plot type | Count rate plots | Images |
|---|---|---|
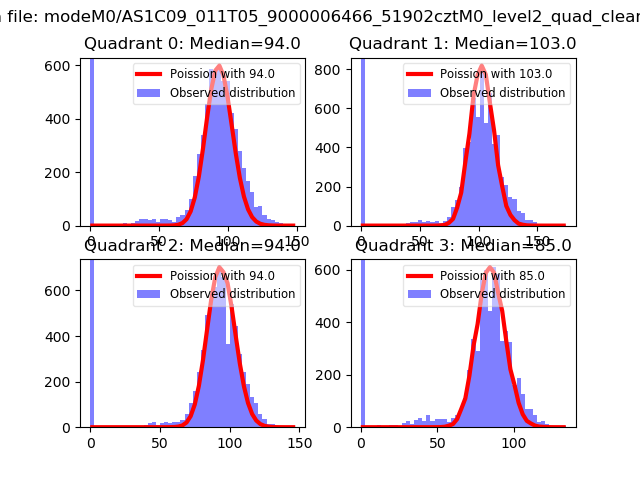
| Comparison with Poisson distribution Blue bars denote a histogram of data divided into 1 sec bins. Red curve is a Poisson curve with rate = median count rate of data. |
 |
 |
| Quadrant-wise count rates Data is divided into 100 sec bins |
 |
|
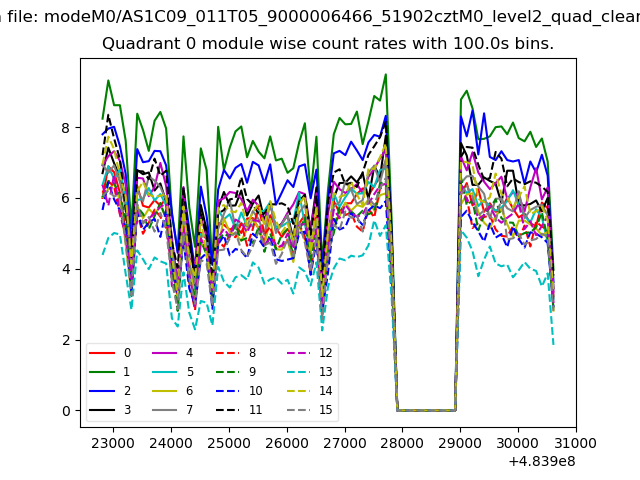
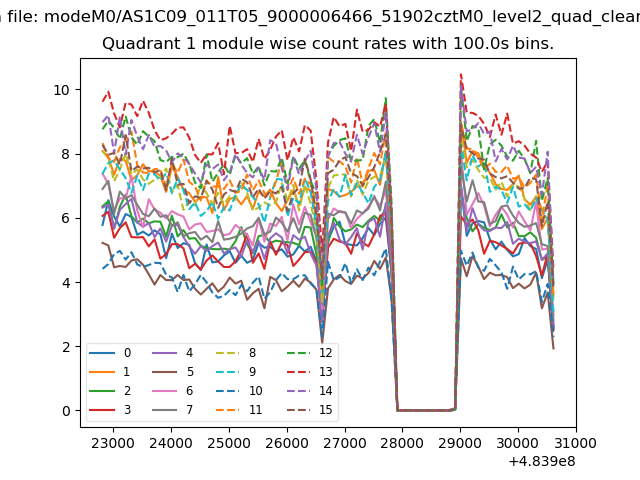
| Module-wise count rates for Quadrant A Data is divided into 100 sec bins |
 |
 |
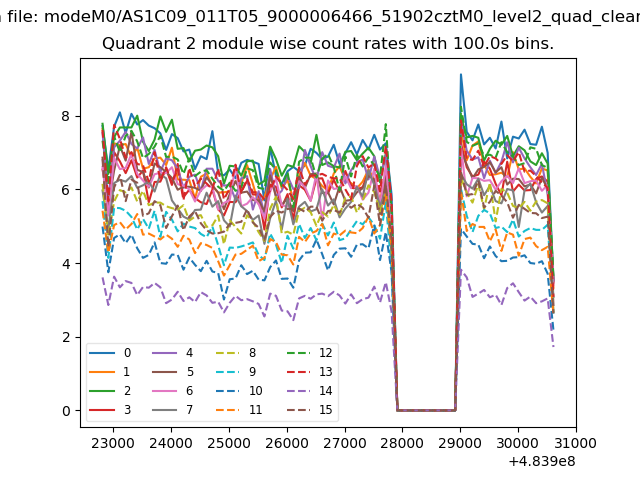
| Module-wise count rates for Quadrant B Data is divided into 100 sec bins |
 |
 |
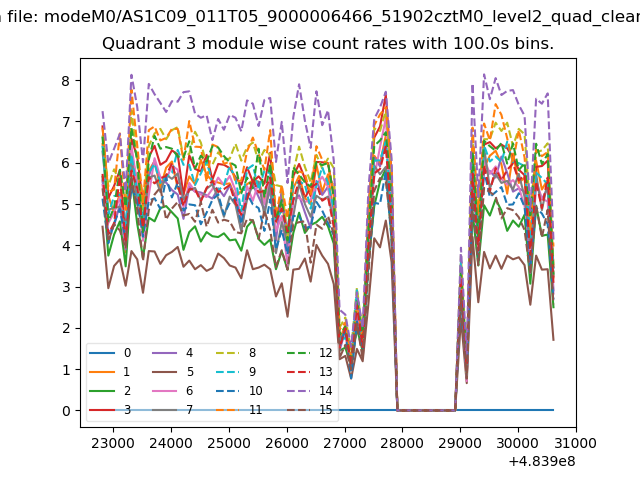
| Module-wise count rates for Quadrant C Data is divided into 100 sec bins |
 |
 |
| Module-wise count rates for Quadrant D Data is divided into 100 sec bins |
 |
 |
| Parameter | Plot |
|---|---|
| CZT HV Monitor | 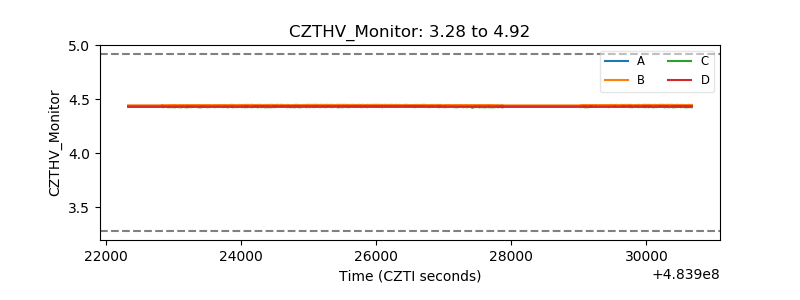 |
| D_VDD | 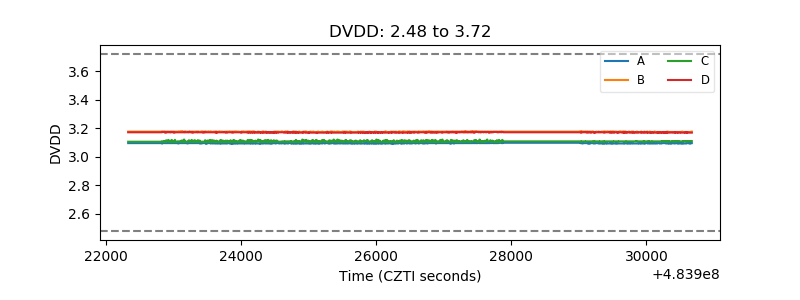 |
| Temperature 1 | 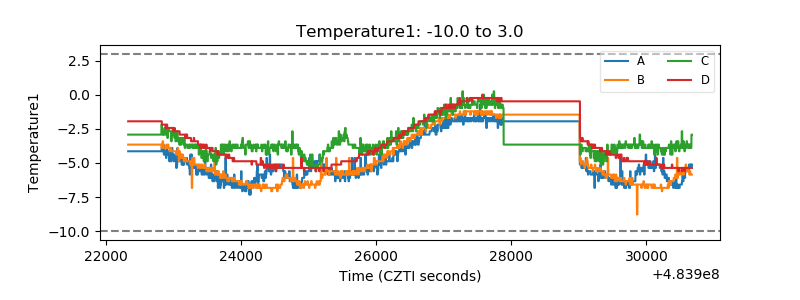 |
| Veto HV Monitor | 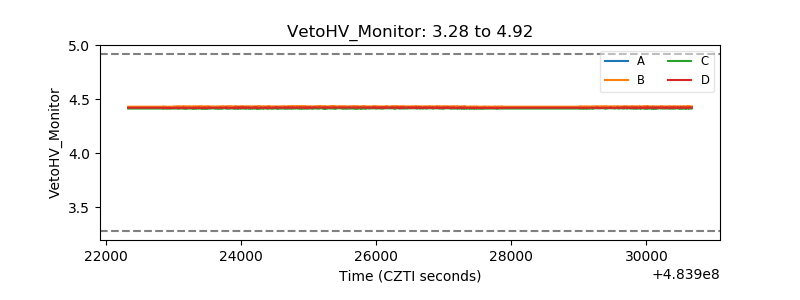 |
| Veto LLD | 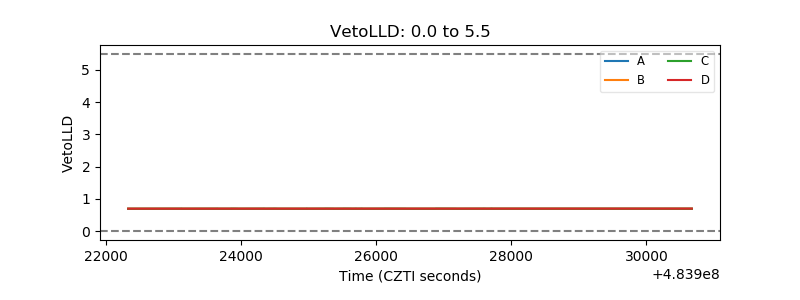 |
| Alpha Counter | 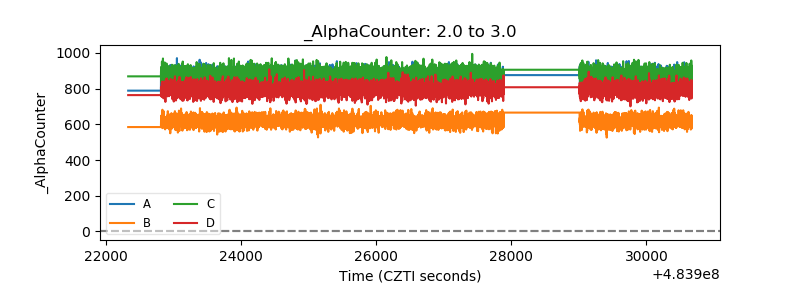 |
| _CPM_Rate | 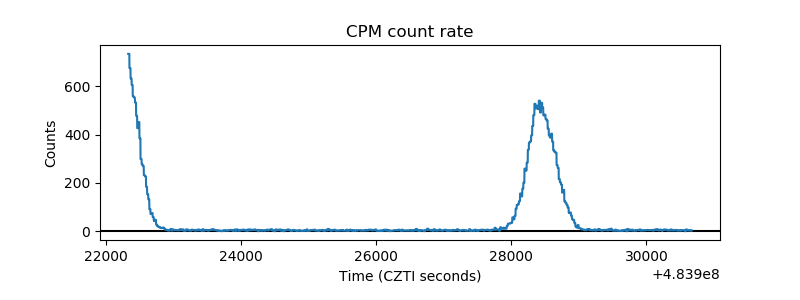 |
| CZT Counter | 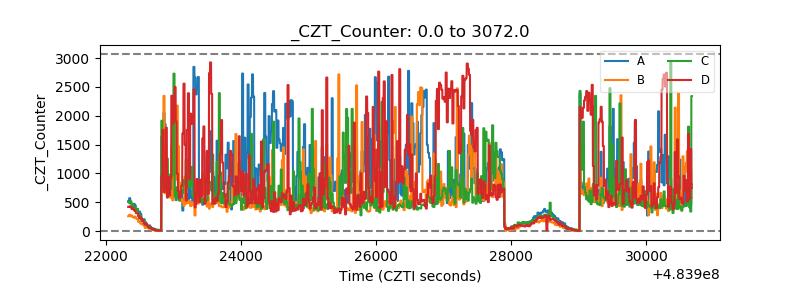 |
| +2.5 Volts monitor | 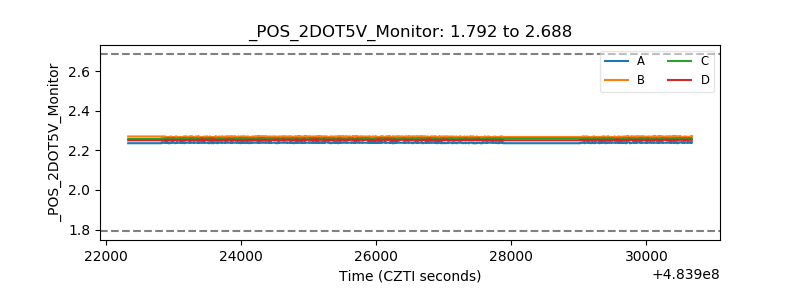 |
| +5 Volts monitor | 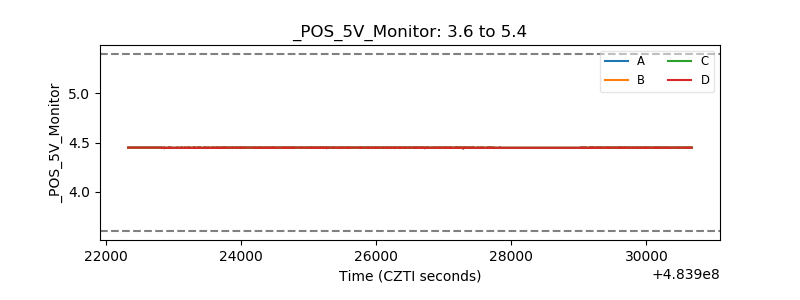 |
| _ROLL_ROT | 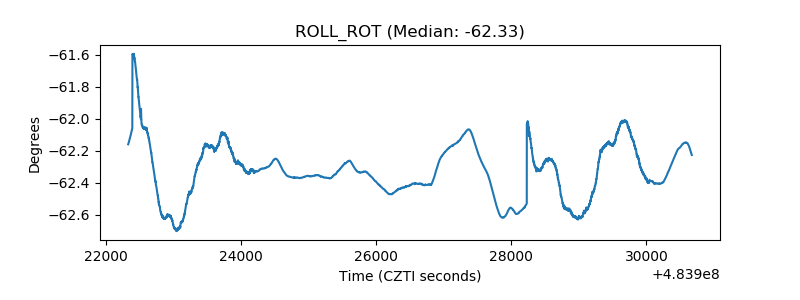 |
| _Roll_DEC | 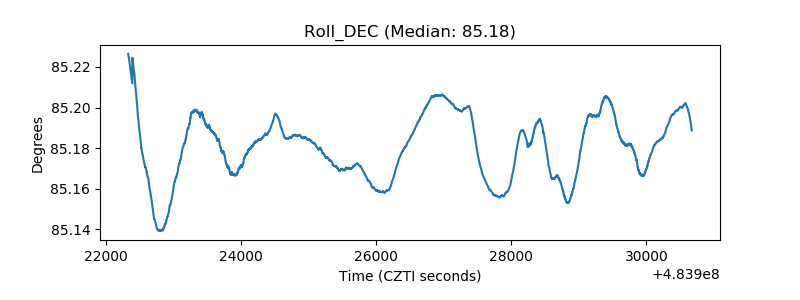 |
| _Roll_RA | 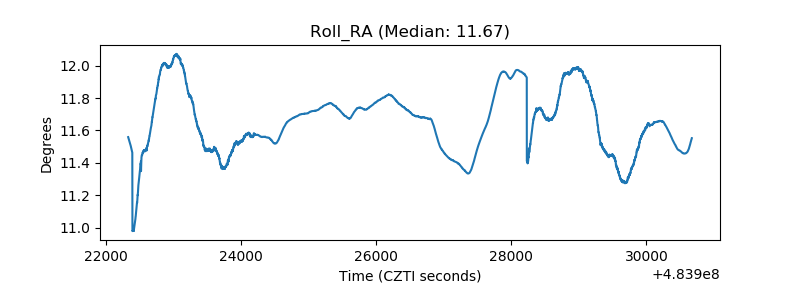 |
| Veto Counter | 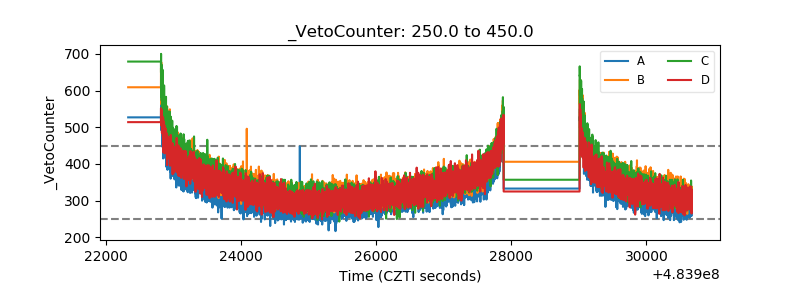 |