| Param | Original file | Final file |
|---|---|---|
| Filename | modeM0/AS1C09_011T05_9000006466_51903cztM0_level2.fits | modeM0/AS1C09_011T05_9000006466_51903cztM0_level2_quad_clean.evt |
| Size (bytes) | 667,710,720 | 87,615,360 |
| Size | 636.8 MB | 83.6 MB |
| Events in quadrant A | 5,453,464 | 570,281 |
| Events in quadrant B | 5,091,676 | 619,766 |
| Events in quadrant C | 5,391,320 | 559,392 |
| Events in quadrant D | 8,279,062 | 451,401 |
| Mode SS | |||
|---|---|---|---|
| Quadrant | BADHDUFLAG | Total packets | Discarded packets |
| A | 0 | 132 | 0 |
| B | 0 | 132 | 0 |
| C | 0 | 132 | 0 |
| D | 0 | 132 | 0 |
| Mode M0 | |||
|---|---|---|---|
| Quadrant | BADHDUFLAG | Total packets | Discarded packets |
| A | 0 | 20859 | 1 |
| B | 0 | 19674 | 1 |
| C | 0 | 20601 | 1 |
| D | 0 | 29087 | 1 |
| Mode M9 | |||
|---|---|---|---|
| Quadrant | BADHDUFLAG | Total packets | Discarded packets |
| A | 0 | 10 | 0 |
| B | 0 | 10 | 0 |
| C | 0 | 10 | 0 |
| D | 0 | 10 | 0 |
| Quadrant | Total seconds | Saturated seconds | Saturation percentage |
|---|---|---|---|
| A | 6473 | 449 | 6.936505% |
| B | 6474 | 587 | 9.067037% |
| C | 6474 | 502 | 7.754093% |
| D | 6474 | 1428 | 22.057461% |
Noise dominated data is calculated using 1-second bins in cleaned event files. If a bin has >2000 counts, and if more than 50% of those come from <1% of pixels, then it is considered to be noise-dominated and hence unusable.
| Quadrant | # 1 sec bins | Bins with >0 counts | Bins with >2000 counts | High rate bins dominated by noise | Noise dominated (total time) | Noise dominated (detector-on time) | Marked lightcurve |
|---|---|---|---|---|---|---|---|
| A | 7473 | 6474 | 363 | 363 | 4.86% | 5.61% | 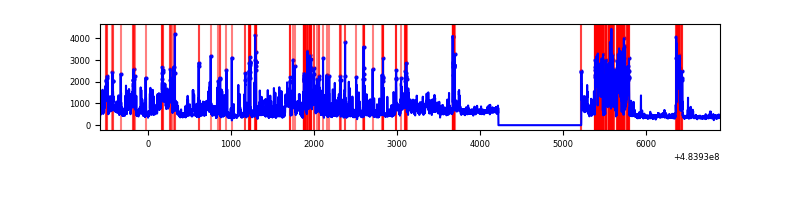 |
| B | 7474 | 6475 | 361 | 361 | 4.83% | 5.58% | 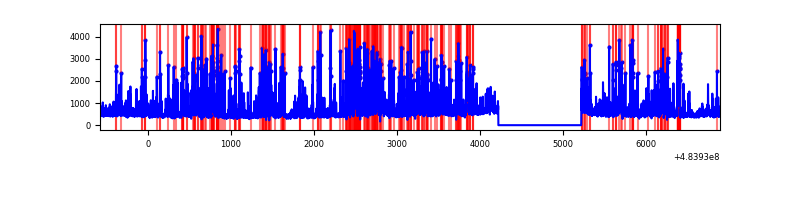 |
| C | 7474 | 6475 | 344 | 344 | 4.60% | 5.31% | 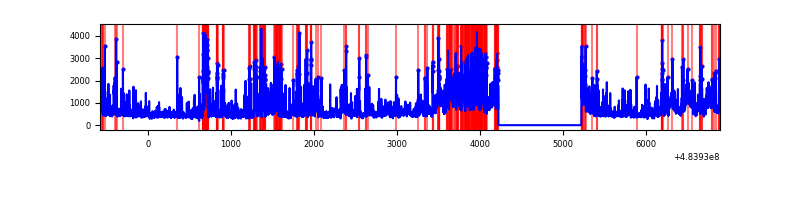 |
| D | 7474 | 6475 | 1283 | 1283 | 17.17% | 19.81% | 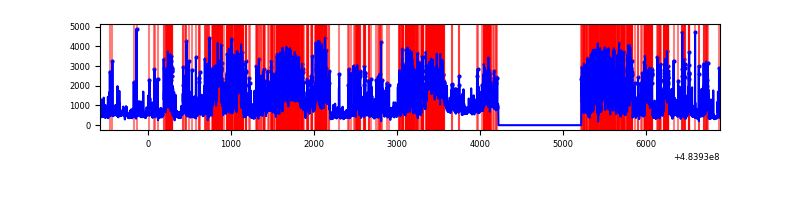 |
Top three noisy pixels from each quadrant. If the there are fewer than three noisy pixels in the level2.evt file, extra rows are filled as -1
| Pixel properties | Quadrant properties | ||||||
|---|---|---|---|---|---|---|---|
| Quadrant | DetID | PixID | Counts | Sigma | Mean | Median | Sigma |
| A | 4 | 175 | 1178531 | 7256.69 | 644 | 627 | 162.3 |
| A | 15 | 174 | 400914 | 2466.04 | 644 | 627 | 162.3 |
| A | 7 | 64 | 302727 | 1861.14 | 644 | 627 | 162.3 |
| B | 12 | 32 | 1367071 | 9943.97 | 643 | 620 | 137.4 |
| B | 4 | 171 | 639267 | 4647.58 | 643 | 620 | 137.4 |
| B | 0 | 216 | 112402 | 813.46 | 643 | 620 | 137.4 |
| C | 14 | 245 | 721127 | 4088.82 | 629 | 620 | 176.2 |
| C | 15 | 192 | 624009 | 3537.68 | 629 | 620 | 176.2 |
| C | 15 | 248 | 599424 | 3398.16 | 629 | 620 | 176.2 |
| D | 6 | 42 | 1566456 | 8891.74 | 579 | 559 | 176.1 |
| D | 15 | 94 | 991557 | 5627.25 | 579 | 559 | 176.1 |
| D | 0 | 5 | 877445 | 4979.28 | 579 | 559 | 176.1 |
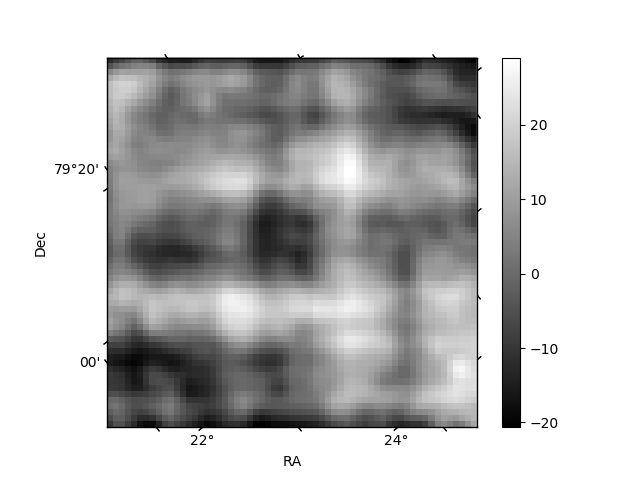
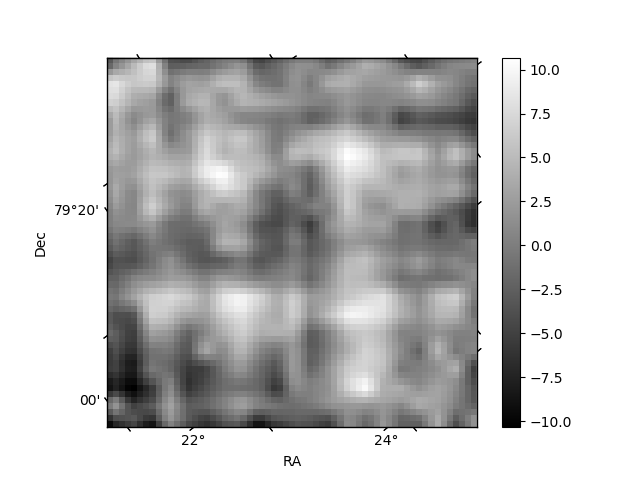
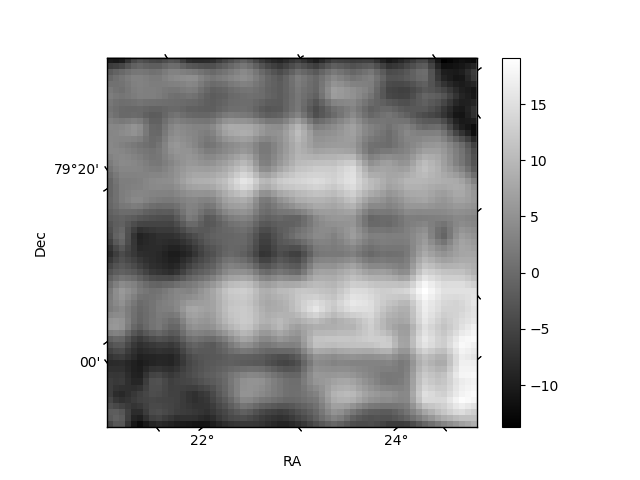
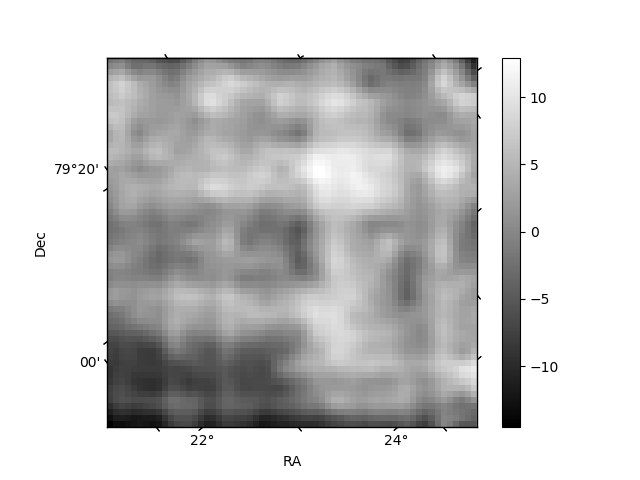
Histogram calculated using DETX and DETY for each event in the final _common_clean file
| Quadrant A | 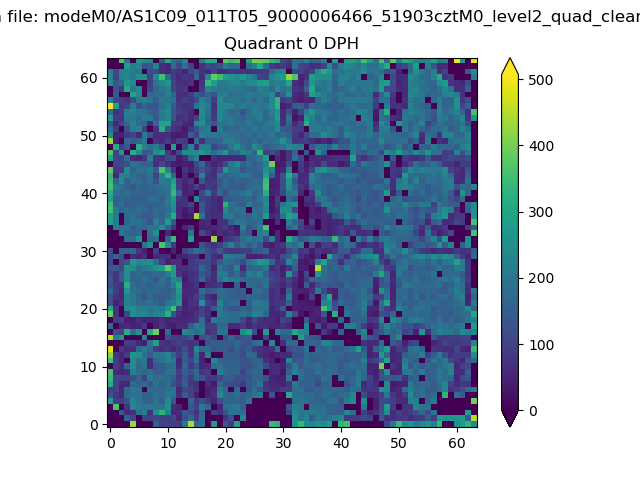 |
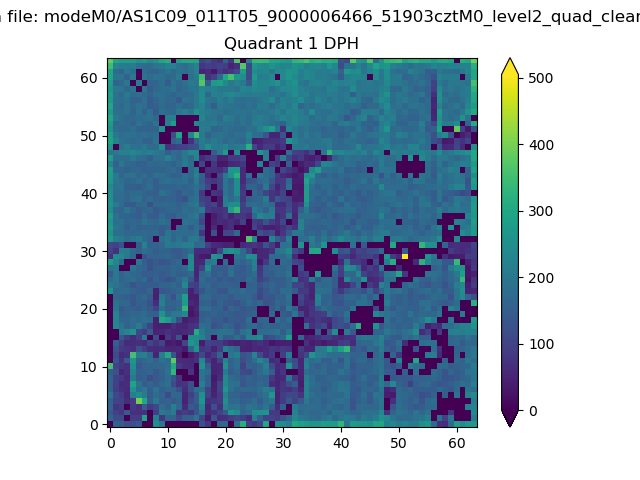 |
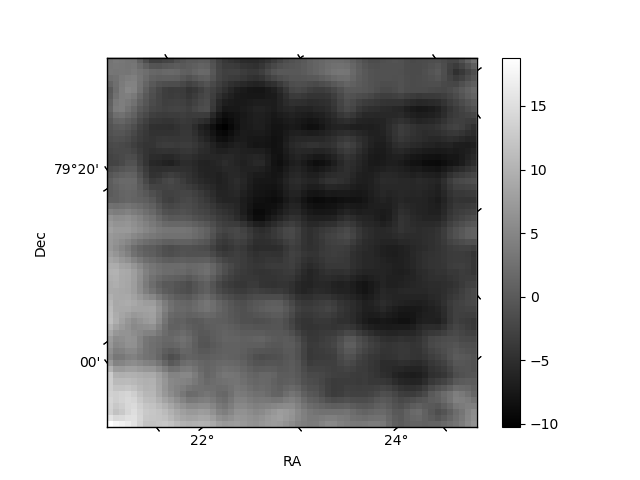
Quadrant B |
|---|---|---|---|
| Quadrant D | 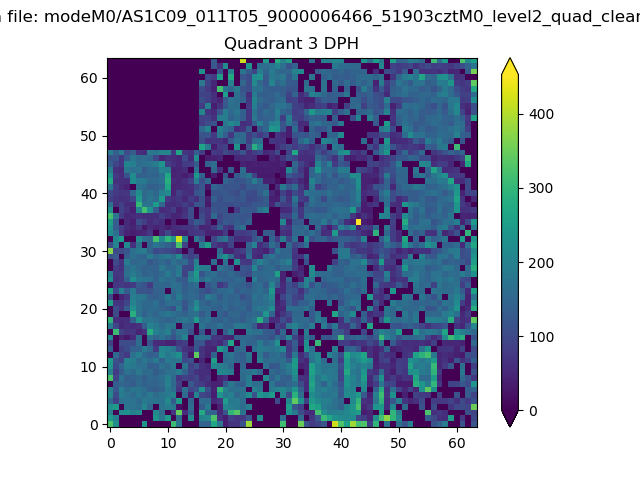 |
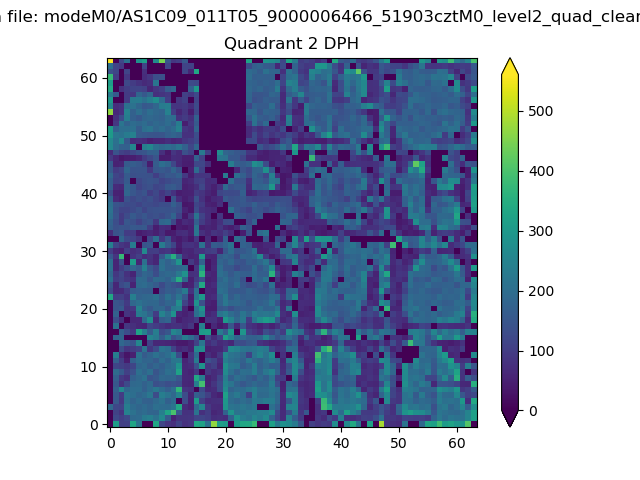 |
Quadrant C |
| Plot type | Count rate plots | Images |
|---|---|---|
| Comparison with Poisson distribution Blue bars denote a histogram of data divided into 1 sec bins. Red curve is a Poisson curve with rate = median count rate of data. |
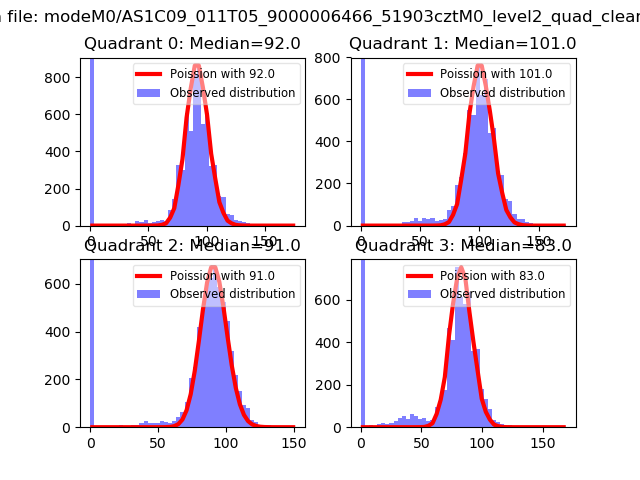 |
 |
| Quadrant-wise count rates Data is divided into 100 sec bins |
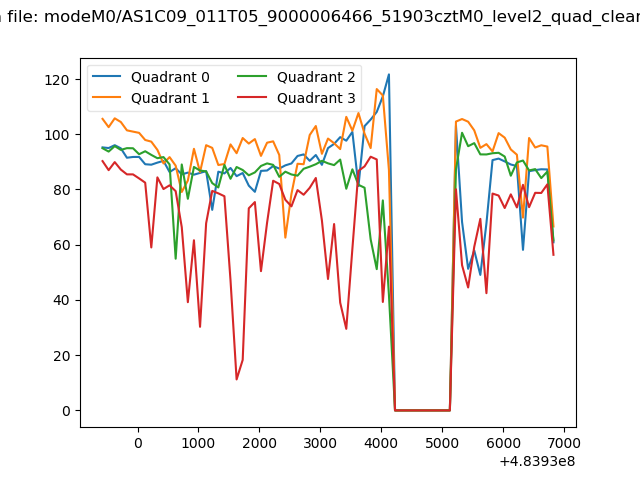 |
|
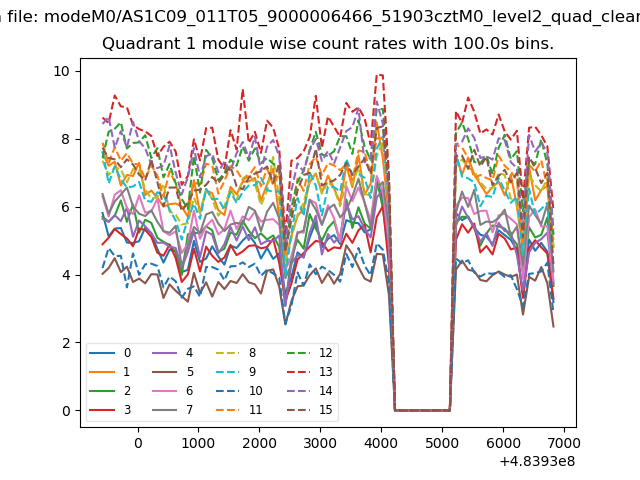
| Module-wise count rates for Quadrant A Data is divided into 100 sec bins |
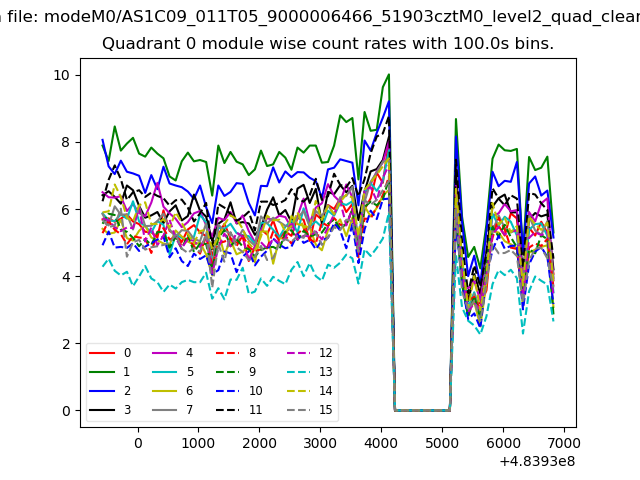 |
 |
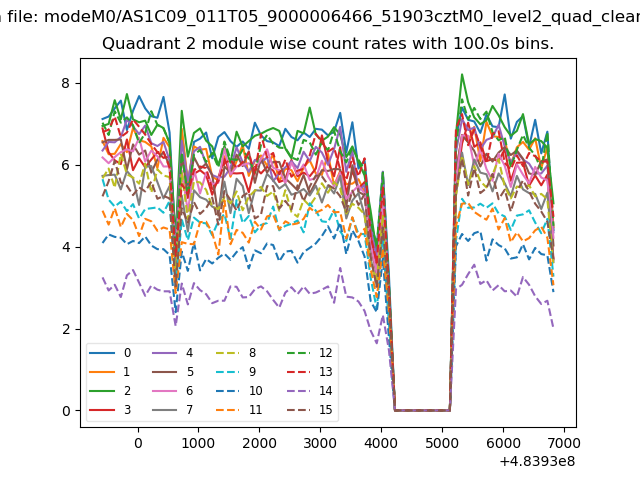
| Module-wise count rates for Quadrant B Data is divided into 100 sec bins |
 |
 |
| Module-wise count rates for Quadrant C Data is divided into 100 sec bins |
 |
 |
| Module-wise count rates for Quadrant D Data is divided into 100 sec bins |
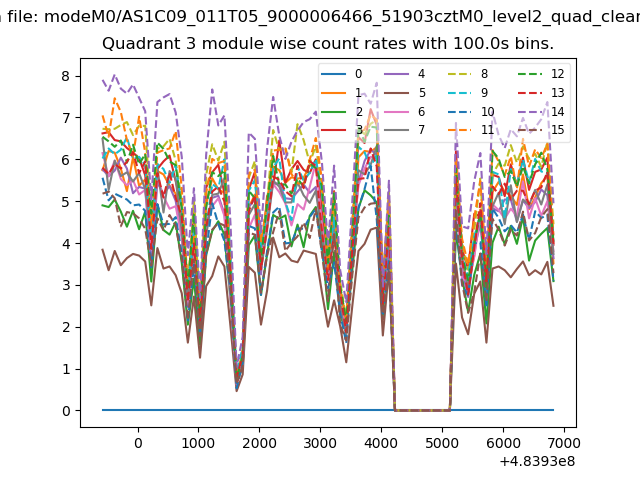 |
 |
| Parameter | Plot |
|---|---|
| CZT HV Monitor | 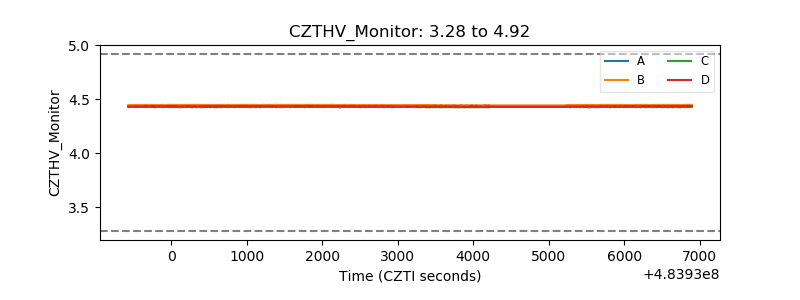 |
| D_VDD |  |
| Temperature 1 | 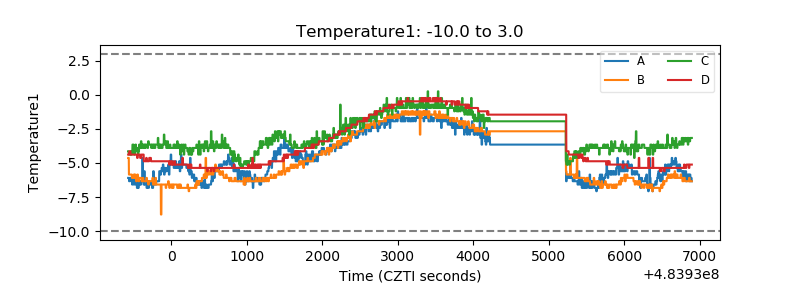 |
| Veto HV Monitor |  |
| Veto LLD | 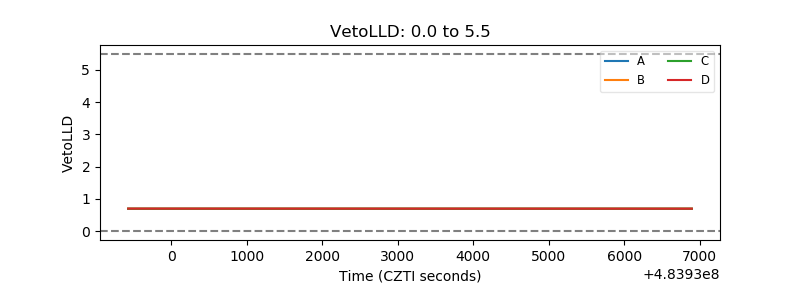 |
| Alpha Counter | 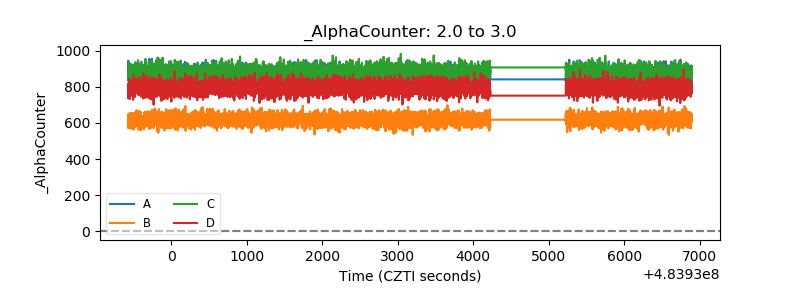 |
| _CPM_Rate | 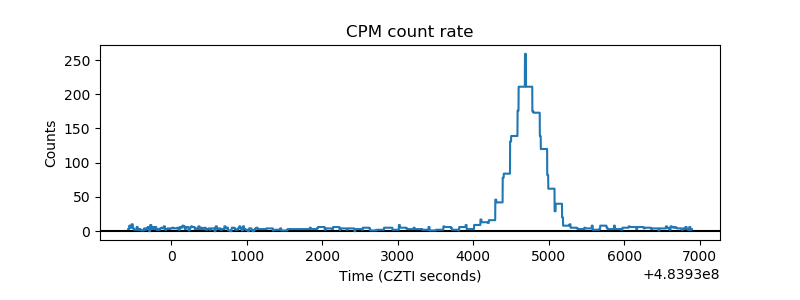 |
| CZT Counter | 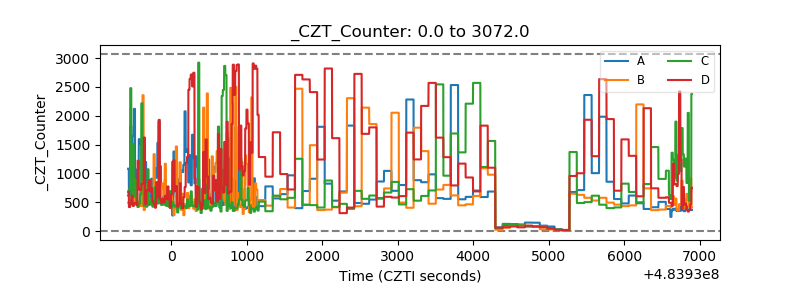 |
| +2.5 Volts monitor | 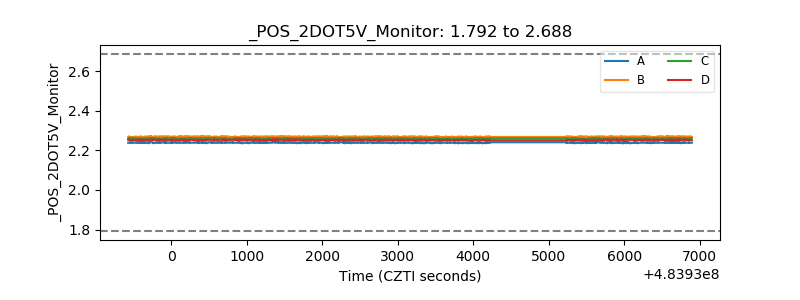 |
| +5 Volts monitor | 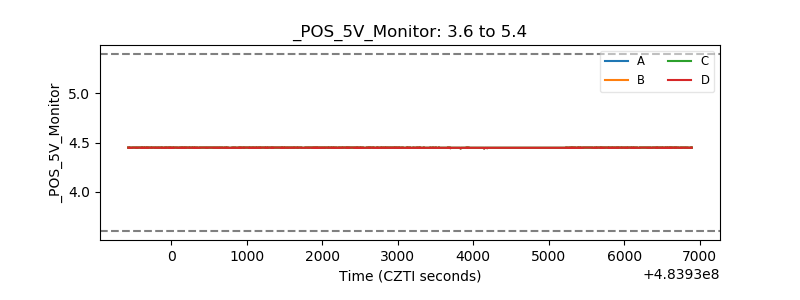 |
| _ROLL_ROT | 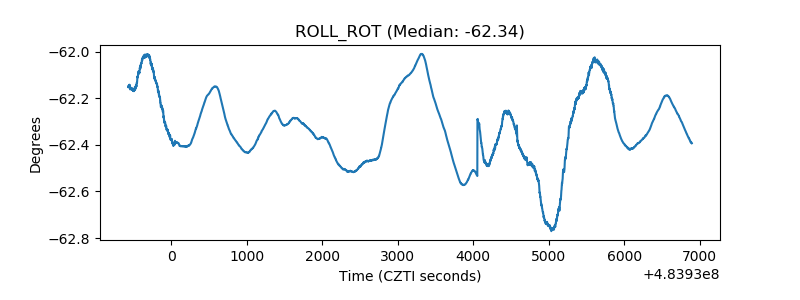 |
| _Roll_DEC | 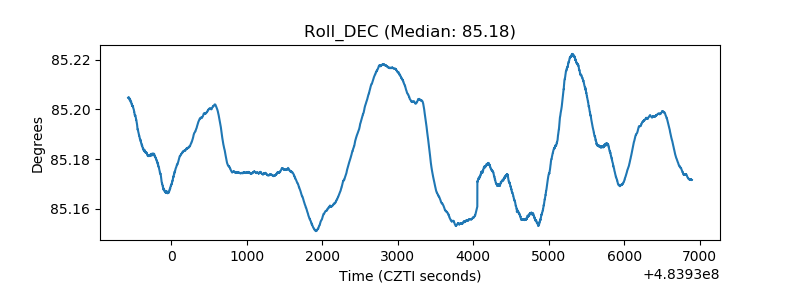 |
| _Roll_RA | 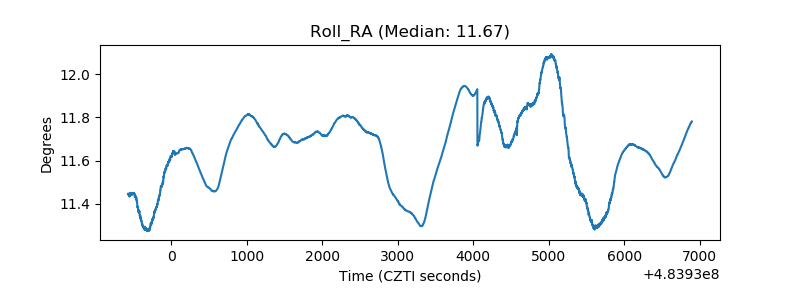 |
| Veto Counter | 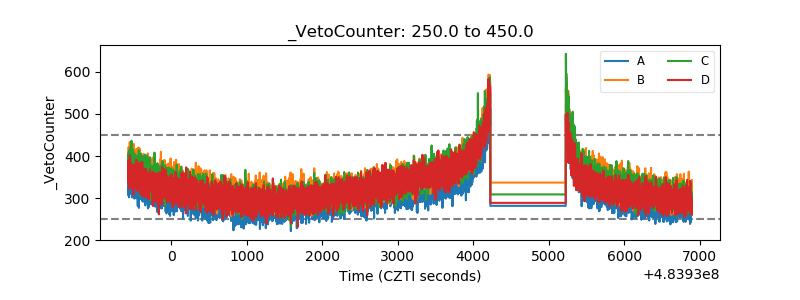 |