| Param | Original file | Final file |
|---|---|---|
| Filename | modeM0/AS1C09_011T05_9000006466_51904cztM0_level2.fits | modeM0/AS1C09_011T05_9000006466_51904cztM0_level2_quad_clean.evt |
| Size (bytes) | 737,619,840 | 77,633,280 |
| Size | 703.4 MB | 74.0 MB |
| Events in quadrant A | 7,537,075 | 439,538 |
| Events in quadrant B | 6,724,088 | 524,583 |
| Events in quadrant C | 4,972,096 | 547,206 |
| Events in quadrant D | 7,595,082 | 409,019 |
| Mode SS | |||
|---|---|---|---|
| Quadrant | BADHDUFLAG | Total packets | Discarded packets |
| A | 0 | 126 | 0 |
| B | 0 | 126 | 0 |
| C | 0 | 126 | 0 |
| D | 0 | 126 | 0 |
| Mode M0 | |||
|---|---|---|---|
| Quadrant | BADHDUFLAG | Total packets | Discarded packets |
| A | 0 | 26838 | 1 |
| B | 0 | 24258 | 1 |
| C | 0 | 19116 | 1 |
| D | 0 | 26975 | 1 |
| Mode M9 | |||
|---|---|---|---|
| Quadrant | BADHDUFLAG | Total packets | Discarded packets |
| A | 0 | 7 | 0 |
| B | 0 | 7 | 0 |
| C | 0 | 7 | 0 |
| D | 0 | 7 | 0 |
| Quadrant | Total seconds | Saturated seconds | Saturation percentage |
|---|---|---|---|
| A | 6153 | 1612 | 26.198602% |
| B | 6153 | 1211 | 19.681456% |
| C | 6154 | 278 | 4.517387% |
| D | 6154 | 1478 | 24.016900% |
Noise dominated data is calculated using 1-second bins in cleaned event files. If a bin has >2000 counts, and if more than 50% of those come from <1% of pixels, then it is considered to be noise-dominated and hence unusable.
| Quadrant | # 1 sec bins | Bins with >0 counts | Bins with >2000 counts | High rate bins dominated by noise | Noise dominated (total time) | Noise dominated (detector-on time) | Marked lightcurve |
|---|---|---|---|---|---|---|---|
| A | 6873 | 6154 | 1203 | 1203 | 17.50% | 19.55% | 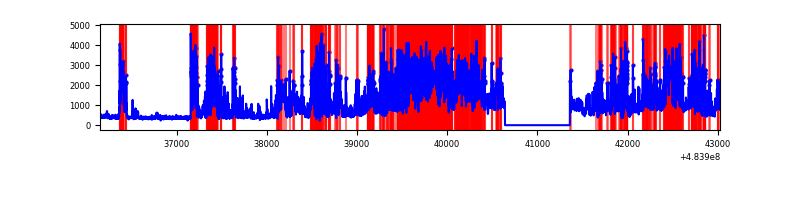 |
| B | 6873 | 6154 | 915 | 915 | 13.31% | 14.87% | 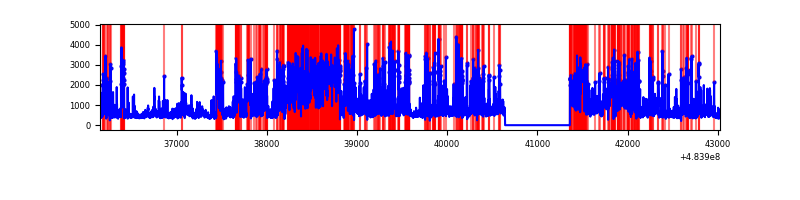 |
| C | 6874 | 6155 | 211 | 211 | 3.07% | 3.43% | 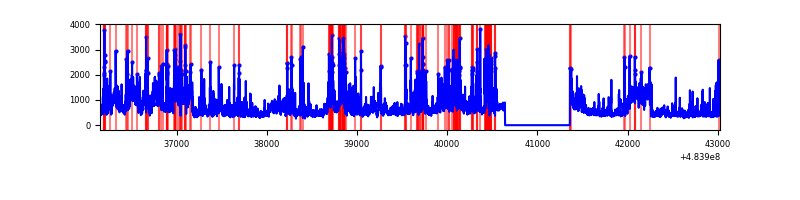 |
| D | 6874 | 6155 | 1299 | 1299 | 18.90% | 21.10% | 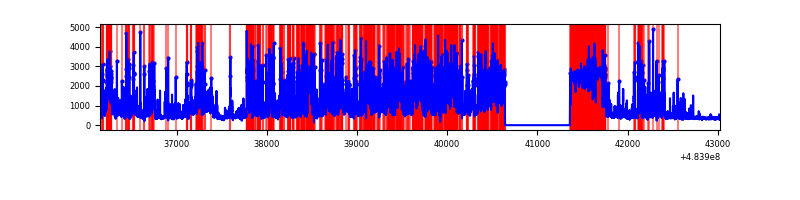 |
Top three noisy pixels from each quadrant. If the there are fewer than three noisy pixels in the level2.evt file, extra rows are filled as -1
| Pixel properties | Quadrant properties | ||||||
|---|---|---|---|---|---|---|---|
| Quadrant | DetID | PixID | Counts | Sigma | Mean | Median | Sigma |
| A | 7 | 64 | 3276951 | 22846.75 | 563 | 548 | 143.4 |
| A | 12 | 3 | 648329 | 4517.05 | 563 | 548 | 143.4 |
| A | 4 | 175 | 612042 | 4264.02 | 563 | 548 | 143.4 |
| B | 5 | 172 | 2704950 | 21696.74 | 582 | 563 | 124.6 |
| B | 12 | 32 | 458222 | 3671.7 | 582 | 563 | 124.6 |
| B | 4 | 171 | 358788 | 2873.97 | 582 | 563 | 124.6 |
| C | 15 | 192 | 773527 | 4599.41 | 606 | 601 | 168.0 |
| C | 10 | 22 | 344709 | 2047.66 | 606 | 601 | 168.0 |
| C | 15 | 248 | 339756 | 2018.19 | 606 | 601 | 168.0 |
| D | 15 | 94 | 3011050 | 18399.05 | 527 | 508 | 163.6 |
| D | 8 | 176 | 912768 | 5575.31 | 527 | 508 | 163.6 |
| D | 6 | 42 | 447407 | 2731.24 | 527 | 508 | 163.6 |
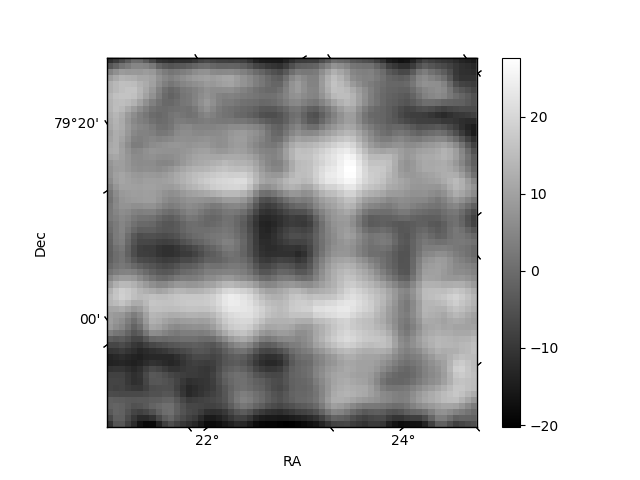
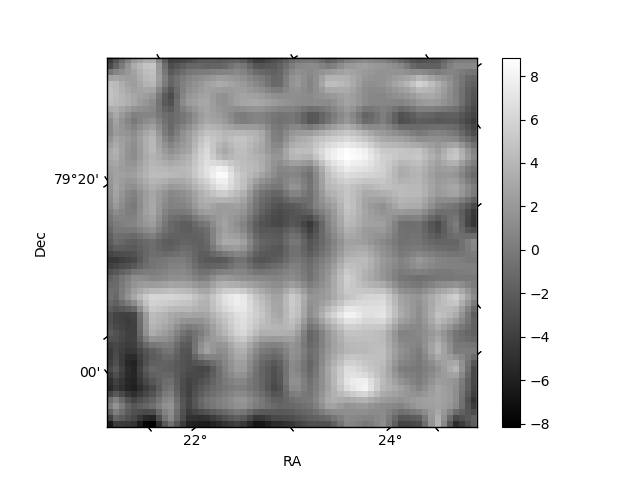
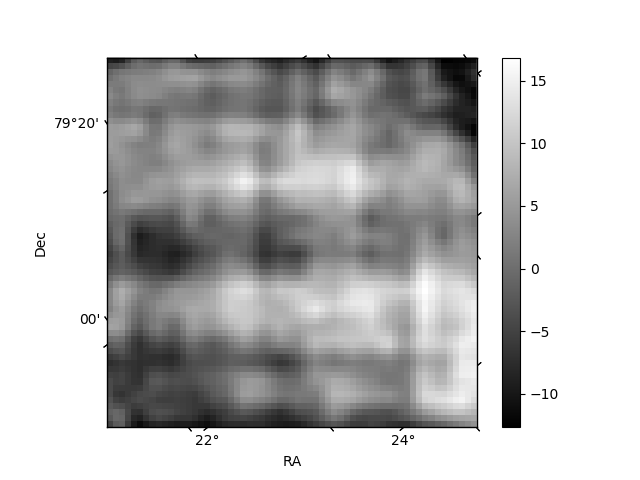
Histogram calculated using DETX and DETY for each event in the final _common_clean file
| Quadrant A | 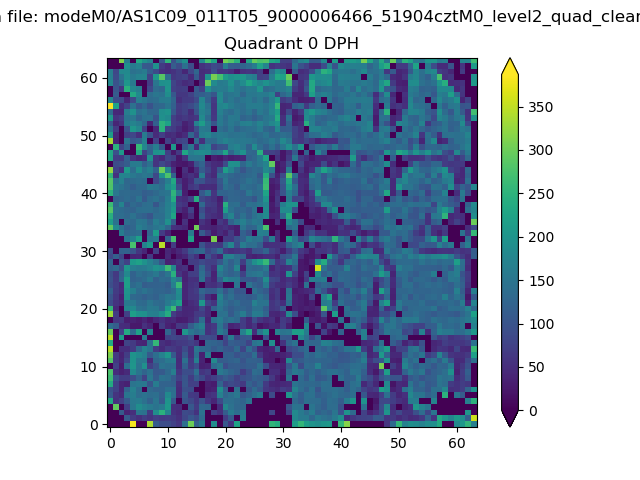 |
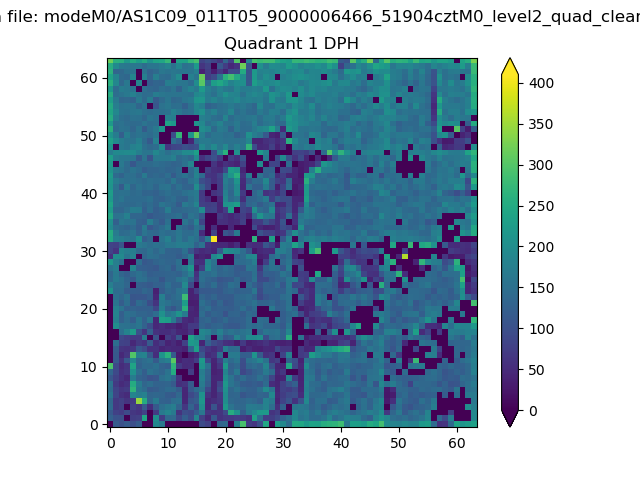 |
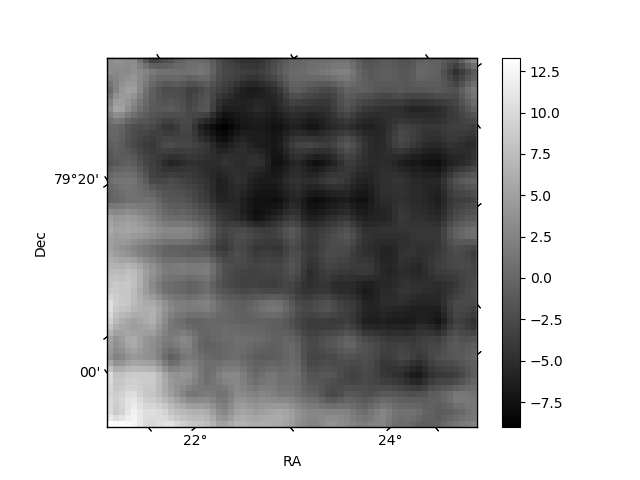
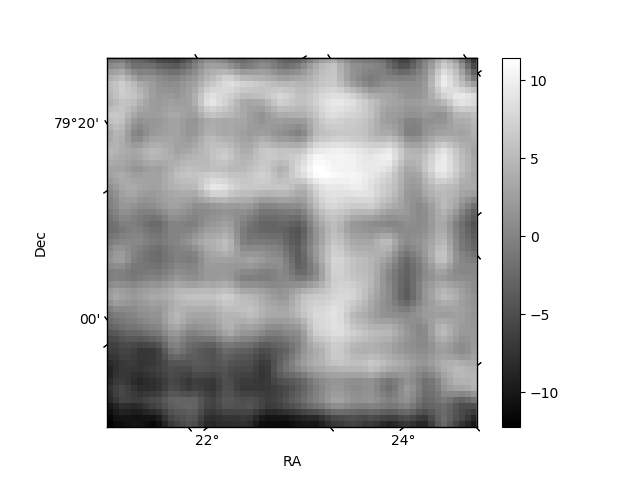
Quadrant B |
|---|---|---|---|
| Quadrant D | 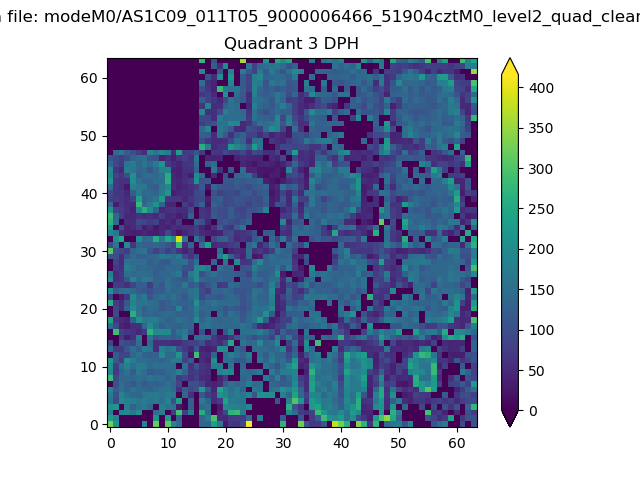 |
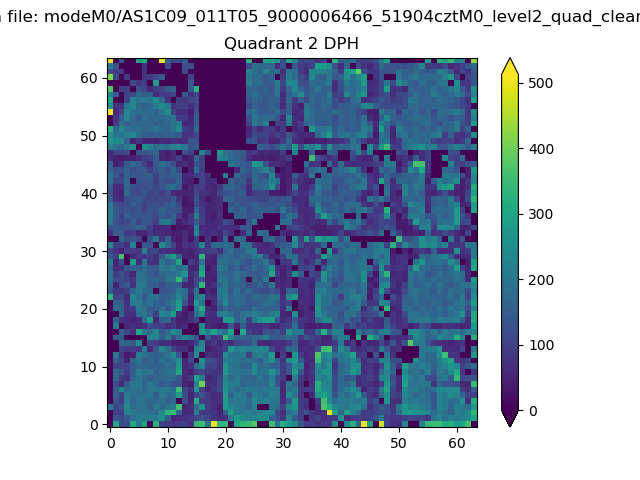 |
Quadrant C |
| Plot type | Count rate plots | Images |
|---|---|---|
| Comparison with Poisson distribution Blue bars denote a histogram of data divided into 1 sec bins. Red curve is a Poisson curve with rate = median count rate of data. |
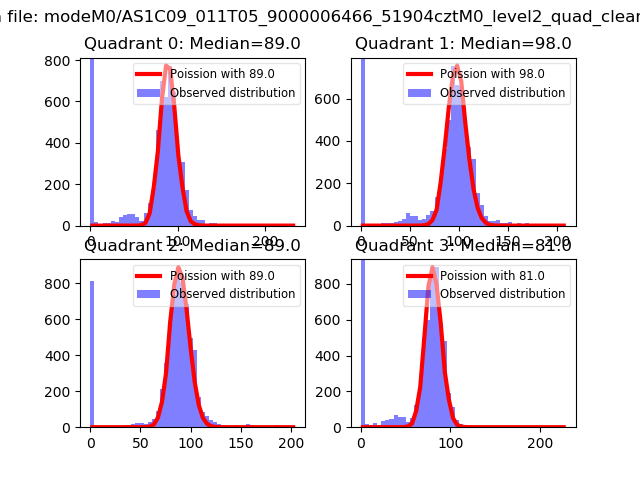 |
 |
| Quadrant-wise count rates Data is divided into 100 sec bins |
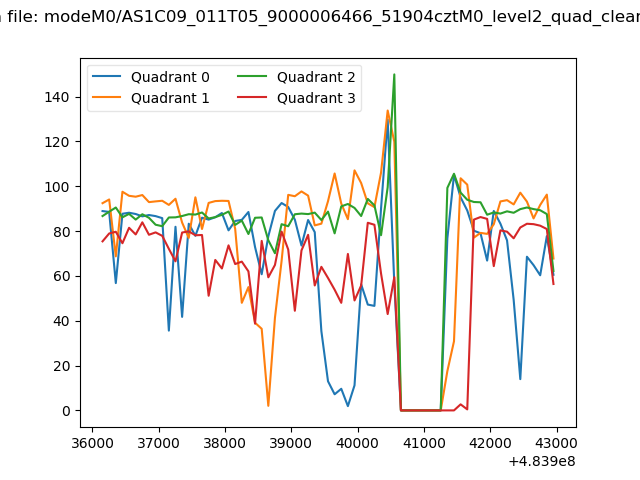 |
|
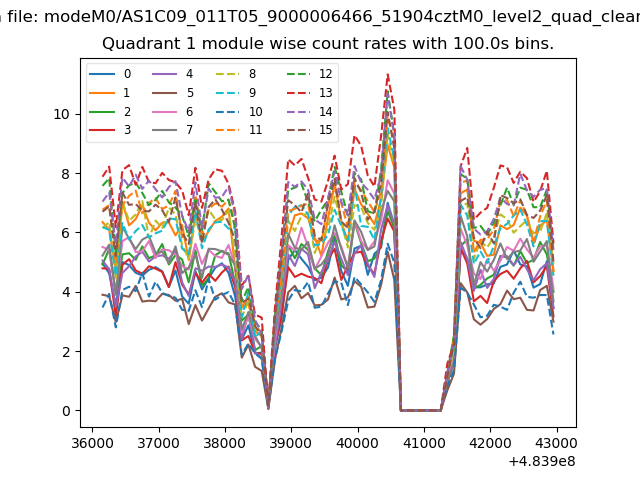
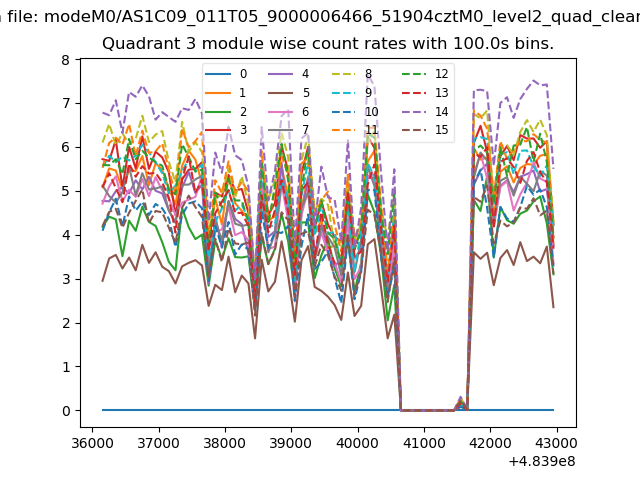
| Module-wise count rates for Quadrant A Data is divided into 100 sec bins |
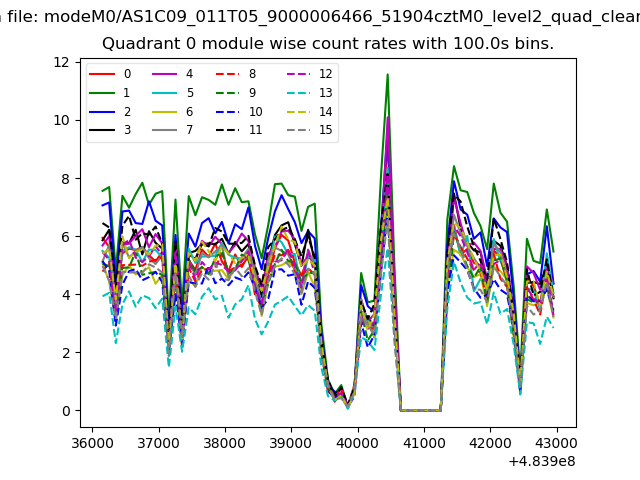 |
 |
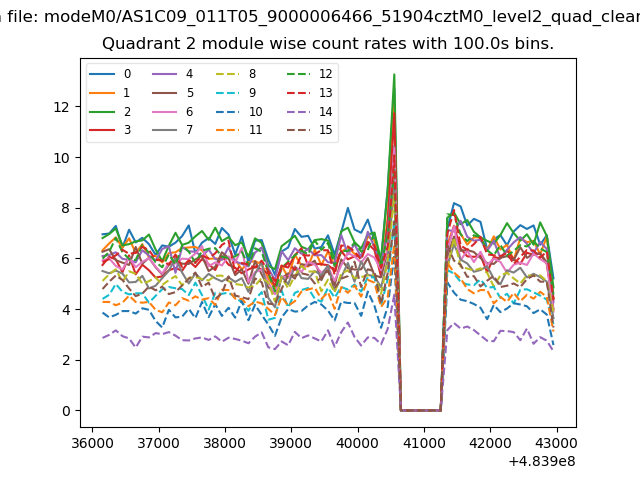
| Module-wise count rates for Quadrant B Data is divided into 100 sec bins |
 |
 |
| Module-wise count rates for Quadrant C Data is divided into 100 sec bins |
 |
 |
| Module-wise count rates for Quadrant D Data is divided into 100 sec bins |
 |
 |
| Parameter | Plot |
|---|---|
| CZT HV Monitor | 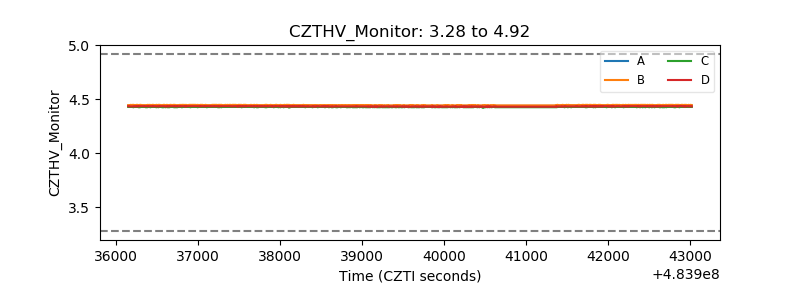 |
| D_VDD | 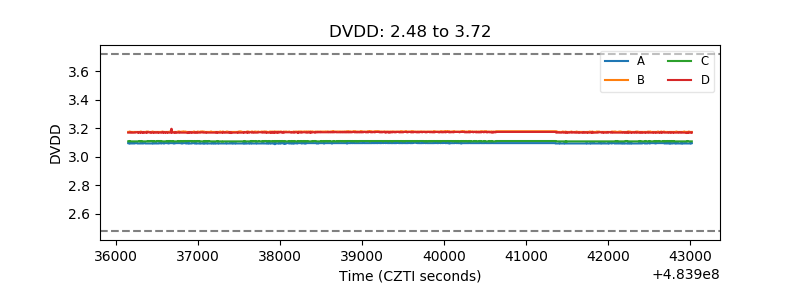 |
| Temperature 1 | 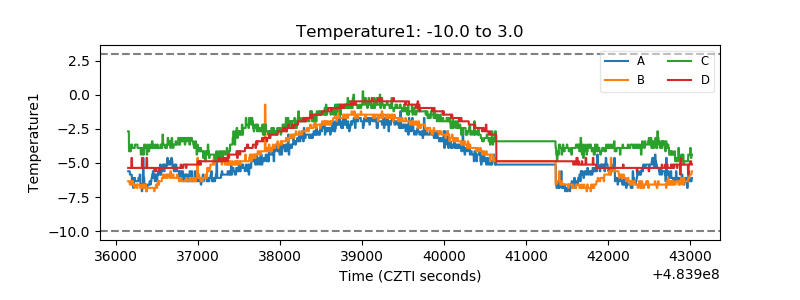 |
| Veto HV Monitor | 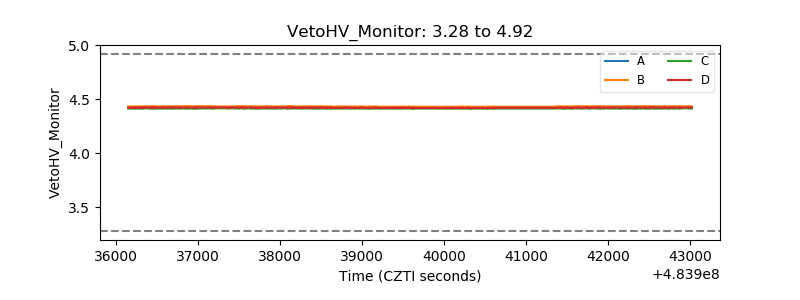 |
| Veto LLD | 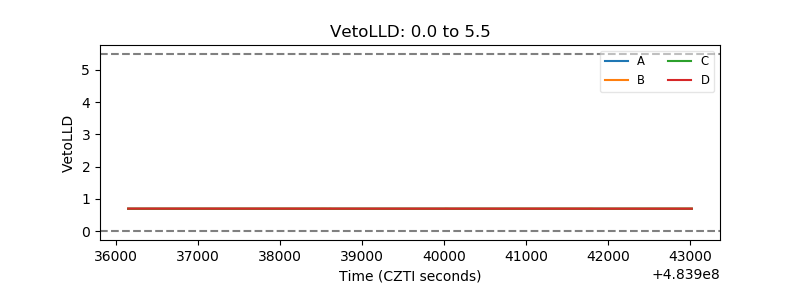 |
| Alpha Counter | 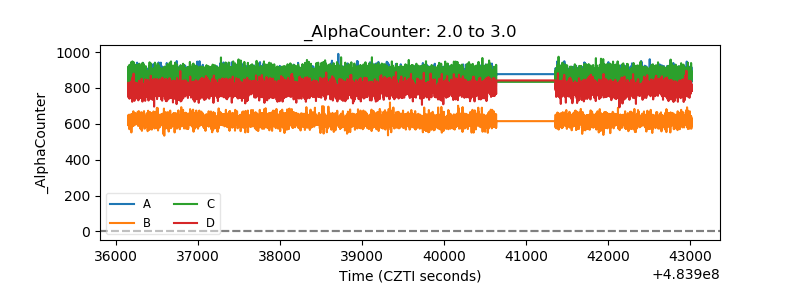 |
| _CPM_Rate | 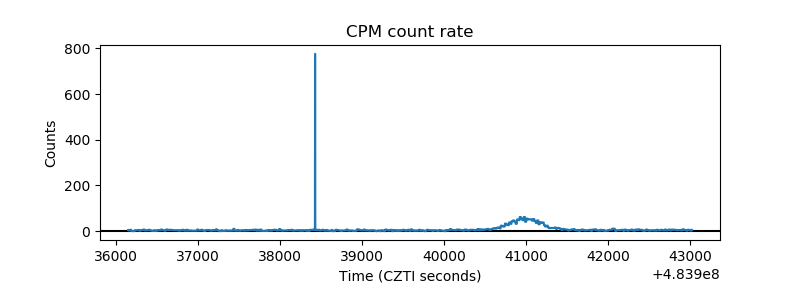 |
| CZT Counter | 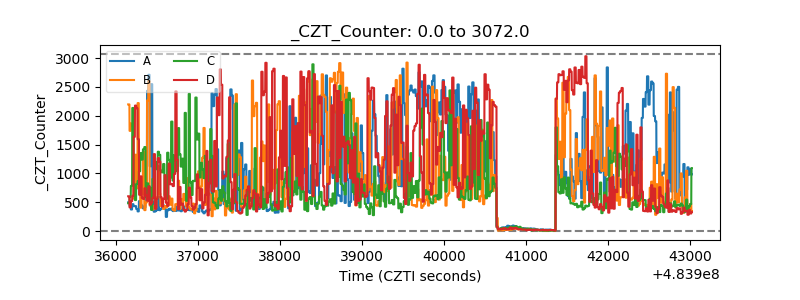 |
| +2.5 Volts monitor | 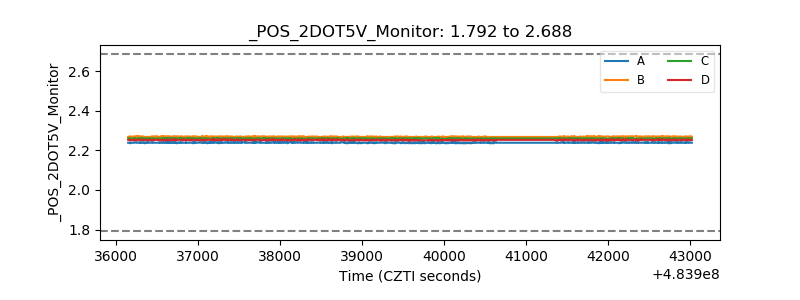 |
| +5 Volts monitor | 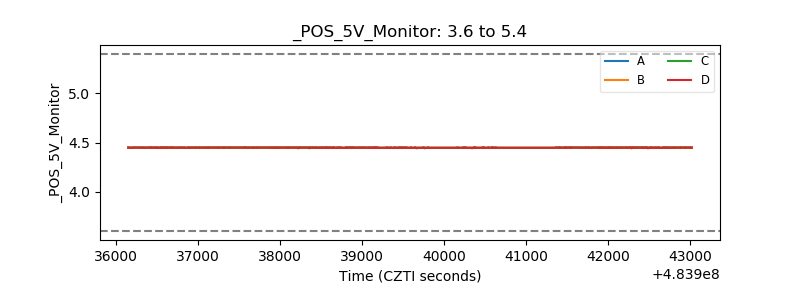 |
| _ROLL_ROT | 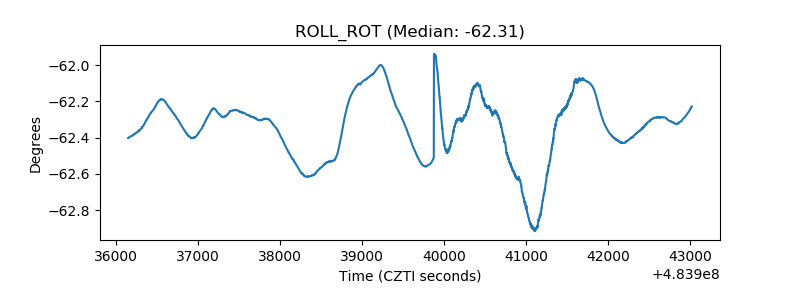 |
| _Roll_DEC | 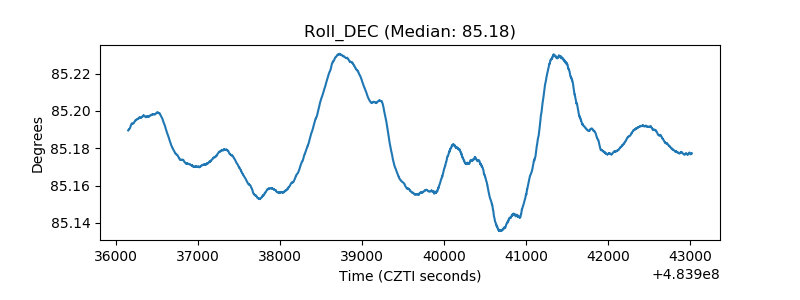 |
| _Roll_RA | 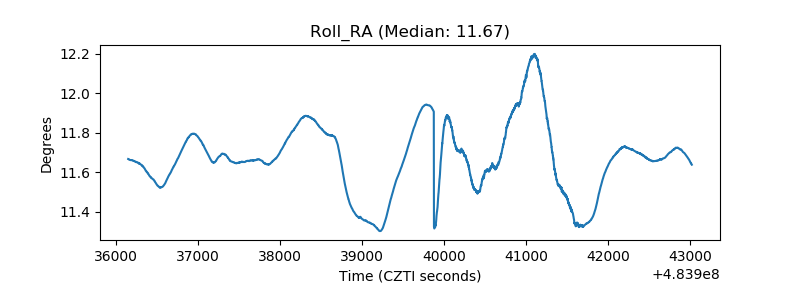 |
| Veto Counter | 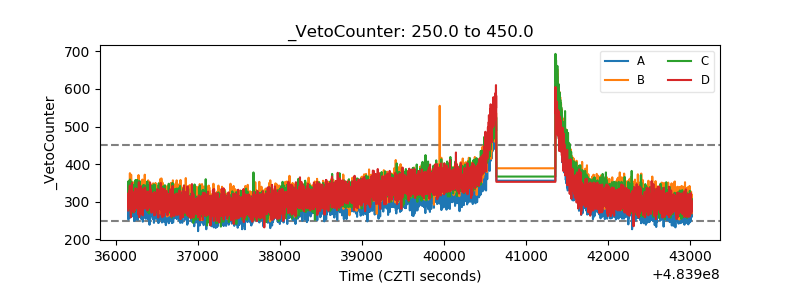 |