| Param | Original file | Final file |
|---|---|---|
| Filename | modeM0/AS1C09_011T05_9000006466_51905cztM0_level2.fits | modeM0/AS1C09_011T05_9000006466_51905cztM0_level2_quad_clean.evt |
| Size (bytes) | 603,023,040 | 96,143,040 |
| Size | 575.1 MB | 91.7 MB |
| Events in quadrant A | 6,874,045 | 593,245 |
| Events in quadrant B | 5,516,123 | 662,125 |
| Events in quadrant C | 4,122,484 | 623,269 |
| Events in quadrant D | 5,271,009 | 548,584 |
| Mode SS | |||
|---|---|---|---|
| Quadrant | BADHDUFLAG | Total packets | Discarded packets |
| A | 0 | 142 | 0 |
| B | 0 | 142 | 0 |
| C | 0 | 142 | 0 |
| D | 0 | 142 | 0 |
| Mode M0 | |||
|---|---|---|---|
| Quadrant | BADHDUFLAG | Total packets | Discarded packets |
| A | 0 | 25292 | 1 |
| B | 0 | 21302 | 1 |
| C | 0 | 17266 | 1 |
| D | 0 | 20794 | 1 |
| Mode M9 | |||
|---|---|---|---|
| Quadrant | BADHDUFLAG | Total packets | Discarded packets |
| A | 0 | 2 | 0 |
| B | 0 | 2 | 0 |
| C | 0 | 2 | 0 |
| D | 0 | 2 | 0 |
| Quadrant | Total seconds | Saturated seconds | Saturation percentage |
|---|---|---|---|
| A | 6946 | 738 | 10.624820% |
| B | 6946 | 510 | 7.342355% |
| C | 6946 | 117 | 1.684423% |
| D | 6946 | 594 | 8.551684% |
Noise dominated data is calculated using 1-second bins in cleaned event files. If a bin has >2000 counts, and if more than 50% of those come from <1% of pixels, then it is considered to be noise-dominated and hence unusable.
| Quadrant | # 1 sec bins | Bins with >0 counts | Bins with >2000 counts | High rate bins dominated by noise | Noise dominated (total time) | Noise dominated (detector-on time) | Marked lightcurve |
|---|---|---|---|---|---|---|---|
| A | 7036 | 6948 | 558 | 558 | 7.93% | 8.03% | 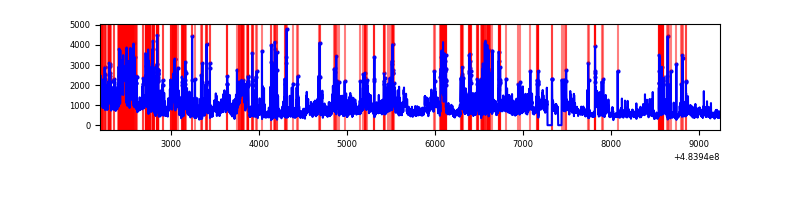 |
| B | 7036 | 6948 | 187 | 187 | 2.66% | 2.69% | 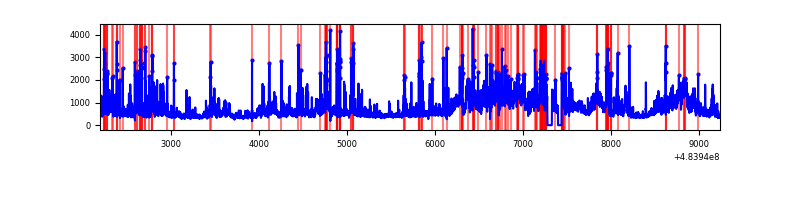 |
| C | 7036 | 6948 | 63 | 63 | 0.90% | 0.91% | 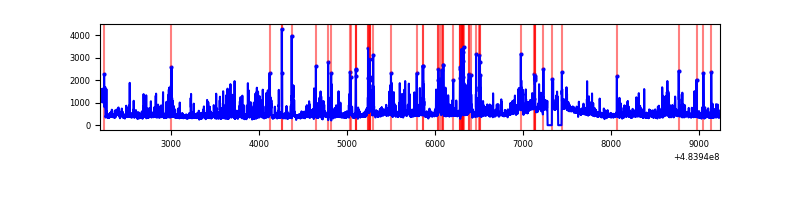 |
| D | 7036 | 6948 | 471 | 471 | 6.69% | 6.78% | 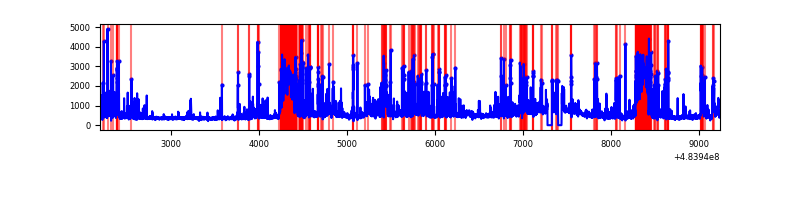 |
Top three noisy pixels from each quadrant. If the there are fewer than three noisy pixels in the level2.evt file, extra rows are filled as -1
| Pixel properties | Quadrant properties | ||||||
|---|---|---|---|---|---|---|---|
| Quadrant | DetID | PixID | Counts | Sigma | Mean | Median | Sigma |
| A | 7 | 64 | 1031751 | 6029.5 | 699 | 683 | 171.0 |
| A | 12 | 3 | 547536 | 3197.9 | 699 | 683 | 171.0 |
| A | 11 | 3 | 494386 | 2887.09 | 699 | 683 | 171.0 |
| B | 10 | 254 | 1418244 | 9327.29 | 711 | 688 | 152.0 |
| B | 12 | 32 | 429773 | 2823.31 | 711 | 688 | 152.0 |
| B | 5 | 172 | 249599 | 1637.79 | 711 | 688 | 152.0 |
| C | 15 | 224 | 308541 | 1592.99 | 704 | 698 | 193.2 |
| C | 15 | 248 | 155257 | 799.8 | 704 | 698 | 193.2 |
| C | 13 | 3 | 149307 | 769.01 | 704 | 698 | 193.2 |
| D | 8 | 176 | 715729 | 3759.38 | 680 | 652 | 190.2 |
| D | 3 | 12 | 680423 | 3573.76 | 680 | 652 | 190.2 |
| D | 2 | 249 | 246931 | 1294.76 | 680 | 652 | 190.2 |
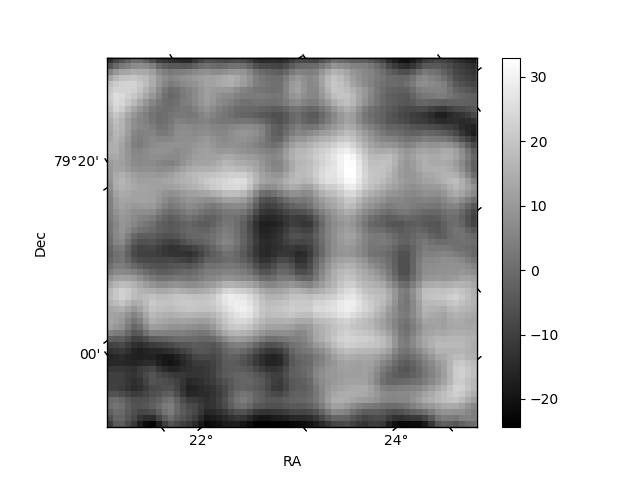
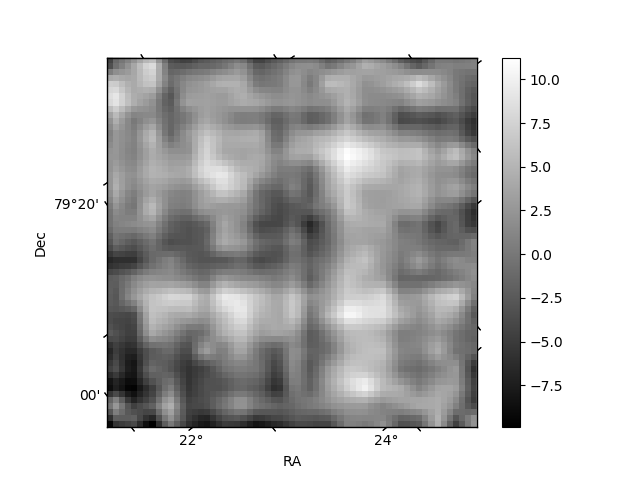
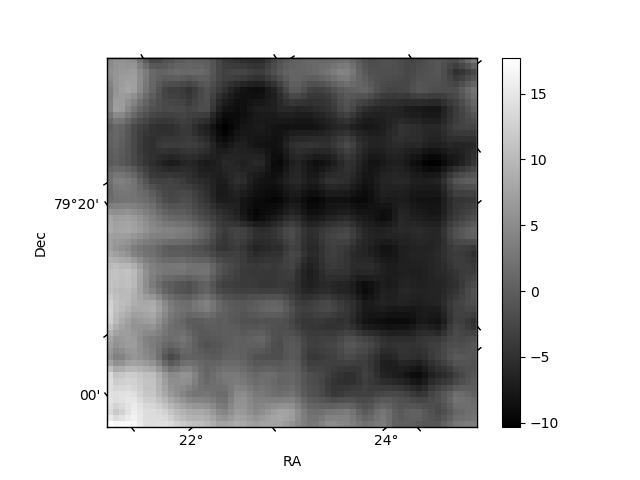
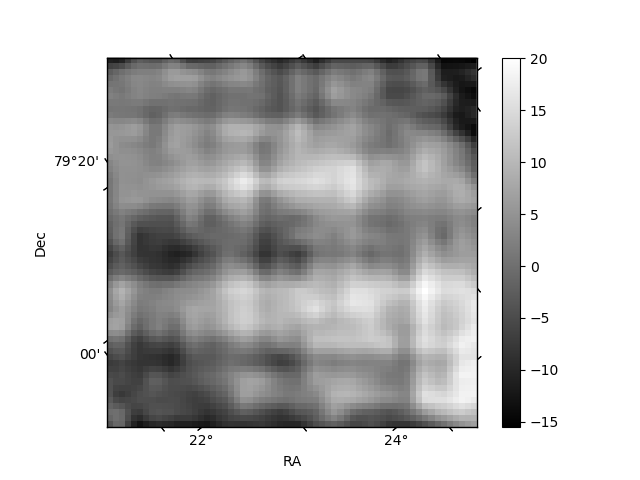
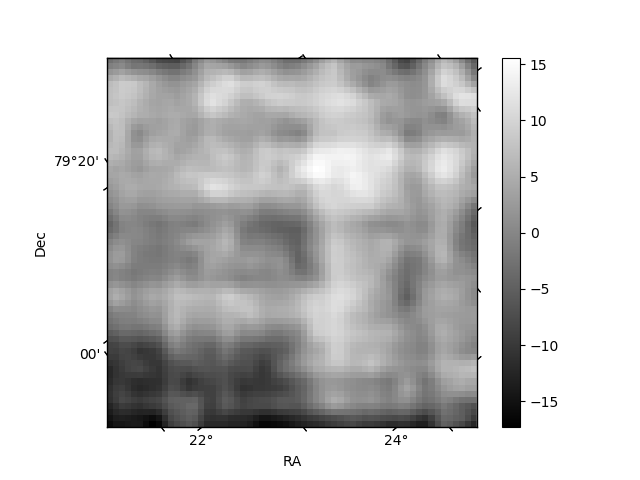
Histogram calculated using DETX and DETY for each event in the final _common_clean file
| Quadrant A | 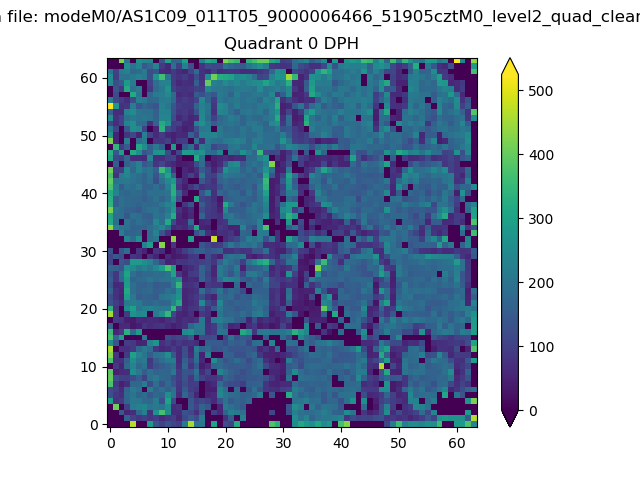 |
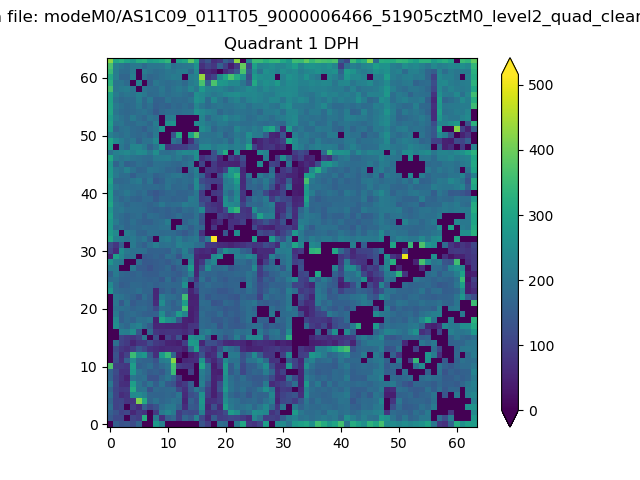 |
Quadrant B |
|---|---|---|---|
| Quadrant D | 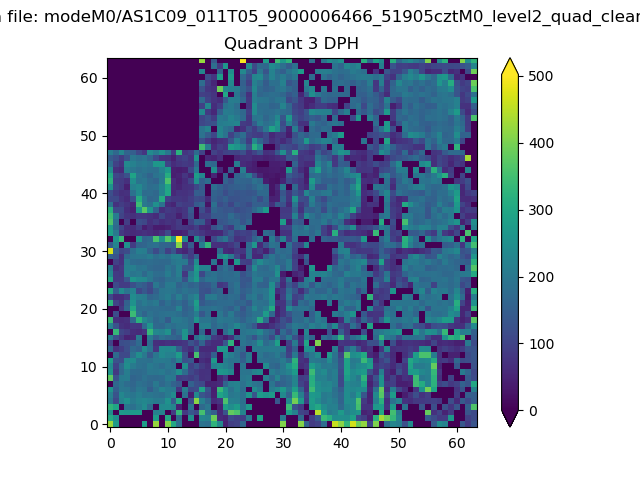 |
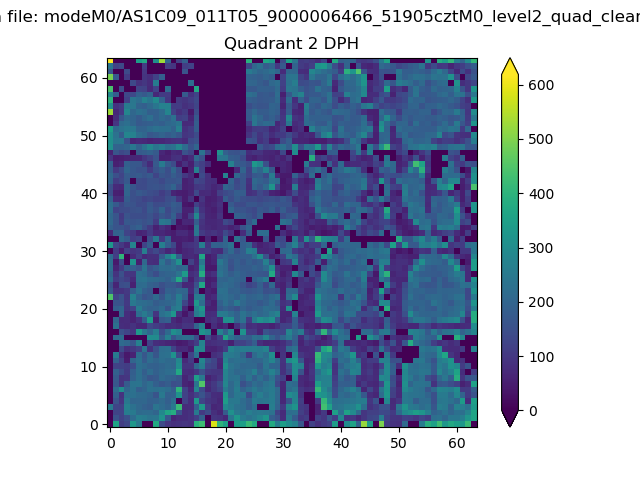 |
Quadrant C |
| Plot type | Count rate plots | Images |
|---|---|---|
| Comparison with Poisson distribution Blue bars denote a histogram of data divided into 1 sec bins. Red curve is a Poisson curve with rate = median count rate of data. |
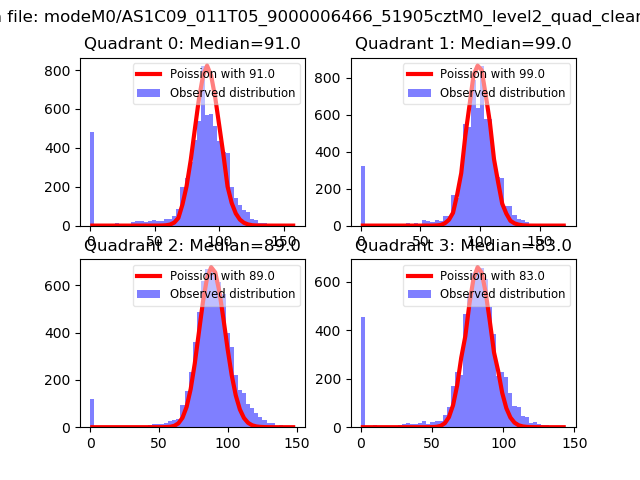 |
 |
| Quadrant-wise count rates Data is divided into 100 sec bins |
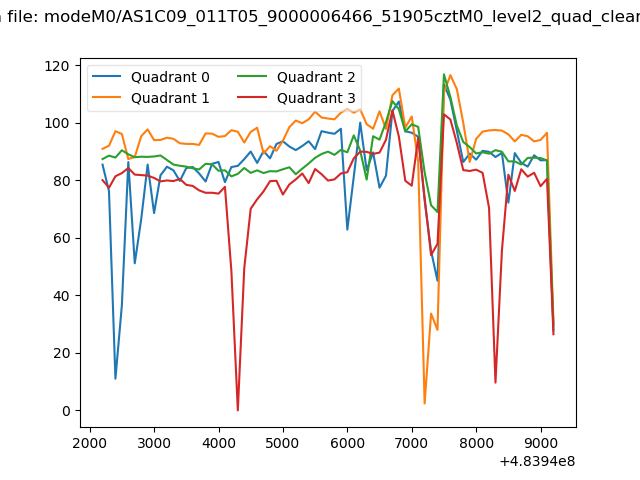 |
|
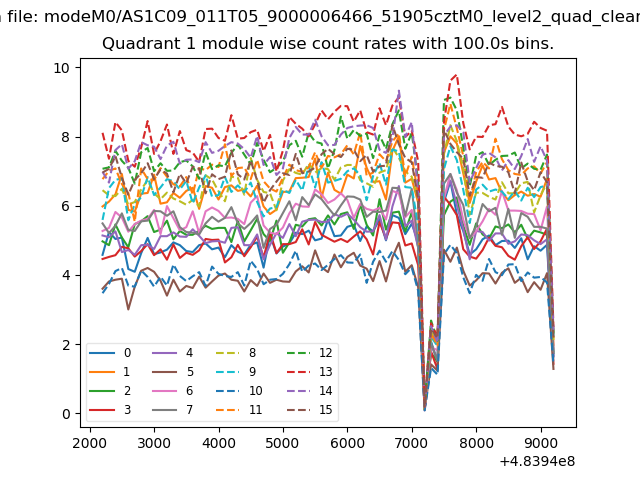
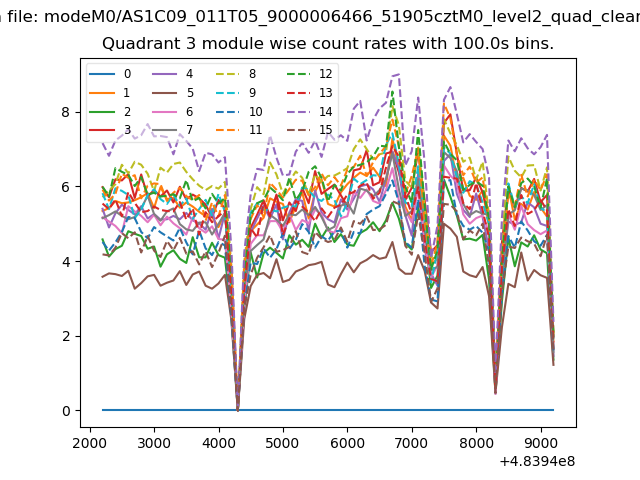
| Module-wise count rates for Quadrant A Data is divided into 100 sec bins |
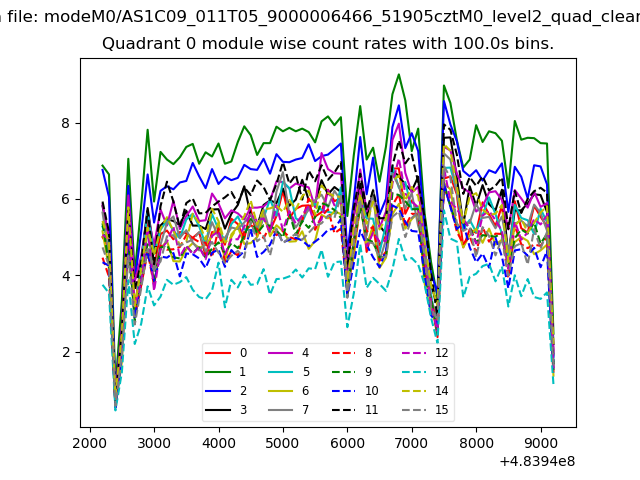 |
 |
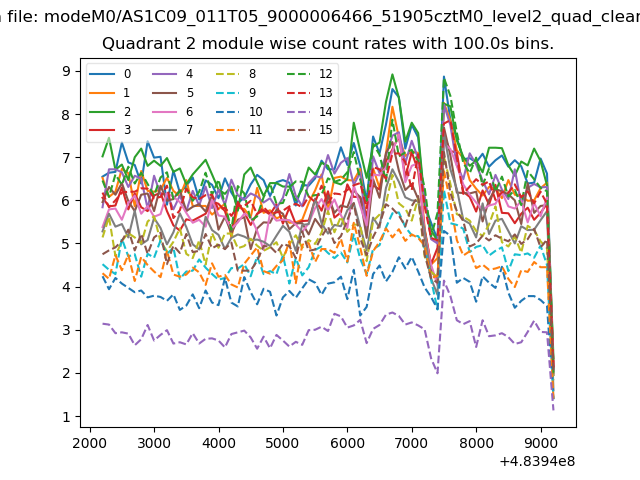
| Module-wise count rates for Quadrant B Data is divided into 100 sec bins |
 |
 |
| Module-wise count rates for Quadrant C Data is divided into 100 sec bins |
 |
 |
| Module-wise count rates for Quadrant D Data is divided into 100 sec bins |
 |
 |
| Parameter | Plot |
|---|---|
| CZT HV Monitor | 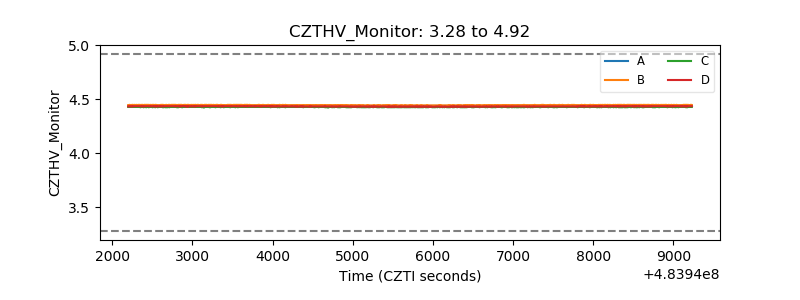 |
| D_VDD | 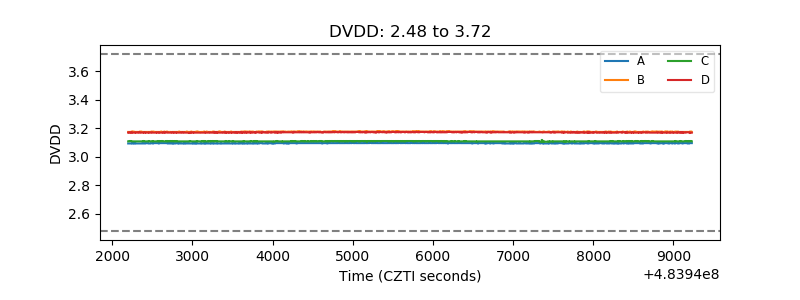 |
| Temperature 1 | 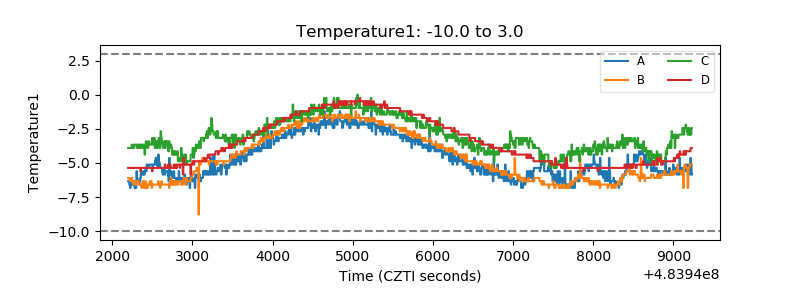 |
| Veto HV Monitor | 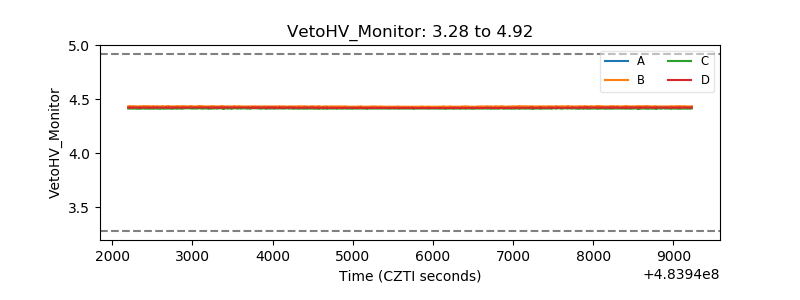 |
| Veto LLD | 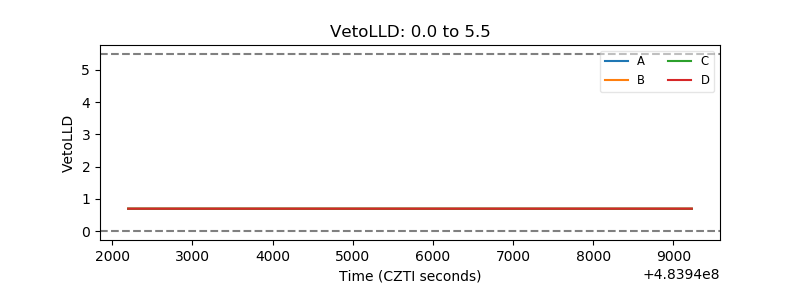 |
| Alpha Counter | 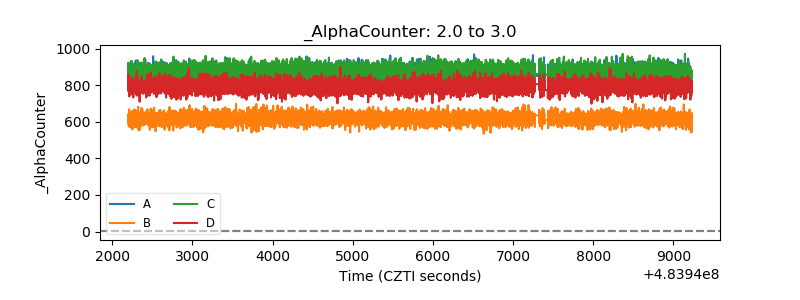 |
| _CPM_Rate | 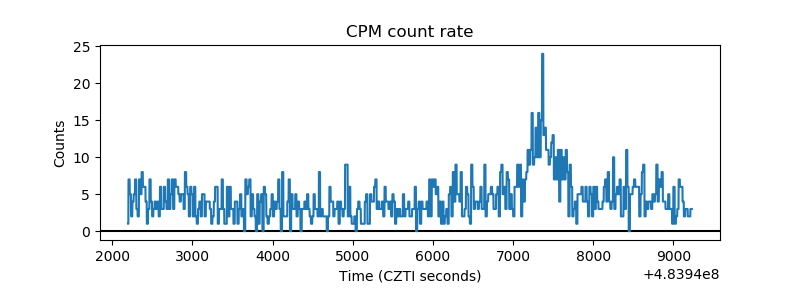 |
| CZT Counter | 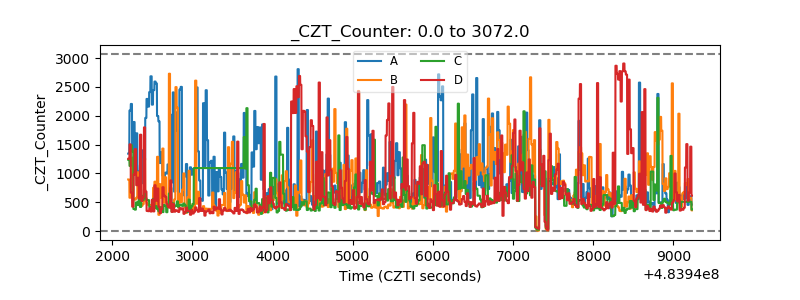 |
| +2.5 Volts monitor | 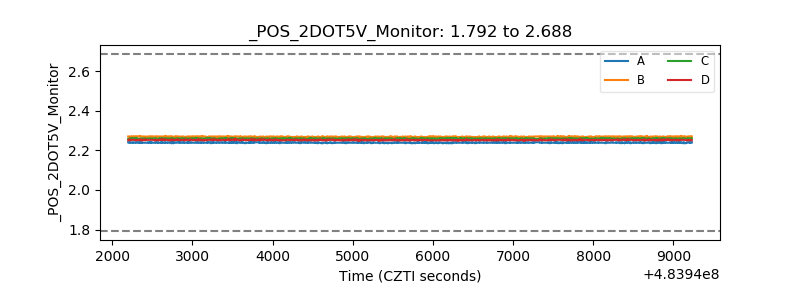 |
| +5 Volts monitor | 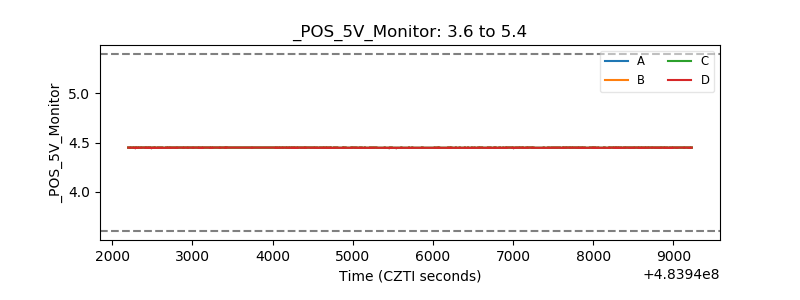 |
| _ROLL_ROT | 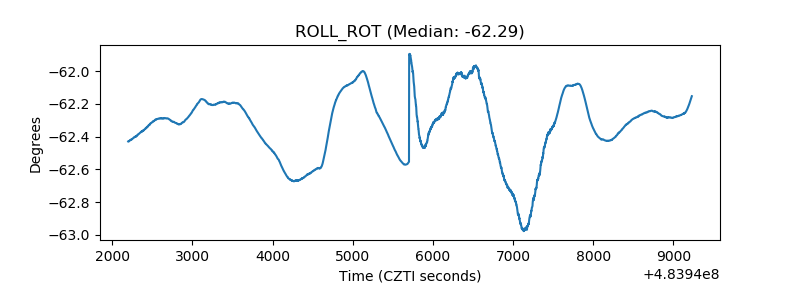 |
| _Roll_DEC | 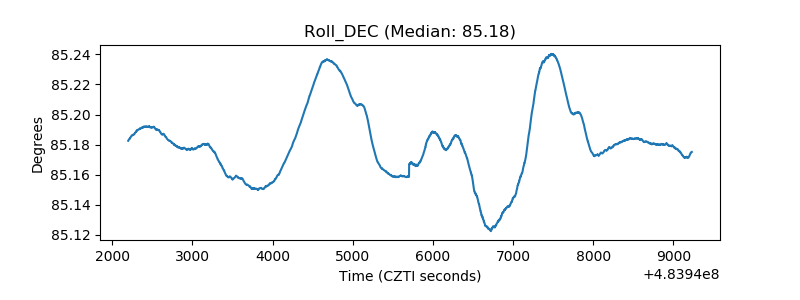 |
| _Roll_RA | 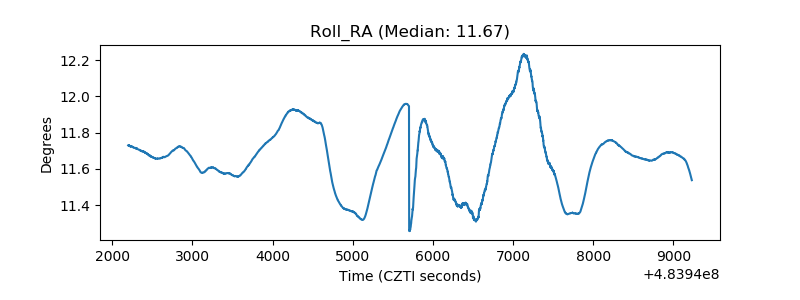 |
| Veto Counter | 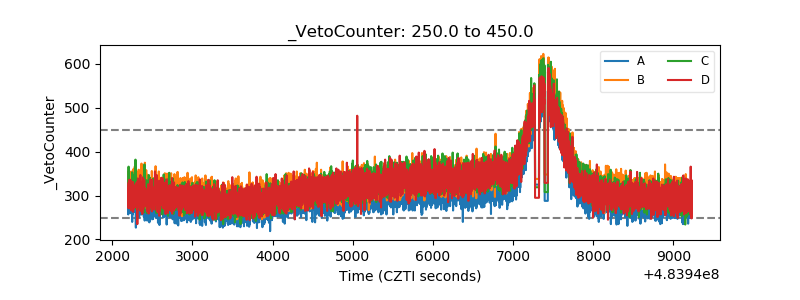 |